
Peanut Butter Market Report by Product Type (Smooth Peanut Butter, Crunchy Peanut Butter, and Others), Distribution Channel (Supermarkets and Hypermarkets, Convenience Stores, Online Stores, and Others), and Region 2026-2034
Peanut Butter Market Size:
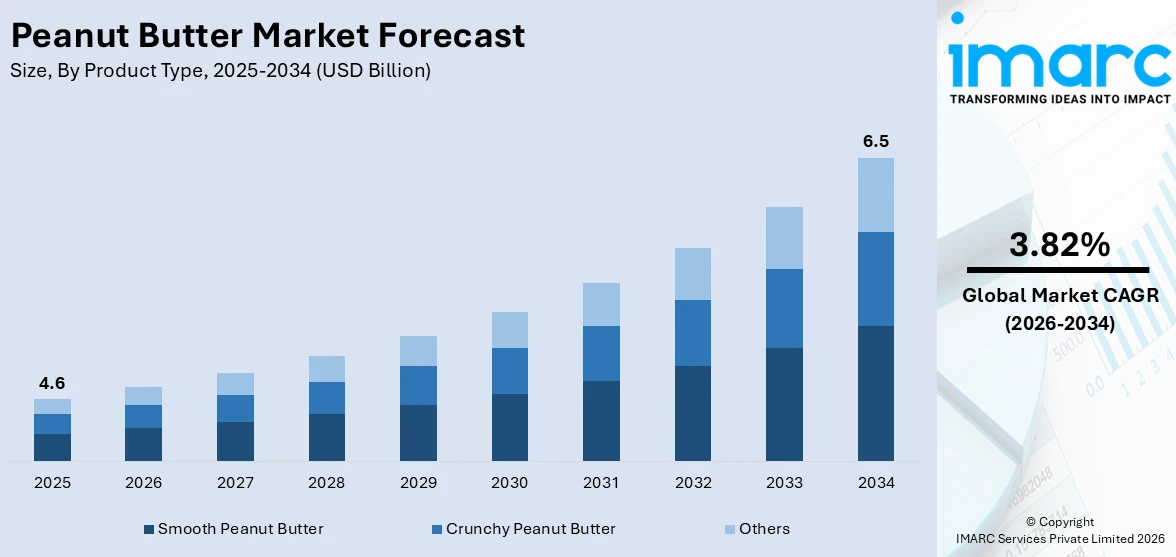
The global peanut butter market size reached USD 4.6 Billion in 2025. Looking forward, IMARC Group expects the market to reach USD 6.5 Billion by 2034, exhibiting a growth rate (CAGR) of 3.82% during 2026-2034. The market is primarily driven by the consumer demand for healthy plant-based protein food options, increasing peanut production, innovations in flavor and product varieties, and expanding online and traditional retail outlets.
|
Report Attribute
|
Key Statistics
|
|---|---|
|
Base Year
|
2025
|
|
Forecast Years
|
2026-2034
|
|
Historical Years
|
2020-2025
|
|
Market Size in 2025
|
USD 4.6 Billion |
|
Market Forecast in 2034
|
USD 6.5 Billion |
|
Market Growth Rate 2026-2034
|
3.82% |
Peanut Butter Market Analysis:
- Major Market Drivers: The changing consumer preferences for nutrient-dense high-protein foods, and the growing awareness regarding peanut butter's numerous culinary uses from smoothies to sandwiches is driving its market growth. Furthermore, the escalating demand for premium and organic peanut butter products is growing due to growing disposable incomes.
- Key Market Trends: The market is moving toward natural and organic peanut butter products as customers are looking for cleaner label choices due to becoming more health conscious. Besides, novel product innovations like chocolate and honey-flavored peanut butter and easy-to-use single-serve packaging are becoming popular among consumers. Furthermore, smaller brands may compete with big firms and reach a wider audience due to the expanding online shopping platforms.
- Geographical Trends: North America is dominating the market due to the growing health trends and sustainability concerns regarding natural and organic peanut butter varieties. Also, the popularity of Western food trends and rising urbanization in Asia-Pacific is influencing the market growth.
- Competitive Landscape: Some of the major market players in the peanut butter industry include Alpino Health Foods, DiSano, Dr. Oetker, Hormel Foods Corporation, Justin's, LLC, Kraft Heinz, Pintola, Sonya Foods Pvt. Ltd., The Hershey Company, The J.M. Smucker Company, The Leavitt Corporation, Unilever plc, among many others.
- Challenges and Opportunities: The challenges include maintaining stable product pricing brought on by supply chain interruptions, rising peanut costs due to climate change, and market dynamics are also being impacted by regulatory issues with food safety and labeling regulations. On the other hand, opportunities comprise product innovation, particularly in terms of useful components and environmentally friendly packaging options, expansion of undiscovered regions, and growing e-commerce platforms.
To get more information on this market Request Sample
Peanut Butter Market Trends:
Growing Demand for Plant-Based Proteins
According to the latest data compiled by the Plant Based Foods Association and The Good Food Institute, based on SPINS data, retail sales of plant-based foods in the United States witnessed a notable 6.2% increase in 2021 compared to the previous record-breaking year of 2020. This growth has reached the total market value of plant-based foods to US$7.4 Billion. Additionally, the growth in the market for plant-based foods is indicative of a shift in consumer diets. Moreover, consumers are becoming more inclined to choose meals and products that they believe to be healthy and more eco-friendly like peanut butter. Besides, peanut butter is widely adopted due to its high protein content, low cost, and potential to be used in a wide range of culinary applications. Furthermore, the increasing demand for plant-based proteins like peanut butter is growing due to shifting consumer preference toward vegetarian and vegan diets. Hence, this change is limited to nutrition and reflects tendencies toward environmental responsibility and health consciousness, which has made peanut butter a popular alternative for people looking for wholesome, sustainable food options across the globe.
Expansion of Retail Channels
The significant expansion of peanut butter availability across various retail channels, particularly through online platforms, has contributed to peanut butter market growth. According to the Census Bureau of the Department of Commerce reported that U.S. retail e-commerce sales for the first quarter of 2024, reached US$289.2 Billion representing a 2.1% increase from the fourth quarter of 2023. Total retail sales for the first quarter of 2024 were estimated at US$1,820.0 Billion from the previous quarter. Comparing year-over-year, e-commerce sales in the first quarter of 2024 increased by 8.6% while total retail sales increased by 1.5%. E-commerce sales accounted for 15.9% of total retail sales in the first quarter of 2024. This highlights how digital shopping platforms are integral to consumer purchasing patterns due to the convenience of online shopping, which allows consumers to access a wide array of peanut butter varieties from organic and natural to gourmet flavors more easily. As e-commerce continues to grow, manufacturers are prompted to innovate and expand their product lines to cater to the diverse preferences and dietary needs of a broader audience, thus generating peanut butter market revenue.
Increase in Peanut Production
The steady increase in U.S. peanut production, as reported by the UNITED STATES DEPARTMENT of AGRICULTURE (USDA)’s National Agricultural Statistics Service (NASS), the 2022 U.S. peanut crop was projected at 5.57 Billion pounds. In addition, Georgia is responsible for over 50% of the nation's peanut production, leading all states with an estimated 2.9 Billion pounds of peanuts harvested in 2022. Additionally, with annual production reaching about 5.57 Billion pounds, there is a stable supply chain that can meet rising consumer demand efficiently. Moreover, this abundance of raw material helps in maintaining reasonable peanut butter prices, thereby making it accessible to a wider demographic. As peanut production continues to flourish, it supports the existing market demand and paves the way for new business opportunities within the sector, thus creating a positive peanut butter market outlook.
Peanut Butter Market Segmentation:
IMARC Group provides an analysis of the key trends in each segment of the market, along with forecasts at the global, regional, and country levels for 2026-2034. Our report has categorized the market based on product type and distribution channel.
Breakup by Product Type:
- Smooth Peanut Butter
- Crunchy Peanut Butter
- Others
Smooth peanut butter accounts for the majority of the market share
The report has provided a detailed breakup and analysis of the market based on the product type. This includes smooth peanut butter, crunchy peanut butter, and others. According to the report, smooth peanut butter represented the largest segment.
According to the peanut butter market overview, smooth peanut butter holds the largest market share. Additionally, smooth peanut butter is preferred for its creamy texture and uniform consistency, making it a popular choice for spreads in sandwiches and as a base for various recipes. It benefits from its widespread acceptance among consumers who favor its ease of spreading and mild flavor profile, which pairs well with a variety of ingredients. For instance, on 28th May 2024, as per the study published in the New England Journal of Medicine (NEJM) Evidence journal, recent findings indicate that introducing smooth peanut butter to children during infancy and early childhood may significantly lower their chances of developing a peanut allergy later in life. Compared to avoiding peanuts altogether, starting peanut consumption from around 4 months old in a soft pureed form and continuing until about 5 years old was linked to a 71% lower incidence of peanut allergy among adolescents in the UK.
Breakup by Distribution Channel:
Access the comprehensive market breakdown Request Sample
- Supermarkets and Hypermarkets
- Convenience Stores
- Online Stores
- Others
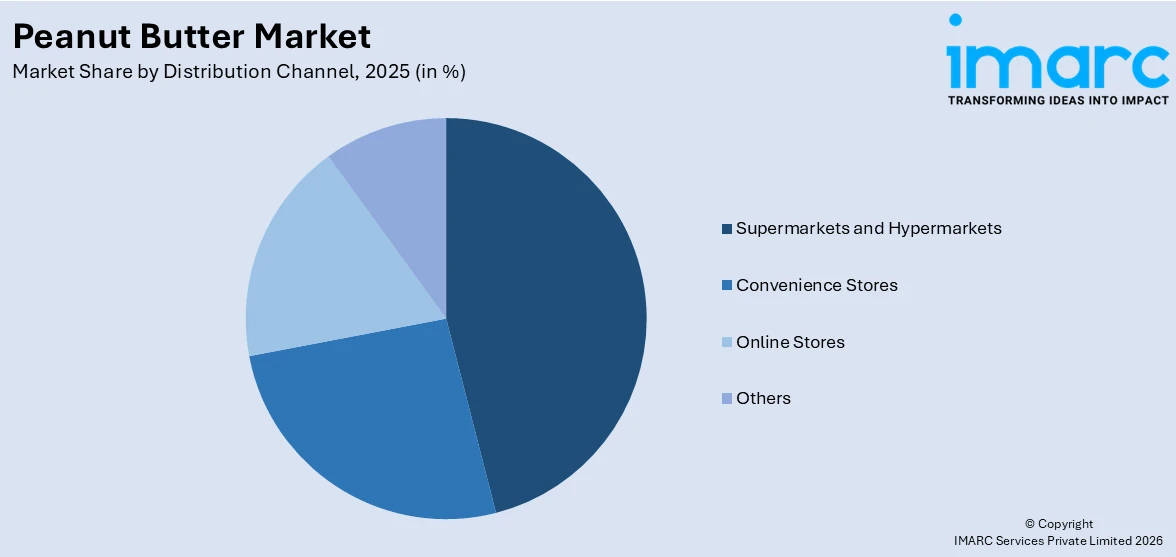
Supermarkets and hypermarkets hold the largest share of the industry
A detailed breakup and analysis of the market based on the distribution channel have also been provided in the report. This includes supermarkets and hypermarkets, convenience stores, online stores, and others. According to the report, supermarkets and hypermarkets accounted for the largest market share.
Supermarkets and hypermarkets represent the largest segment. It is attributed to the comprehensive variety and accessibility of peanut butter brands that these large retail formats offer, appealing to a broad consumer base seeking convenience and value. Additionally, supermarkets and hypermarkets benefit from high foot traffic, which enhances product visibility and drives sales. They also provide the advantage of immediate gratification for consumers who prefer to assess product quality directly before purchase. According to peanut butter recent developments, key players are introducing advanced product variants to meet these needs. For instance, SKIPPY peanut butter, a beloved brand, made its comeback on 15th May 2024 in the Canadian retail market with five new snack innovations inspired by its signature ingredient. These innovative peanut butter-based snacks will soon be widely available across Canada, offering consumers a fresh take on a familiar favorite.

Breakup by Region:
- North America
- United States
- Canada
- Asia Pacific
- China
- Japan
- India
- South Korea
- Australia
- Indonesia
- Others
- Europe
- Germany
- France
- United Kingdom
- Italy
- Spain
- Russia
- Others
- Latin America
- Brazil
- Mexico
- Others
- Middle East and Africa
North America leads the market, accounting for the largest peanut butter market share
The report has also provided a comprehensive analysis of all the major regional markets, which include North America (the United States and Canada); Europe (Germany, France, the United Kingdom, Italy, Spain, Russia, and others); Asia Pacific (China, Japan, India, South Korea, Australia, Indonesia, and others); Latin America (Brazil, Mexico, and others); and the Middle East and Africa. According to the report, North America was the largest regional market for peanut butter.
According to the peanut butter market forecast, the North America region holds the largest market share in the global peanut butter industry, primarily driven by the United States, where peanut butter is a staple food item in many households. It is attributed to increasing consumer demand, coupled with a strong presence of leading peanut butter brands that offer a variety of flavors and formulations tailored to diverse consumer preferences. Additionally, the increasing awareness regarding protein-rich diets and the convenience of peanut butter as a quick meal option are increasing peanut butter demand across the region. Moreover, innovative marketing strategies and the introduction of healthier options, like reduced-fat and no-additive varieties, continue to attract health-conscious consumers. For instance, on 1st May 2024, Jif America's leading peanut butter brand, introduced Jif Peanut Butter & Chocolate Flavored Spread, its most significant flavor innovation in almost ten years. It features the rich, creamy consistency and savory, peanut-flavored delight of Jif peanut butter, infused with the sweet essence of a chocolate-flavored spread. It also boasts 50% less sugar than the top-selling cocoa hazelnut spread. Moreover, the sugar content has been reduced from 21g to 10g.
Competitive Landscape:
At present, key players in the peanut butter market are actively employing strategies to enhance market growth, focusing on product innovation, strategic partnerships, and global expansion. Additionally, companies are leveraging modern marketing techniques, including digital campaigns and social media engagement, to connect with younger demographics and expand their customer base. Moreover, the peanut butter market recent opportunities allow numerous brands to introduce new flavors and healthier variants, such as organic, low-sodium, and no-sugar-added peanut butter, to cater to the evolving consumer preferences toward health-conscious eating. Furthermore, new product launches, collaborations with retailers, and expansion into new geographic markets through initiatives are driving the peanut butter industry. For instance, on 4 June 2024, REESE'S Jumbo Cup delivers an oversized portion of consumers’ favorite flavors. It is equivalent to four REESE'S King Size Cups in one, this mega-sized treat maintains the perfect chocolate-to-peanut butter ratio that enthusiasts cherish.
The report provides a comprehensive analysis of the competitive landscape in the global peanut butter market with detailed profiles of all major companies, including:
- Alpino Health Foods
- DiSano
- Dr. Oetker
- Hormel Foods Corporation
- Justin's, LLC
- Kraft Heinz
- Pintola
- Sonya Foods Pvt. Ltd.
- The Hershey Company
- The J.M. Smucker Company
- The Leavitt Corporation
- Unilever plc
Peanut Butter Market News:
- May 7, 2024: SKIPPY, the iconic American peanut butter brand, has been named the official peanut butter partner of USA Gymnastics (USAG). As the official partner, SKIPPY peanut butter will support the upcoming generations of athletes by providing nutritious, protein-rich snacks at USAG's major events and national team camps. The SKIPPY team also plans to collaborate with USAG on creating engaging content across various media platforms.
- 20th June 2024: Hershey, ONE Brands introduces the new Reese's Peanut Butter Lovers flavor protein bar, bringing the beloved taste of Reese's peanut butter to the protein aisle, allowing consumers to enjoy the familiar smooth and delicious flavor in a healthier format, boasting 18 grams of protein and just 3 grams of sugar.
Peanut Butter Market Report Scope:
| Report Features | Details |
|---|---|
| Base Year of the Analysis | 2025 |
| Historical Period | 2020-2025 |
| Forecast Period | 2026-2034 |
| Units | '000 Tons, Billion USD |
| Scope of the Report | Exploration of Historical Trends and Market Outlook, Industry Catalysts and Challenges, Segment-Wise Historical and Future Market Assessment:
|
| Product Types Covered | Smooth Peanut Butter, Crunchy Peanut Butter, Others |
| Distribution Channels Covered | Supermarkets and Hypermarkets, Convenience Stores, Online Stores, Others |
| Regions Covered | Asia Pacific, Europe, North America, Latin America, Middle East and Africa |
| Countries Covered | United States, Canada, Germany, France, United Kingdom, Italy, Spain, Russia, China, Japan, India, South Korea, Australia, Indonesia, Brazil, Mexico |
| Companies Covered | Alpino Health Foods, DiSano, Dr. Oetker, Hormel Foods Corporation, Justin's, LLC, Kraft Heinz, Pintola, Sonya Foods Pvt. Ltd., The Hershey Company, The J.M. Smucker Company, The Leavitt Corporation, Unilever plc, etc. |
| Customization Scope | 10% Free Customization |
| Post-Sale Analyst Support | 10-12 Weeks |
| Delivery Format | PDF and Excel through Email (We can also provide the editable version of the report in PPT/Word format on special request) |
Key Benefits for Stakeholders:
- IMARC’s industry report offers a comprehensive quantitative analysis of various market segments, historical and current market trends, market forecasts, and dynamics of the peanut butter market from 2020-2034.
- The research report provides the latest information on the market drivers, challenges, and opportunities in the global peanut butter market.
- The study maps the leading, as well as the fastest-growing, regional markets. It further enables stakeholders to identify the key country-level markets within each region.
- Porter's five forces analysis assists stakeholders in assessing the impact of new entrants, competitive rivalry, supplier power, buyer power, and the threat of substitution. It helps stakeholders to analyze the level of competition within the peanut butter industry and its attractiveness.
- The competitive landscape allows stakeholders to understand their competitive environment and provides insight into the current positions of key players in the market.
Frequently Asked Questions About the Peanut Butter Market Report
The global peanut butter market was valued at USD 4.6 Billion in 2025.
According to the estimates by IMARC Group, the global peanut butter market is expected to exhibit a CAGR of 3.82% during 2026-2034.
Due to the rising health consciousness, consumers are adopting healthier food options with plant-based ingredients, thereby representing one of the key drivers for the global peanut butter market.
Several manufacturers are adopting innovative marketing strategies to reach a broader consumer base, which acts as one of the key trends in the global peanut butter market.
Sudden outbreak of the COVID-19 pandemic had led to the implementation of stringent lockdown regulations across several nations resulting in the shift from brick-and-mortar distributional channels towards e-commerce platforms for the sales of peanut butter.
On the basis of the product type, the market has been bifurcated into smooth peanut butter, crunchy peanut butter, and others. Currently, smooth peanut butter holds the majority of the total market share.
On the basis of the distribution channel, the market has been classified into supermarkets and hypermarkets, convenience stores, online stores, and others. Among these, supermarkets and hypermarkets represent the largest segment.
Region-wise, the market has been classified into North America, Europe, Asia Pacific, Middle East and Africa, and Latin America, where North America dominates the global market.
The key companies in the global peanut butter market are Alpino Health Foods, DiSano, Dr. Oetker, Hormel Foods Corporation, Justin's, LLC, Kraft Heinz, Pintola, Sonya Foods Pvt. Ltd., The Hershey Company, The J.M. Smucker Company, The Leavitt Corporation and Unilever plc.
Need more help?
- Speak to our experienced analysts for insights on the current market scenarios.
- Include additional segments and countries to customize the report as per your requirement.
- Gain an unparalleled competitive advantage in your domain by understanding how to utilize the report and positively impacting your operations and revenue.
- For further assistance, please connect with our analysts.
 Request Customization
 Speak to an Analyst
 Request Brochure
 Inquire Before Buying
Benefits of Customization
- Personalize this research
- Triangulate with your data
- Get data as per your format and definition
- Gain a deeper dive into a specific application, geography, customer, or competitor
- Any level of personalization
Get in Touch With Us
UNITED STATES
Phone: +1-201-971-6302
INDIA
Phone: +91-120-433-0800
UNITED KINGDOM
Phone: +44-753-714-6104
Email: [email protected]
Client Testimonials


.webp)


