
Performance Analytics Market Size, Share, Trends and Forecast by Component, Deployment Mode, Organization Size, Application, Industry Vertical, and Region, 2026-2034
Performance Analytics Market Size and Share:
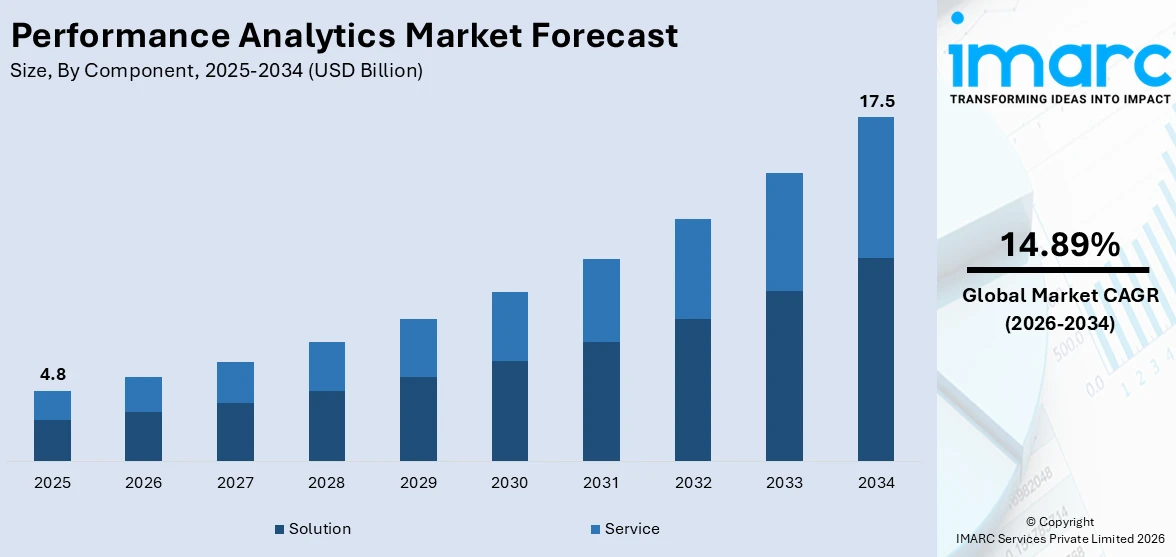
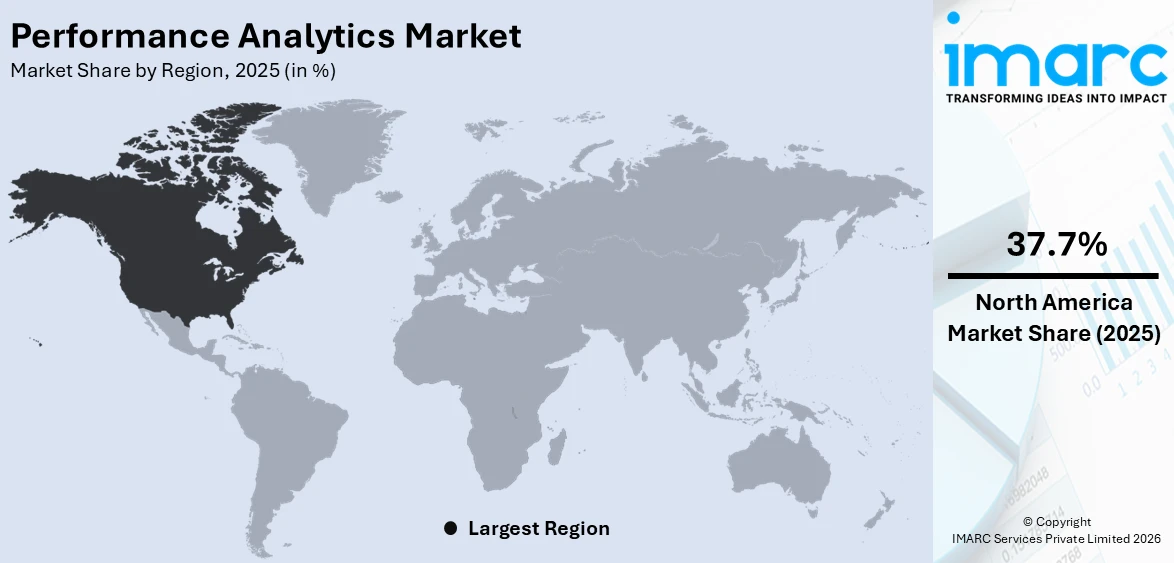
The global performance analytics market size was valued at USD 4.8 Billion in 2025. Looking forward, IMARC Group estimates the market to reach USD 17.5 Billion by 2034, exhibiting a CAGR of 14.89% from 2026-2034. North America currently dominates the market, holding a market share of 37.7% in 2025. The market is fueled by the increasing need for data-driven decision-making, as companies look to enhance efficiency and productivity. Greater adoption of cloud-based solutions, developments in artificial intelligence (AI) and machine learning (ML), and the requirement for real-time insights drive the market. Moreover, the emphasis by organizations on creating a better customer experience, cutting costs, and streamlining operations further drives the market. The transition towards digital transformation and the embedding of advanced analytics into business processes are the prime movers in increasing this performance analytics market share.
|
Report Attribute
|
Key Statistics
|
|---|---|
|
Base Year
|
2025
|
|
Forecast Years
|
2026-2034
|
|
Historical Years
|
2020-2025
|
| Market Size in 2025 | USD 4.8 Billion |
| Market Forecast in 2034 | USD 17.5 Billion |
| Market Growth Rate (2026-2034) | 14.89% |
A key driver in the performance analytics space is the growing need for data-driven decision-making. Companies in all industries are increasingly realizing the value of leveraging data to optimize operations, improve performance, and inform strategic planning. Businesses may make quicker and more informed decisions by using performance analytics systems to gather, evaluate, and display key performance indicators (KPIs) in real-time. The desire to be flexible and competitive in a market that is ever changing is what is driving this change. This trend was supported by a 2023 report that discovered 91% of federal IT employees recorded improvements in digital modernization, an indication of the U.S. government's increased investment in leveraging data-driven models across its operations and agencies.
To get more information on this market Request Sample
The U.S. is a major player in the performance analytics industry holding a share of 88.70% because of its widespread adoption of cutting-edge technologies like machine learning, cloud computing, and artificial intelligence. A growing number of industries, including manufacturing, healthcare, and finance, are using performance analytics technologies to improve decision-making, boost operational efficacy, and boost overall business effectiveness. The high concentration of technology infrastructure and numerous analytics solution vendors in the U.S. are also among the drivers for the performance analytics market growth. Additionally, the constant drive for digital transformation within enterprises further fuels the growth of demand for performance analytics solutions in the country.
Performance Analytics Market Trends:
Integration of AI and Machine Learning
Artificial intelligence (AI) and machine learning (ML) are transforming performance analytics by automating and enhancing data analysis and predictive capabilities. These technologies enable businesses to efficiently identify trends, detect anomalies, and forecast outcomes, thereby supporting more informed and strategic decision-making. This is especially helpful in sectors like manufacturing, healthcare, and finance where competitiveness and market adaptation depend heavily on information-driven insights. More than 80% of global corporations have already incorporated AI to streamline their business functions, highlighting the increasing dependence on these technologies. As AI and ML continue to advance, their power to change analytics processes will only grow stronger, providing more accurate insights and supporting quicker, data-driven decisions in a fast-paced business world.
Shift Toward Cloud-Based Solutions
Cloud-based performance analytics platforms are becoming popular because of their flexibility, scalability, and affordability. With the help of the cloud, organizations have access to strong, real-time analytics capabilities without investing in heavy on-site infrastructure, thus cutting down operational expenses. This is specifically beneficial for small and medium-sized businesses (SMEs), which might not have the resources for wide-scale data infrastructure. Cloud platforms provide frictionless collaboration between teams, making it possible for businesses to scale analytics on demand. Such flexibility gives organizations the means to act promptly on changing markets, enhance decision-making, and generally become more agile. With further advancements in cloud solutions, they provide enterprises with the power to access information from anywhere, enhancing efficiency, data availability, and faster, more informed decisions in an ever-faster-paced, more competitive business world.
Emphasis on Real-Time Analytics
As companies attempt to remain competitive, real-time performance analytics is becoming a necessity. With real-time analytics, organizations are able to monitor in real-time key performance indicators (KPIs), reacting immediately to issues arising or changes in the market. This capability allows companies to make rapid adjustments, enhancing operational effectiveness and customer satisfaction. For example, firms register an average return on investment (ROI) of 314% on real-time analytics in a span of three years with a payback time of merely 11 months. Real-time analytics is particularly valuable in industries like e-commerce, telecom, and logistics where there is a lot of fast pace and rapidness required for the success of businesses. The capacity to take action based on insights in real-time enables companies to refine operations, realign strategies instantly, and get an edge in competition, hence becoming a game-changer in the current dynamic business landscape.
Performance Analytics Industry Segmentation:
IMARC Group provides an analysis of the key trends in each segment of the global performance analytics market, along with forecast at the global, regional, and country levels from 2026-2034. The market has been categorized based on component, deployment mode, organization size, application, and industry vertical.

Analysis by Component:
- Solution
- Service
Solutions account for the majority of shares of 67.8% as they can offer end-to-end, actionable insights that inform strategic decision-making. These solutions usually take the shape of software platforms for gathering, processing, and analyzing data, which let businesses monitor performance indicators, identify patterns, and make decisions based on facts. Integrated analytics solutions preferred by businesses across industries include real-time reporting, dashboards, and predictability, which improve operation efficiency and responsiveness. The increased emphasis on automation, digitalization, and data centralization has also raised further dependence on performance analytics solutions. Their adaptability to be tailored for different business requirements and compatibility with current systems make them extremely valuable. As organizations focus on quantifiable results, demand for strong analytics solutions increases steadily in global markets.
Analysis by Deployment Mode:
- On-premises
- Cloud-based
Cloud performance analytics solutions occupy most of the market share of 55.4% owing to their flexibility, scalability, and affordability. Organizations now find cloud platforms preferable because they facilitate easy access to data and analytics tools from any location, enhancing real-time decision-making and remote collaboration. Such solutions minimize heavy initial investments in infrastructure and maintenance, hence, are particularly desirable for small and medium enterprises. Cloud services also provide smooth integration with other business applications, regular updates, and better data security features. Moreover, the fast-paced adoption of digital transformation and remote work patterns has fueled the move towards cloud-based analytics. As companies look for agility and quicker deployment, cloud platforms continue to lead the performance analytics market outlook.
Analysis by Organization Size:
- Large Enterprises
- Small and Medium Enterprises
Small and medium-sized businesses (SMEs) account for the highest market share in the performance analytics market because they have an expanding requirement for effective, low-cost tools to support decision-making and competitiveness. SMEs use performance analytics to streamline processes, lower costs, and find opportunities for growth because they have fewer resources and tighter budgets. Cloud and subscription models have provided analytics solutions with wider access, enabling SMEs to deploy sophisticated technologies without large infrastructure outlays. Moreover, as digitalization becomes imperative across sectors, SMEs are embracing analytics to derive real-time insights, enhance customer interactions, and remain nimble in fast-changing markets. Their increasing awareness of data-driven approaches and the presence of easy-to-use, scalable solutions fuel their strong presence in the performance analytics market.
Analysis by Application:
Access the comprehensive market breakdown Request Sample
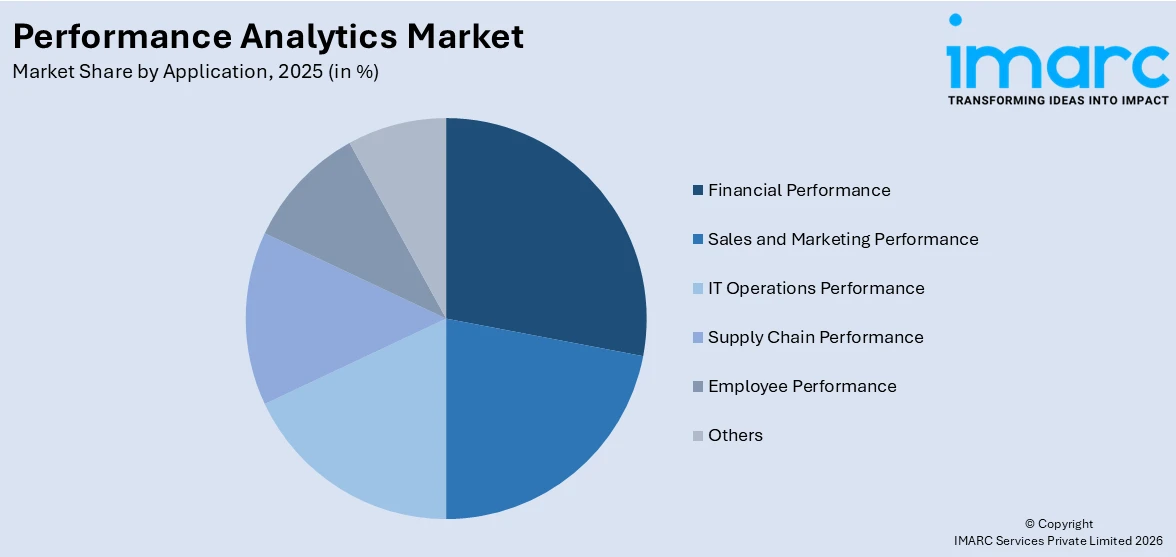
- Financial Performance
- Sales and Marketing Performance
- IT Operations Performance
- Supply Chain Performance
- Employee Performance
- Others
Based on the performance analytics market forecast, the financial performance is the top performing segment in the performance analytics space holding a share of 27.6% because of its key function of enabling organizations to manage resources, evaluate profitability, and make strategic choices. Businesses utilize financial analytics extensively to monitor key performance indicators such as cash flow, profit margins, expenses, and revenue in real time. Organizations may better anticipate future performance, control expenses, and identify patterns thanks to these indicators. The need for financial compliance, risk management, and transparency also increases the demand for more sophisticated analytics tools in this sector. Furthermore, businesses from all industries are incorporating financial performance analytics into their overall strategic planning to make them sustainable in the long run and driving performance analytics market value. The significance of financial well-being within business operations places this segment at the forefront of analytics investment.
Analysis by Industrial Vertical:
- BFSI
- IT and Telecom
- Retail
- Government and Defense
- Healthcare
- Manufacturing
- Others
The BFSI industry leads market demand with a share of 24.3% in the performance analytics market because of its high dependence on data-driven decision-making and the necessity for real-time risk and financial management. Large volumes of sensitive and complicated data are handled by these organizations, making sophisticated analytics necessary to monitor performance, stay in compliance with regulations, spot fraud, and improve customer service. BFSI businesses can increase their competitiveness and profitability by using performance analytics to gain actionable insights on financial trends, customer behavior, and operational effectiveness. The impetus for digital transformation, increasing cybersecurity threats, and demand for customized financial services have also increased the uptake of stronger analytics tools. Consequently, BFSI continues to be a leading driver of demand for the performance analytics market.
Regional Analysis:
To get more information on the regional analysis of this market Request Sample
- North America
- United States
- Canada
- Asia Pacific
- China
- Japan
- India
- South Korea
- Australia
- Indonesia
- Others
- Europe
- Germany
- France
- United Kingdom
- Italy
- Spain
- Russia
- Others
- Latin America
- Brazil
- Mexico
- Others
- Middle East and Africa
Based on the performance analytics market research report, the North America is the most prominent region accounting for the share of 37.7% in the market because of its well-developed technological infrastructure, high digital adoption rate, and dominant presence of major market players. Organizations from diverse industries within the region make active investments in analytics solutions to achieve efficiency, gain competitive edge, and facilitate data-driven decision-making. The early adoption of cloud computing, artificial intelligence, and machine learning in the region has also pushed the need for performance analytics further. Regulatory demands and the imperative to improve customer experience also compel businesses to adopt analytics for greater insights and regulatory compliance. The presence of a mature IT environment, innovation culture, and strategic emphasis on digital transformation places North America in a leadership position in the global market for performance analytics.
Key Regional Takeaways:
United States Performance Analytics Market Analysis
The United States performance analytics market is primarily driven by the increased adoption of real-time decision-making tools aimed at enhancing operational efficiency across business functions. In line with this, the growing complexity of enterprise data systems requiring seamless integration and analysis, supporting the shift toward unified analytics platforms, is impelling the market. Furthermore, the rise of outcome-based models in sectors like healthcare and education, emphasizing measurable impact, is strengthening market demand. The expansion of predictive maintenance practices in manufacturing, leveraging AI-powered analytics, enabling timely interventions and cost savings, is stimulating market appeal. Industry analysis highlighted that AI adoption in the U.S. is strongest among large firms, with over 50% of companies with 5,000+ employees and 60% of those with 10,000+ using AI. Sectoral adoption is growing, with manufacturing, information services, and healthcare at 12%. Similarly, the rapid integration of embedded analytics within cloud-based ERP and CRM solutions, streamlining data visibility, is fostering rapid deployment across industries. Additionally, stricter financial reporting standards, encouraging greater transparency, are accelerating the adoption of structured analytics frameworks. Moreover, the increased use of workforce analytics in HR for performance optimization is reshaping enterprise planning and impacting market trends.
Europe Performance Analytics Market Analysis
The market in Europe is experiencing growth due to increasing regulatory emphasis on data transparency and compliance across key sectors. In accordance with this, the ongoing rollout of Industry 4.0 technologies, elevating the need for integrated analytics in smart manufacturing environments, is widening market applicability. Similarly, EU-backed digital transformation initiatives encouraging real-time operational monitoring are supporting broader enterprise adoption. The rising demand for energy efficiency and emissions-tracking tools aligned with sustainability targets is fueling growth in the market. Furthermore, the expansion of cross-border e-commerce operations requiring unified performance visibility is stimulating market demand. According to a study by CBCommerce, the European cross-border e-commerce market reached EUR 326 billion in 2023/2024, with online marketplaces accounting for EUR 225 Billion, or 69% of the total market value. The financial sector’s heightened focus on regulatory compliance and risk management driving interest in predictive analytics solutions, is reinforcing product adoption. Moreover, a notable shift toward cloud-based enterprise systems among mid-sized firms, enabling scalable data integration, is supporting market penetration. Besides this, numerous public-private collaborations in performance optimization research are accelerating product innovation and regional capability building.
Asia Pacific Performance Analytics Market Analysis
The Asia Pacific market is progressing, attributed to rapid digital transformation across developing economies, enabling faster adoption of real-time business intelligence tools. In addition to this, various government-backed smart infrastructure projects in nations like China, India, and Singapore's increasing reliance on integrated analytics systems are supporting market growth. Similarly, the expanding fintech and e-commerce sectors, leveraging behavioral analytics for customer engagement and retention, are fueling digital analytics investments. According to NPCI, India's FinTech market is among the fastest growing globally, valued at approximately USD 110 Billion in 2024 and projected to reach USD 420 Billion by 2029 at a CAGR of 31%. The country's FinTech adoption rate stands at 87%, surpassing the global average of 67%. Moreover, the rapid integration of performance analytics in public education and health programs, enabling institutional monitoring and outcome evaluation, is promoting broader product adoption. Apart from this, competitive pressure in the telecom and logistics industries, accelerating the implementation of analytics for cost control and resource efficiency, is contributing to overall market momentum across the region.
Latin America Performance Analytics Market Analysis
In Latin America, the performance analytics market is progressing propelled by increasing digitization of government services aimed at improving transparency and operational efficiency. Similarly, the growing adoption of cloud-based enterprise platforms among small and mid-sized businesses, enhancing access to real-time insights, is fueling market development. Furthermore, the rapid growth of the retail and e-commerce sectors requiring data-driven customer engagement strategies is driving the uptake of advanced analytics tools. According to CSIS, e-commerce in Mexico grew from 1% to 15% of total retail sales over the past decade. Online sales reached USD 74 Billion in 2023, and are expected to rise to USD 176.8 Billion by 2026. Moreover, rising international investment in digital infrastructure across countries like Brazil, Mexico, and Colombia, strengthening regional capabilities in integrated data management, is expanding the market scope.
Middle East and Africa Performance Analytics Market Analysis
The market in the Middle East and Africa is experiencing growth due to ongoing national digital transformation agendas promoting data-centric public sector reforms. In line with this, the continual advancement of smart city initiatives in countries like Saudi Arabia and the UAE, integrating real-time analytics for infrastructure and service optimization, is propelling market expansion. As such, in 2025, Abu Dhabi unveiled its USD 3.3 Billion smart city plan, aiming to become the world’s first AI-native city by 2027. Ranked 10th globally, the initiative integrates AI, IoT, and public engagement to drive sustainability, efficiency, and economic diversification. Furthermore, rising demand in the banking and financial services industry for risk modeling and customer behavior insights is strengthening analytics adoption. Besides this, increased investment in healthcare infrastructure, enabling analytics-based resource planning and performance benchmarking, is positively impacting market development.
Competitive Landscape:
The competitive environment for the performance analytics market is shaped by a diversified set of companies providing innovative offerings to address increased demand for decision-making based on data. Competitors are mainstream technology providers, analytics software suppliers, and disruptive startups. In order to give more accurate real-time insights and predictive analytics, technology providers, analytics software vendors, and start-up businesses are vying for access to cutting-edge solutions driven by AI and ML. Additionally, cloud-based solutions—which offer scalability and flexibility—are becoming more and more popular in the industry. Rivals are constantly enhancing their product lines through R&D, strategic alliances, and mergers and acquisitions to stay competitive. Furthermore, a crucial factor in setting market participants apart is the emphasis on user-friendly interfaces, customization, and connection with current infrastructure.
The report provides a comprehensive analysis of the competitive landscape in the performance analytics market with detailed profiles of all major companies, including:
- International Business Machines Corporation
- Microsoft Corporation
- Optymyze
- Oracle Corporation
- Prophix Software Inc.
- SAP SE
- SAS Institute Inc.
- Servicenow Inc.
- Siemens AG
- Workday Inc.
- Xactly Corporation
Latest News and Developments:
- April 2025: Enfusion completed its merger with Clearwater Analytics, becoming an indirect subsidiary and ceasing NYSE trading. The deal includes performance-driven integration, with Enfusion’s software and analytics capabilities enhancing Clearwater’s offerings in financial data automation, reporting accuracy, and operational efficiency across investment management and enterprise performance workflows.
- April 2025: Zema Global acquired cQuant.io to strengthen its performance analytics in energy and commodities. The merger unites Zema’s data infrastructure with cQuant’s advanced analytics for enhanced forecasting, valuation, and portfolio optimization, enabling real-time, end-to-end decision-making across complex markets through a unified, cloud-native analytics platform.
- December 2024: AnyMind Group launched an enhanced performance analytics module on its AnyTag platform in Japan. The update enables marketers to track Return on Ad Spend and Lifetime Value, offering advanced visualizations of sales, retention, and influencer impact to support data-driven, performance-based influencer marketing strategies with measurable ROI insights.
- October 2024: Clarify Health launched the AI-powered Performance IQ Suite to deliver actionable performance analytics for health plans and providers. Built on the Clarify Atlas Platform, it enables cost containment, referral optimization, and quality improvement through granular, real-dollar insights and advanced provider performance evaluation across 300 million lives.
- August 2024: Accenture completed its acquisition of Partners in Performance, a global strategy firm specializing in asset-intensive industries. The deal enhances Accenture’s data and AI-driven performance analytics capabilities in capital projects, supply chains, and decarbonization, supporting sustainable growth and productivity for clients in mining, energy, utilities, and chemicals.
Performance Analytics Market Report Scope:
| Report Features | Details |
|---|---|
| Base Year of the Analysis | 2025 |
| Historical Period | 2020-2025 |
| Forecast Period | 2026-2034 |
| Units | Billion USD |
| Scope of the Report |
Exploration of Historical Trends and Market Outlook, Industry Catalysts and Challenges, Segment-Wise Historical and Future Market Assessment:
|
| Components Covered | Solution, Service |
| Deployment Modes Covered | On-premises, Cloud-based |
| Organization Sizes Covered | Large Enterprises, Small and Medium Enterprises |
| Applications Covered | Financial Performance, Sales and Marketing Performance, IT Operations Performance, Supply Chain Performance, Employee Performance, Others |
| Industry Verticals Covered | BFSI, IT and Telecom, Retail, Government and Defense, Healthcare, Manufacturing, Others |
| Regions Covered | Asia Pacific, Europe, North America, Latin America, Middle East and Africa |
| Countries Covered | United States, Canada, Germany, France, United Kingdom, Italy, Spain, Russia, China, Japan, India, South Korea, Australia, Indonesia, Brazil, Mexico |
| Companies Covered | International Business Machines Corporation, Microsoft Corporation, Optymyze, Oracle Corporation, Prophix Software Inc., SAP SE, SAS Institute Inc., Servicenow Inc., Siemens AG, Workday Inc. and Xactly Corporation |
| Customization Scope | 10% Free Customization |
| Post-Sale Analyst Support | 10-12 Weeks |
| Delivery Format | PDF and Excel through Email (We can also provide the editable version of the report in PPT/Word format on special request) |
Key Benefits for Stakeholders:
- IMARC’s report offers a comprehensive quantitative analysis of various market segments, historical and current market trends, market forecasts, and dynamics of the Performance Analytics market from 2020-2034.
- The research study provides the latest information on the market drivers, challenges, and opportunities in the global performance analytics market.
- The study maps the leading, as well as the fastest-growing, regional markets. It further enables stakeholders to identify the key country-level markets within each region.
- Porter's Five Forces analysis assists stakeholders in assessing the impact of new entrants, competitive rivalry, supplier power, buyer power, and the threat of substitution. It helps stakeholders to analyze the level of competition within the Performance Analytics industry and its attractiveness.
- Competitive landscape allows stakeholders to understand their competitive environment and provides an insight into the current positions of key players in the market.
Frequently Asked Questions About the Performance Analytics Market Report
The performance analytics market was valued at USD 4.8 Billion in 2025.
The performance analytics market is projected to exhibit a CAGR of 14.89% during 2026-2034, reaching a value of USD 17.5 Billion by 2034.
Key factors driving the performance analytics market include the growing demand for data-driven decision-making, the rapid adoption of cloud-based solutions, and the integration of AI and machine learning. Additionally, the need to improve operational efficiency, enhance customer experience, and support digital transformation initiatives fuels market growth across industries.
North America currently dominates the performance analytics market, accounting for a share of 37.7% due to its strong technological foundation, early adoption of advanced analytics solutions, and high investment in digital transformation. The region benefits from a mature IT ecosystem, widespread use of cloud platforms, and the presence of major analytics vendors.
Some of the major players in the performance analytics market include International Business Machines Corporation, Microsoft Corporation, Optymyze, Oracle Corporation, Prophix Software Inc., SAP SE, SAS Institute Inc., Servicenow Inc., Siemens AG, Workday Inc. and Xactly Corporation, etc.
Need more help?
- Speak to our experienced analysts for insights on the current market scenarios.
- Include additional segments and countries to customize the report as per your requirement.
- Gain an unparalleled competitive advantage in your domain by understanding how to utilize the report and positively impacting your operations and revenue.
- For further assistance, please connect with our analysts.
 Request Customization
 Speak to an Analyst
 Request Brochure
 Inquire Before Buying
Benefits of Customization
- Personalize this research
- Triangulate with your data
- Get data as per your format and definition
- Gain a deeper dive into a specific application, geography, customer, or competitor
- Any level of personalization
Get in Touch With Us
UNITED STATES
Phone: +1-201-971-6302
INDIA
Phone: +91-120-433-0800
UNITED KINGDOM
Phone: +44-753-714-6104
Email: [email protected]
Client Testimonials


.webp)


