
Polysilicon Prices, Trend, Chart, Demand, Market Analysis, News, Historical and Forecast Data Report 2026 Edition
Polysilicon Price Trend, Index and Forecast
Track real-time and historical polysilicon prices across global regions. Updated monthly with market insights, drivers, and forecasts.
Polysilicon Prices May 2026
| Region | Price (USD/Kg) | Latest Movement |
|---|---|---|
| Northeast Asia | 5.06 | -5.4% ↓ Down |
| Europe | 15.11 | -16.4% ↓ Down |
| North America | 25.27 | 12.5% ↑ Up |
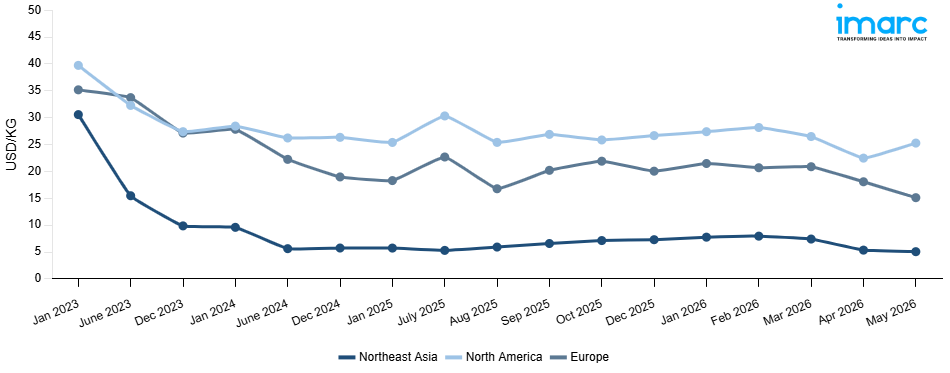
Polysilicon Price Index (USD/KG):
The chart below highlights monthly polysilicon prices across different regions.
Get Access to Monthly/Quarterly/Yearly Prices, Request Sample
Market Overview Q1 Ending March 2026
Northeast Asia: The polysilicon prices in Northeast Asia reached 7.41 USD/KG in March 2026. The upward pricing movement registered between December and March 2026 was 1.6%. The increase in the price in the margin reflected a stable market environment, with consistent demand for solar photovoltaic wafer manufacturing to help sustain baseline levels of procurement activity in the quarter. Stable metallurgical grade silicon and trichlorosilane feedstock prices helped provide a further pricing impetus at the margin for regional producers. Stable production levels at major Siemens Process and fluidized bed reactor plants helped ensure that supply demand fundamentals remained well balanced, preventing excess levels of availability in the market. In addition, consistent consumption in the semiconductor grade polysilicon segment helped ensure that offtake fundamentals remained stable, while the balance between availability and demand helped prevent wild price fluctuations.
Europe: The polysilicon prices in Europe reached 20.87 USD/KG in March 2026. The upward pricing movement registered between December and March 2026 was 4.1%. The moderate price uptrend was also underpinned by rising energy costs in the region, which increased production costs for local manufacturers using high energy consuming Siemens process technology. Unrelenting demand from the semiconductor fabrication and solar cell manufacturing industries maintained robust procurement activity throughout the period. Constrained supply dynamics, driven by capacity constraints in key production centers, also contributed to supply side pressure. In addition, firm upstream prices for feedstock materials further underlined upward pressure on prices throughout the chain. The rising importance of local supply chain security for key semiconductor raw materials also accelerated procurement activity.
North America: The polysilicon prices in North America reached 26.49 USD/KG in March 2026. The downward pricing movement registered between December and March 2026 was 0.6%. The small degree of price decline noted may be attributed to a generally stable market environment, marked by moderate demand from semiconductor fabrication and specialty solar cell manufacturing industries, thus keeping procurement levels steady over this period. A moderation in upstream energy costs provided a marginal respite production cost pressures for local producers of these Siemens technologies. Robust local production capacities ensured a healthy supply, while healthy inflows of imports from global suppliers kept prices in check.
Market Overview Q4 Ending December 2025
Northeast Asia: The polysilicon prices in Northeast Asia reached 7.29 USD/KG in December 2025. The upward pricing movement registered between September and December 2025 was 10.8%. Strong demand from the solar photovoltaic wafer fabrication business, driven by increased purchase efforts to meet year-end project deadlines and growing global ambitions for renewable energy installations, was the primary driver of the notable price increase. Regional availability was further constrained by production discipline among top Chinese polysilicon manufacturers, who reduced output in response to rising energy costs in key industrial regions. Positive pricing trends during the quarter were further supported by strategic inventory accumulation by downstream wafer producers anticipating continued supply constraints, which increased procurement rivalry and raised production costs due to strong upstream metallurgical-grade silicon and trichlorosilane feedstock prices.
Europe: The polysilicon prices in Europe reached 20.04 USD/KG in December 2025. The downward pricing movement registered between September and December 2025 was 0.8%. The modest price drop was a sign of a largely stable market, with consistent demand throughout the quarter from the semiconductor and solar cell manufacturing sectors providing dependable procurement support. Significant price reductions were hampered by the region's rising energy rates, which kept production costs high for regional polysilicon manufacturers using energy-intensive process equipment. However, the increased availability of Asian imports at competitive prices exerted slight downward pressure on market prices. The electronics-grade polysilicon sector's steady demand and key consumers' balanced inventory levels supported comparatively stable offtake fundamentals, resulting in nearly constant price conditions throughout the quarter.
North America: The polysilicon prices in North America reached 26.66 USD/KG in December 2025. The downward pricing movement registered between September and December 2025 was 0.8%. The price drop suggested a mostly stable market, with baseline procurement levels maintained by consistent demand from the semiconductor fabrication and specialty solar cell manufacturing industries. Comfortable supply availability was maintained by established area manufacturers' adequate local production capacity, and substantial price erosion was avoided by high upstream energy and raw material costs. While cautious inventory management by downstream consumers amid changing trade policy dynamics limited aggressive purchasing activity, moderate import competition from Asian suppliers exerted marginal downward pricing pressure, resulting in relatively stable but slightly softened pricing conditions throughout the quarter.
Market Overview Q3 Ending September 2025
Northeast Asia: In Northeast Asia, polysilicon prices rose sharply as robust solar photovoltaic demand drove procurement from wafer and cell manufacturers. The polysilicon price index reflected stronger downstream activity, supported by government-backed renewable energy projects. While feedstock availability was steady, higher utilization rates among producers pushed values upward. Regional export flows also tightened, adding momentum to price increases across the quarter.
Europe: In Europe, polysilicon prices surged as local demand from solar panel producers combined with limited import availability to create a supply-demand imbalance. The polysilicon price index strengthened significantly, driven by policy support for clean energy expansion and a strong pipeline of solar installations. Higher energy costs and constrained supply chains added to upward pricing momentum, with buyers securing volumes at premium levels to avoid disruptions.
North America: In North America, polysilicon prices climbed moderately as downstream demand from solar energy developers improved. The polysilicon price index showed firmer procurement levels, supported by growing investment in domestic solar manufacturing capacity. While imports helped balance availability, strong renewable energy commitments and stable feedstock costs allowed regional producers to secure higher prices, albeit at a slower pace compared to Europe and Asia.
Polysilicon Price Trend, Market Analysis, and News
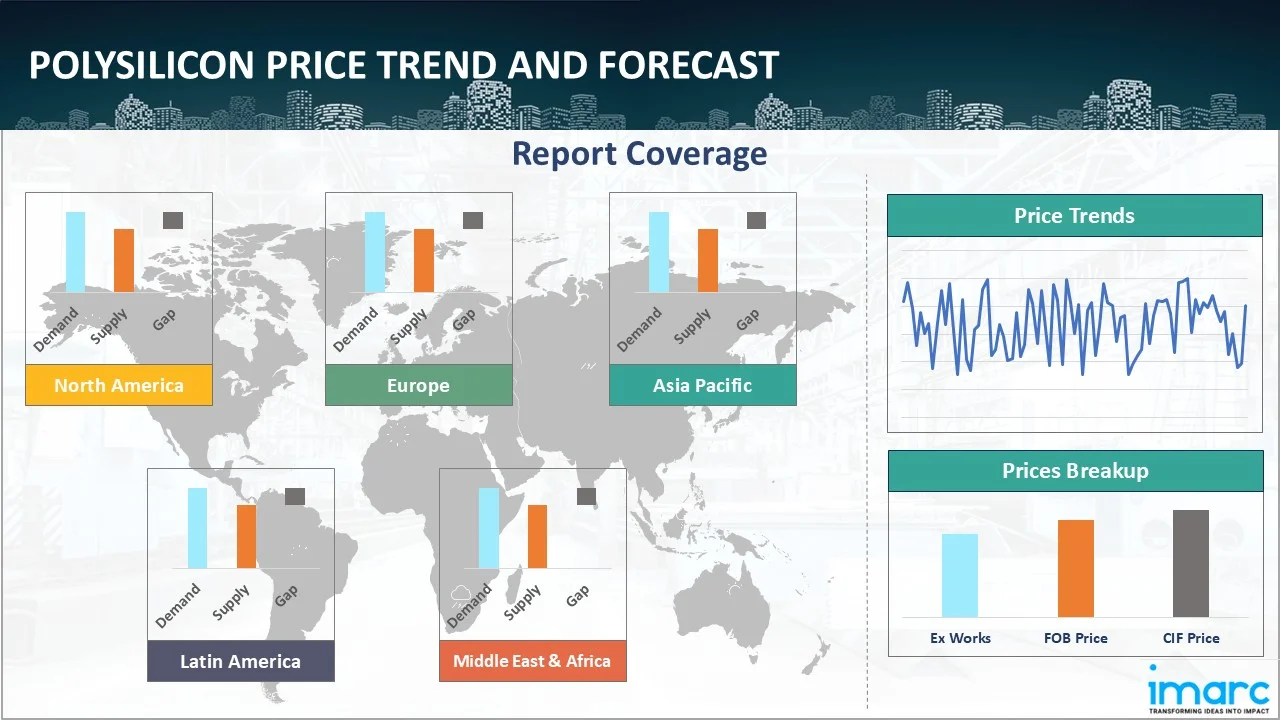
IMARC's latest publication, “Polysilicon Prices, Trend, Chart, Demand, Market Analysis, News, Historical and Forecast Data Report 2026 Edition,” presents a detailed examination of the polysilicon market, providing insights into both global and regional trends that are shaping prices. This report delves into the spot price of polysilicon at major ports and analyzes the composition of prices, including FOB and CIF terms. It also presents detailed polysilicon prices trend analysis by region, covering North America, Europe, Asia Pacific, Latin America, and Middle East and Africa. The factors affecting polysilicon pricing, such as the dynamics of supply and demand, geopolitical influences, and sector-specific developments, are thoroughly explored. This comprehensive report helps stakeholders stay informed with the latest market news, regulatory updates, and technological progress, facilitating informed strategic decision-making and forecasting.
Polysilicon Industry Analysis
The global polysilicon industry size reached USD 13.0 Billion in 2025. By 2034, IMARC Group expects the market to reach USD 26.7 Billion, at a projected CAGR of 8.02% during 2026-2034. Growth is fuelled by increasing solar photovoltaic installations worldwide, rising adoption of clean energy technologies, and growing investment in semiconductor applications requiring high purity silicon.
Latest developments in the Polysilicon Industry:
- July 2025: OCI Holdings and Japan’s Tokuyama Corp. announced the launch of OTSM, a joint venture to build a semiconductor-grade polysilicon plant in Sarawak, Malaysia, with a $435 million investment. Groundbreaking took place on June 16, and the plant aims to start 8,000 MT annual production by 2029 using eco-friendly hydropower.
- May 2025: Premier Energies and Taiwan’s Sino-American Silicon Products (SAS) announced a 74:26 joint venture to set up a 2 GW solar wafer plant in India. The facility will slice polysilicon ingots into wafers for solar cells and modules. This move supports India’s Make-in-India initiative and boosts local solar manufacturing.
- March 2025: Shirdi Sai Electricals Ltd (SSEL) announced that the first phase of its ₹69,000 crore 30 GW ingot-to-module solar plant will begin 1 GW commercial production by December 2025 in Andhra Pradesh. The project includes 90,000 MT polysilicon, glass, and desalination capacity, with full-scale rollout by mid-2026. SSEL aims to reduce power costs to compete globally and boost India’s solar manufacturing ecosystem.
- March 2025: German clean-tech firm 1KOMMA5° launched a new TOPCon solar module with 22.8% efficiency, using locally sourced polysilicon from Wacker Chemie. Available in 445W and 450W variants, it comes with an extended 30-year product and performance guarantee.
- March 2025: Suniva, Heliene, and Corning launched the first fully Made-in-America solar module supply chain, using domestically produced polysilicon, wafers, and solar cells. Corning supplies wafers and sources hyper-pure polysilicon from Hemlock Semiconductor in Michigan, while Suniva manufactures cells in Georgia. The module offers up to 66% US content, maximizing ITC incentives and boosting American solar manufacturing.
- October 2024: Hemlock Semiconductor, a joint venture between Corning Inc. and Shin-Etsu Handotai, received a $325 million grant from the U.S. Commerce Department to expand its production capacity of semiconductor-grade polysilicon in Hemlock, Michigan.
- September 2024: REC Silicon, a Norwegian producer of silane gas and silicon, announced the completion of construction at its restarted Moses Lake facility in Washington State, USA. The company planned to ship its first commercial polysilicon from the site in mid-October 2024.
- August 2024: Reliance Industries began solar module production at its Gujarat giga-factory, with a 10 GW capacity in the first phase, aiming for completion by the end of 2024. The factory produced integrated solar products, including polysilicon, cells, and bifacial panels. Additionally, Reliance developed battery storage and electrolyzer manufacturing facilities, alongside renewable energy projects.
- April 2024: Highland Materials announced the development of a new commercial polysilicon plant in the United States, which is anticipated to have 16,000 metric tons of the initial annual capacity. The company asserts that its manufacturing methods result in 90% reduction in carbon emissions.
- March 2024: Kolla outlined plans for a 10GW solar project, which would require 8,000 acres, including facilities for manufacturing modules, cells, wafers, polysilicon, and ingots. The facility was set to produce 1,200 tons of glass panels per day and 30,000 tons of polysilicon annually. The first phase was expected to be completed by the end of 2025, with the second phase slated for completion by the end of 2026.
- June 2023: Tokuyama Corporation signed an MoU with OCI, a South Korea-based polysilicon producer, to build a polysilicon factor in Malaysia with a capacity of 10,000 metric tons. The factory will manufacture polycrystalline silicon specifically for semiconductors.
Product Description
Polysilicon is a highly purified form of silicon produced through chemical vapor deposition of trichlorosilane or silane gas. It is characterized by its crystalline structure, high purity (often exceeding 99.9999%), and excellent semiconductor properties. Polysilicon is primarily used in the production of solar photovoltaic cells, where it serves as the base material for wafers and ingots. It is also critical in the electronics industry for manufacturing semiconductors and integrated circuits. The material exhibits thermal stability, electrical conductivity, and strong resistance to chemical degradation. As the demand for renewable energy grows, polysilicon’s role in solar power generation continues to expand, while its applications in high-tech electronics reinforce its strategic importance in global industries.
Report Coverage
| Key Attributes | Details |
|---|---|
| Product Name | Polysilicon |
| Report Features | Exploration of Historical Trends and Market Outlook, Industry Demand, Industry Supply, Gap Analysis, Challenges, Ammonia Price Analysis, and Segment-Wise Assessment. |
| Currency/Units | US$ (Data can also be provided in local currency) or Metric Tons |
| Region/Countries Covered | The current coverage includes analysis at the global and regional levels only. Based on your requirements, we can also customize the report and provide specific information for the following countries: Asia Pacific: China, India, Indonesia, Pakistan, Bangladesh, Japan, Philippines, Vietnam, Thailand, South Korea, Malaysia, Nepal, Taiwan, Sri Lanka, Hongkong, Singapore, Australia, and New Zealand Europe: Germany, France, United Kingdom, Italy, Spain, Russia, Turkey, Netherlands, Poland, Sweden, Belgium, Austria, Ireland, Switzerland, Norway, Denmark, Romania, Finland, Czech Republic, Portugal and Greece North America: United States and Canada Middle East & Africa: Saudi Arabia, UAE, Israel, Iran, South Africa, Nigeria, Oman, Kuwait, Qatar, Iraq, Egypt, Algeria, and Morocco Latin America: Brazil, Mexico, Argentina, Columbia, Chile, Ecuador, Peru The list of countries presented is not exhaustive. Information on additional countries can be provided if required by the client. |
| Information Covered for Key Suppliers |
|
| Customization Scope | The report can be customized as per the requirements of the customer |
| Report Price and Purchase Option |
Plan A: Monthly Updates - Annual Subscription
Plan B: Quarterly Updates - Annual Subscription
Plan C: Biannually Updates - Annual Subscription
|
| Post-Sale Analyst Support | 360-degree analyst support after report delivery |
| Delivery Format | PDF and Excel through email (We can also provide the editable version of the report in PPT/Word format on special request) |
Key Benefits for Stakeholders:
- IMARC’s report presents a detailed analysis of polysilicon pricing, covering global and regional trends, spot prices at key ports, and a breakdown of FOB and CIF prices.
- The study examines factors affecting polysilicon price trend, including input costs, supply-demand shifts, and geopolitical impacts, offering insights for informed decision-making.
- The competitive landscape review equips stakeholders with crucial insights into the latest market news, regulatory changes, and technological advancements, ensuring a well-rounded, strategic overview for forecasting and planning.
- IMARC offers various subscription options, including monthly, quarterly, and biannual updates, allowing clients to stay informed with the latest market trends, ongoing developments, and comprehensive market insights. The polysilicon price charts ensure our clients remain at the forefront of the industry.
Frequently Asked Questions About the Polysilicon Price Index Report
The polysilicon prices in May 2026 were 5.06 USD/Kg in Northeast Asia, 15.11 USD/Kg in Europe, and 25.27 USD/Kg in North America.
The polysilicon pricing data is updated on a monthly basis.
We provide the pricing data primarily in the form of an Excel sheet and a PDF.
Yes, our report includes a forecast for polysilicon prices.
The regions covered include North America, Europe, Asia Pacific, Middle East, and Latin America. Countries can be customized based on the request (additional charges may be applicable).
Yes, we provide both FOB and CIF prices in our report.
Need more help?
- Speak to our experienced analysts for insights on the current market scenarios.
- Include additional segments and countries to customize the report as per your requirement.
- Gain an unparalleled competitive advantage in your domain by understanding how to utilize the report and positively impacting your operations and revenue.
- For further assistance, please connect with our analysts.
 Request Customization
 Inquire Before Buying
 Speak to an Analyst
 Request Brochure
Benefits of Customization
- Personalize this research
- Triangulate with your data
- Get data as per your format and definition
- Gain a deeper dive into a specific application, geography, customer, or competitor
- Any level of personalization
Get in Touch With Us
UNITED STATES
Phone: +1-201-971-6302
INDIA
Phone: +91-120-433-0800
UNITED KINGDOM
Phone: +44-753-714-6104
Email: [email protected]
Client Testimonials


.webp)


Why Choose Us
IMARC offers trustworthy, data-centric insights into commodity pricing and evolving market trends, enabling businesses to make well-informed decisions in areas such as procurement, strategic planning, and investments. With in-depth knowledge spanning more than 1000 commodities and a vast global presence in over 150 countries, we provide tailored, actionable intelligence designed to meet the specific needs of diverse industries and markets.
1000
+Commodities
150
+Countries Covered
3000
+Clients
20
+Industry
Robust Methodologies & Extensive Resources
IMARC delivers precise commodity pricing insights using proven methodologies and a wealth of data to support strategic decision-making.
Subscription-Based Databases
Our extensive databases provide detailed commodity pricing, import-export trade statistics, and shipment-level tracking for comprehensive market analysis.
Primary Research-Driven Insights
Through direct supplier surveys and expert interviews, we gather real-time market data to enhance pricing accuracy and trend forecasting.
Extensive Secondary Research
We analyze industry reports, trade publications, and market studies to offer tailored intelligence and actionable commodity market insights.
Trusted by 3000+ industry leaders worldwide to drive data-backed decisions. From global manufacturers to government agencies, our clients rely on us for accurate pricing, deep market intelligence, and forward-looking insights.