
Power Rental Market Size, Share, Trends and Forecast by Fuel Type, Equipment Type, Power Rating, Application, End Use Industry, and Region, 2026-2034
Power Rental Market 2025, Size and Overview:
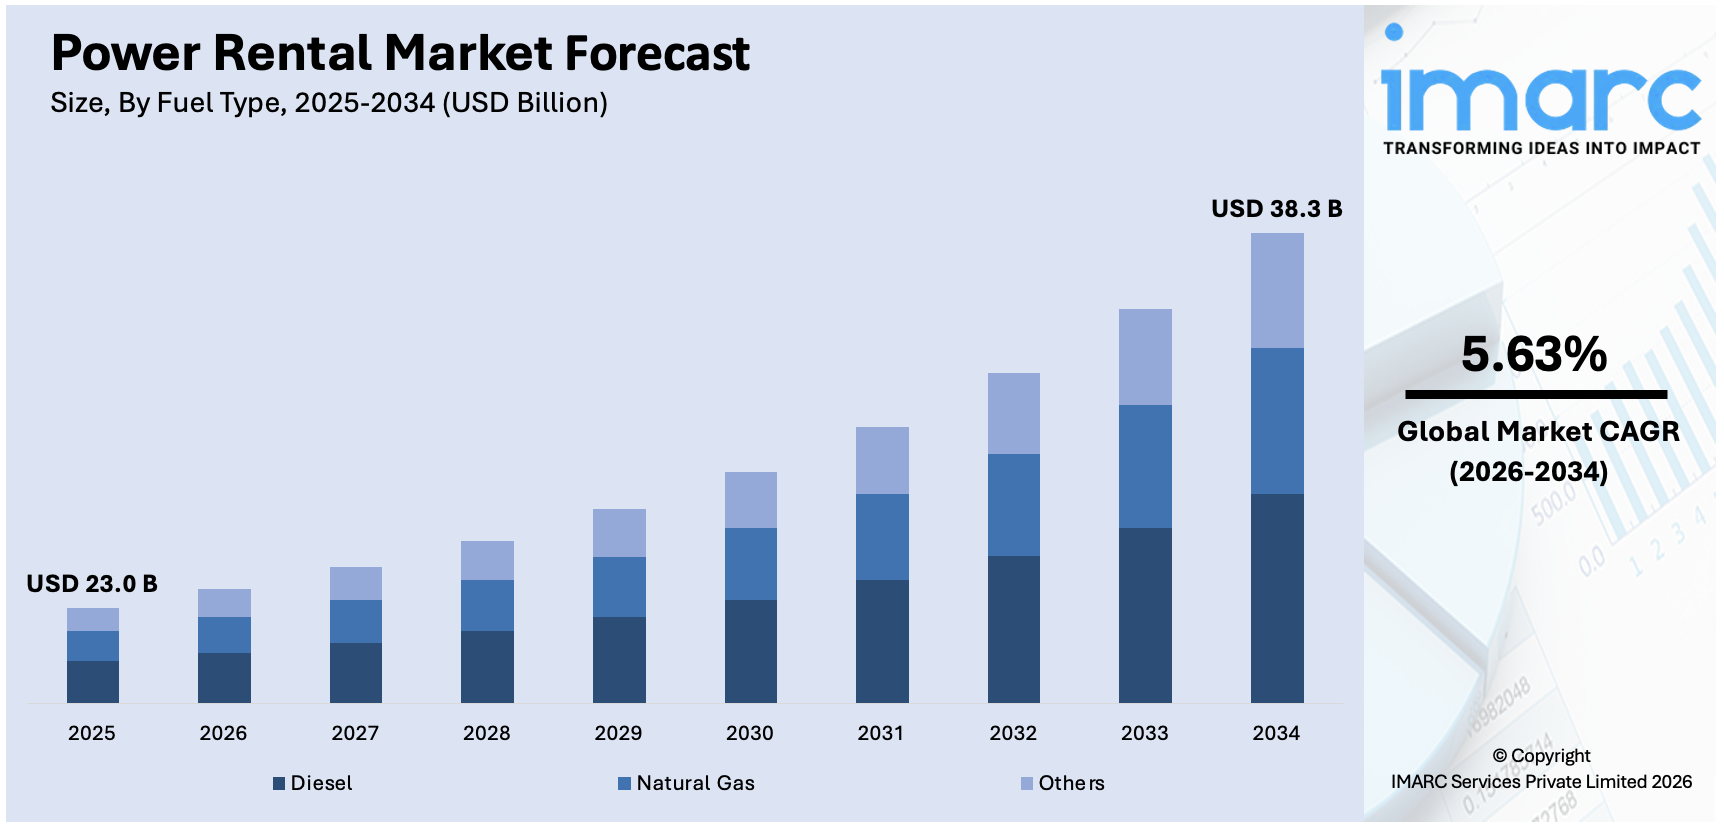
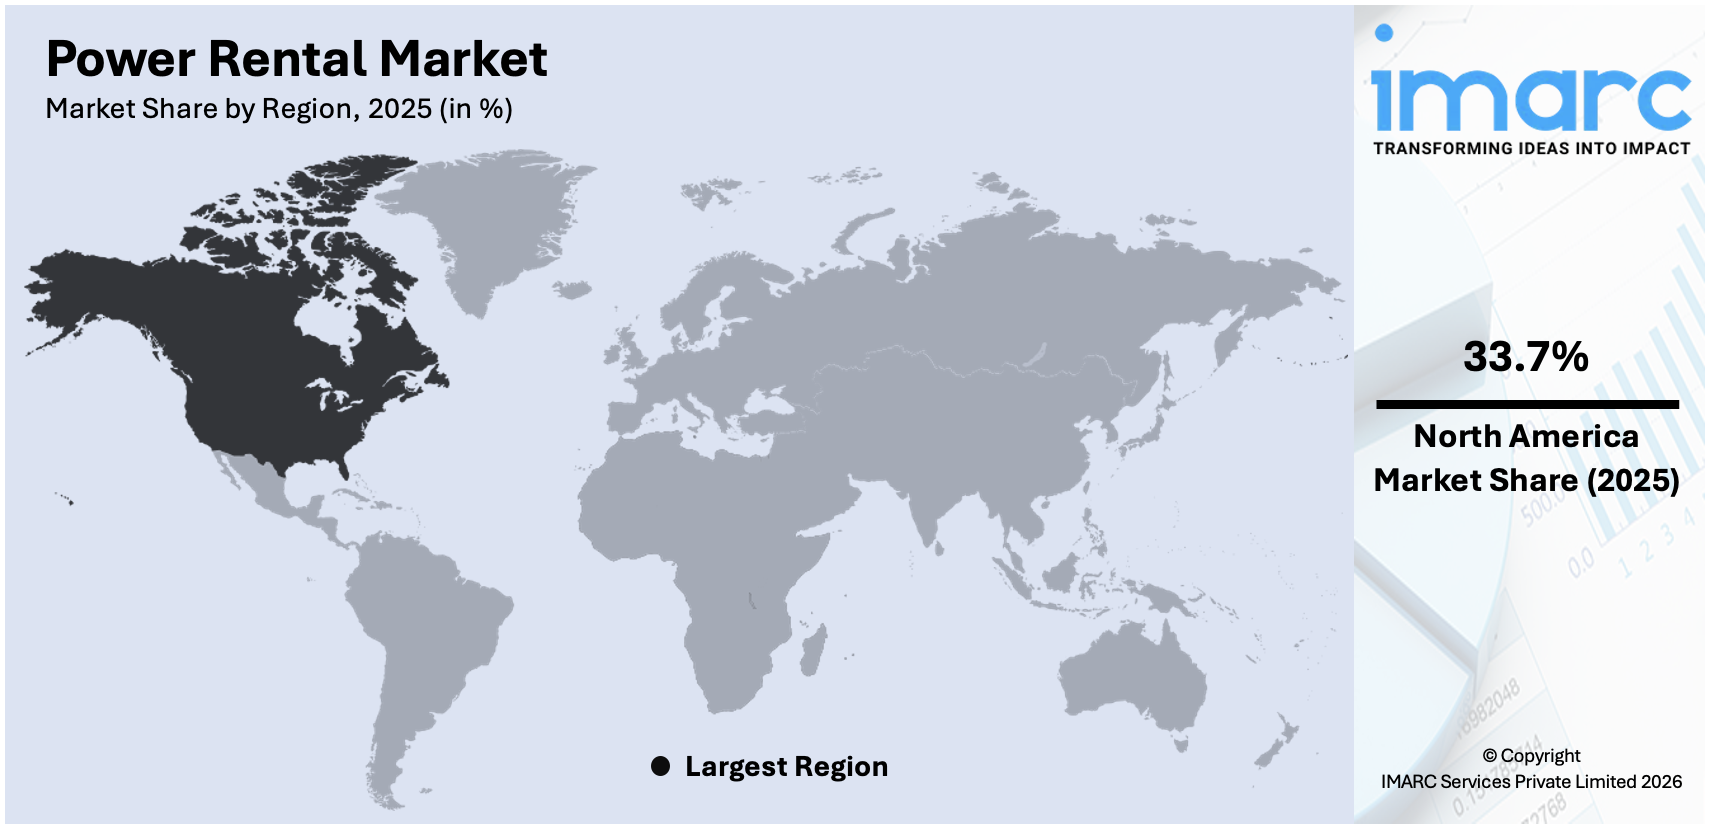
The global power rental market size was valued at USD 23.0 Billion in 2025. Looking forward, IMARC Group estimates the market to reach USD 38.3 Billion by 2034, exhibiting a CAGR of 5.63% during 2026-2034. North America currently dominates the market, holding a significant market share of over 33.7% in 2025. The growing severity of natural disasters such as hurricanes, floods, and earthquakes, the increasing need for emergency power to support rescue operations, and the integration of advanced technologies are among the key factors driving the market growth.
|
Report Attribute
|
Key Statistics
|
|---|---|
|
Base Year
|
2025 |
|
Forecast Years
|
2026-2034
|
|
Historical Years
|
2020-2025
|
| Market Size in 2025 | USD 23.0 Billion |
| Market Forecast in 2034 | USD 38.3 Billion |
| Market Growth Rate (2026-2034) | 5.63% |
The global market is primarily driven by increasing demand for uninterrupted power supply across industries such as construction, manufacturing, and events. Rapid urbanization and industrialization, particularly in developing regions, are escalating the need for temporary power solutions to address power shortages and grid failures. Furthermore, frequent natural disasters and unpredictable weather conditions also increase the reliance on rental generators for emergency power backup. Technological advancements in energy-efficient rental equipment and hybrid power systems are contributing to market growth. Additionally, the expanding oil and gas sector, coupled with the rise of infrastructure development projects worldwide, is further accelerating the demand for flexible, cost-effective, and scalable power rental solutions to ensure operational continuity.
To get more information on this market Request Sample
The United States stands out as a key regional market, primarily driven by the growing demand for reliable and flexible power solutions in sectors such as healthcare, data centers, and telecommunications. Increasing infrastructure upgrades and the expansion of renewable energy projects are leading to higher reliance on temporary power sources during transitions or grid maintenance. On 31st January 2024, Mobile Power Ltd. secured €3m in Results-Based Financing with the Beyond the Grid Fund for Africa to scale up its pay-as-you-go solar battery rental company in the Democratic Republic of Congo. The hub-based business rents out solar-charged batteries to households, micro and small businesses, and electric vehicles, without requiring any deposit or debt, thus enabling cheap, clean energy under a pay-per-use scheme. In addition, the rise in extreme weather events, such as hurricanes, wildfires, and snowstorms, has highlighted the need for emergency power backup, driving market growth. Concurrently, the growing entertainment and event industry requires dependable power for large-scale events and festivals which are favoring the market. Rising investments in oil and gas exploration, alongside advancements in cleaner rental technologies such as natural gas and hybrid systems, further propel demand for power rental solutions.
Power Rental Market Trends:
Infrastructure Development and Urbanization
The relentless pace of urbanization and infrastructure development in emerging economies is one of the key market drivers for the power rental industry. According to the UN, it is estimated that 68% of the world's population will be living in urban areas by 2050. With cities developing and multiple infrastructure projects unfolding, the demand for reliable power generation also multiplies. Construction activities, including building commercial and residential properties, as well as public infrastructure mainly roads and bridges, demand high amounts of power for equipment and machinery. Given that these are generally temporary needs, companies are more inclined to rent power equipment rather than purchase and maintain them. This tendency has led to a rise in demand for power rentals, making it an integral part of modern urban development projects.
Seasonal and Event-Driven Requirements
Another significant driver is the seasonal and event-based need for additional power. Along with this, the escalating agricultural operations that require extra power during harvest seasons, or large-scale events including concerts and sports tournaments that need temporary but substantial electrical supply are significantly supporting the market. According to the government of the UAE, in 2023, Dubai hosted a total of 25 diverse sports events, including seven prestigious international championships, across various locations within the city. These requirements are often short-lived and highly specific, making rental power a more cost-effective and convenient solution compared to permanent installations. In addition, the flexibility offered by rental agreements allows businesses and event organizers to scale their power requirements up or down as needed, optimizing costs and ensuring reliable supply. Moreover, the increasing number of large-scale events and seasonal industries opting for power rentals demonstrates the growing reliance on this market.
Stringent Emissions Regulations
Environmental concerns and stringent emissions regulations are also shaping the power rental industry. In confluence with this, governments around the world are imposing stricter laws on emissions from power generation equipment, pushing companies to opt for cleaner, more efficient technologies. This change has led to a rise in the demand for eco-friendly power rental solutions, such as generators that run on natural gas or renewable sources, such as solar and wind. For instance, in 2023, Hitachi Energy, a global technology leader committed to advancing a sustainable energy future, has introduced the HyFlex™ demonstration unit, its innovative Hydrogen Power Generator, in Gothenburg, Sweden. Furthermore, rental companies are incentivized to invest in cleaner technologies to attract a broader customer base, which in turn is fueling research and development in the sector. In this way, environmental regulations are acting not as a hindrance but as a catalyst for growth and innovation in the power rental market.
Power Rental Industry Segmentation:
IMARC Group provides an analysis of the key trends in each segment of the global power rental market, along with forecast at the global, regional, and country levels from 2026-2034. The market has been categorized based on fuel type, equipment type, power rating, application, and end use industry.

Analysis by Fuel Type:
- Diesel
- Natural Gas
- Others
Diesel stands as the largest component in 2025, holding around 51.7% of the market. The demand for diesel fueled generators in the power rental industry is propelled by several market drivers. Diesel generators are known for their durability, high-energy output, and relatively lower cost of operation, making them a popular choice for heavy-duty applications such as industrial projects, construction sites, and emergency backup during power outages. The fuel is readily available and allows for easier storage and transportation compared to other fuel types, offering greater convenience and reliability. Diesel generators can also be rapidly deployed, providing a quick solution for immediate power needs, a feature that is particularly critical during natural disasters or unplanned maintenance shutdowns. While environmental concerns have led to stricter emissions standards, advancements in diesel technology have produced cleaner, more efficient models, which can meet regulatory requirements and are thus more appealing to a broad customer base.
Analysis by Equipment Type:
- Generator
- Transformer
- Load Bank
- Others
Generator leads the market with around 56.1% of market share in 2025. The market for generator rentals within the power rental industry is experiencing robust growth, driven by the increased demand for reliable and continuous power supply across various sectors, including construction, events, and emergency services. In addition, generators are versatile and can be deployed quickly, making them an ideal solution for temporary power needs. Technological advancements have also played a role; newer generator models are more efficient and environmentally friendly, aligning with stringent emissions regulations. Moreover, the rise in natural disasters necessitates emergency power solutions, and generators are often the go-to equipment for rapid response. Additionally, economic considerations make renting generators a cost-effective alternative to buying, as it eliminates the need for maintenance and long-term storage. Regulatory support in the form of favorable policies and incentives further facilitates the growth of generator rentals.
Analysis by Power Rating:
- Up to 50 kW
- 51 –500 kW
- 501 –2,500 kW
- Above 2,500 kW
51 –500 kW leads the market with around 40.3% of market share in 2025. The 51-500 kW power rating segment is a key driver in the power rental market, enjoying considerable demand from a range of industries. These medium-capacity generators offer the ideal balance between power output and portability, making them suitable for a variety of applications, including small-to-medium sized events, construction projects, and backups for commercial establishments. Their relatively lower rental cost compared to higher-capacity units makes them an economically viable choice for businesses with limited power requirements or budgets. Additionally, these units often come with advanced technological features such as remote monitoring and automated load management, enhancing operational efficiency. The flexibility to scale up or down within this power range allows businesses to tailor their energy consumption based on real-time needs, contributing to cost savings.
Analysis by Application:
Access the comprehensive market breakdown Request Sample
- Peak Shaving
- Standby Power
- Base Load/Continuous Power
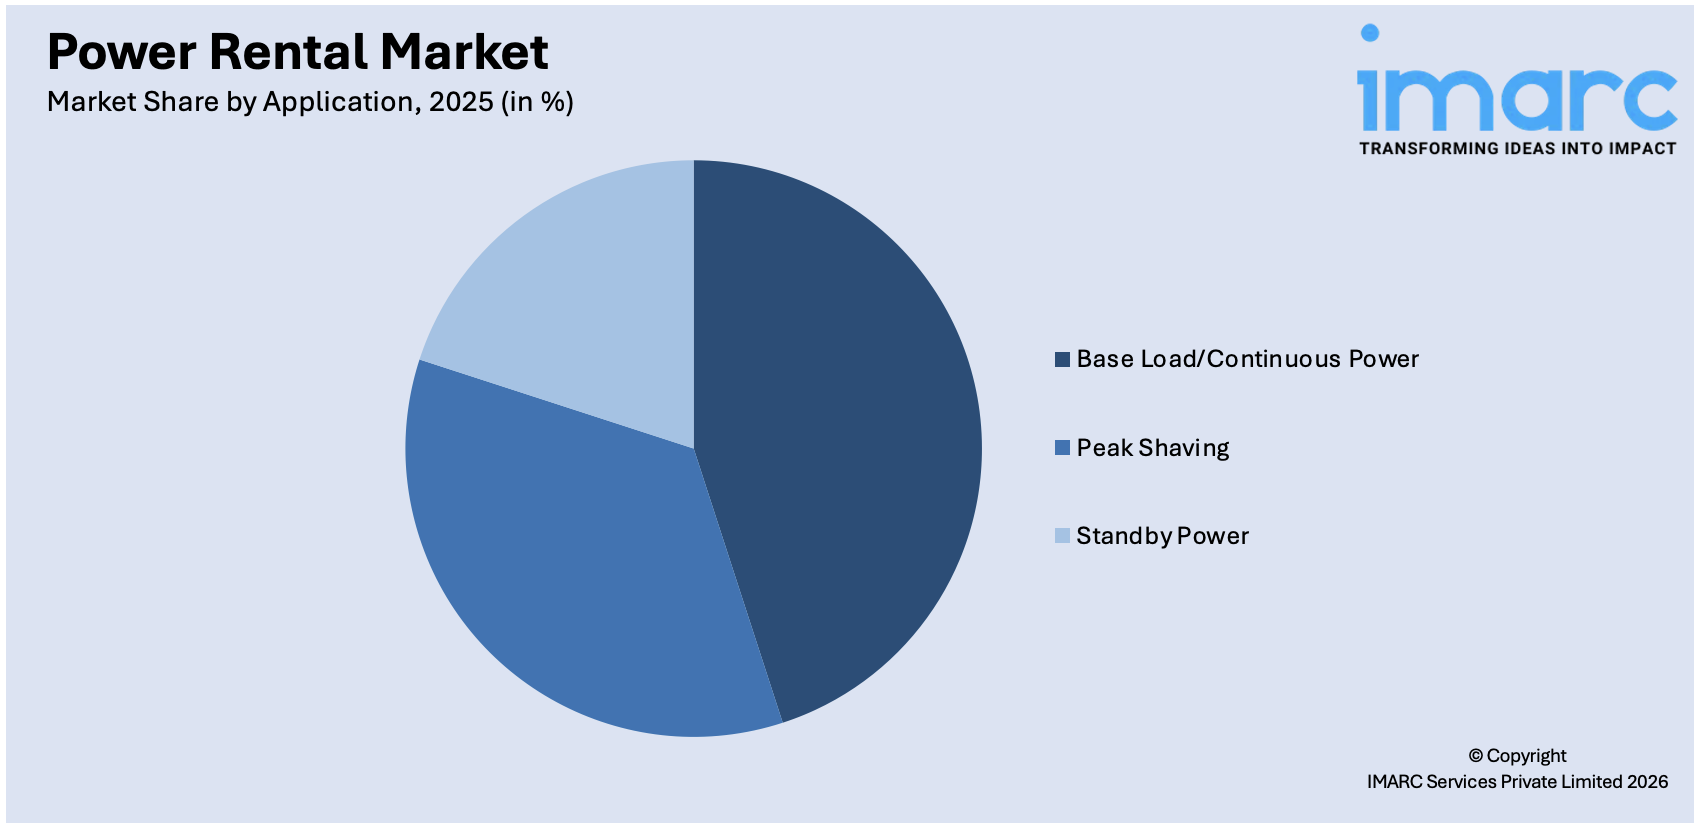
Base load/continuous power leads the market with around 44.2% of market share in 2025. The base load or continuous power application segment is a significant market driver in the power rental industry. This segment caters to long-term, steady power requirements essential for various industries such as manufacturing, data centers, and utilities. The constant need for power in these sectors ensures a stable and sustained demand for rental solutions. Additionally, renting equipment for base load applications is often more cost-effective than purchasing and maintaining permanent installations, particularly for businesses with fluctuating power needs. It also eliminates the challenges associated with asset depreciation and maintenance overheads. Technological advancements have led to the development of highly efficient and reliable generators that are capable of meeting the rigorous demands of continuous operation. These generators often come with features, such as real-time monitoring and predictive maintenance, reducing the likelihood of unexpected downtimes.
Analysis by End Use Industry:
- Utilities
- Oil & Gas
- Events
- Construction
- Mining
- Data Centers
- Others
Utilities lead the market with around 31.40% of market share in 2025. The utilities segment represents a significant market driver in the power rental industry. Utilities frequently need to contract temporary power solutions during planned maintenance, system upgrades, or unexpected outages to avoid a disruption in service to consumers. As the demand for electricity continues to rise, utility companies face increasing pressure to maintain high levels of reliability and resilience. In addition, renting power equipment offers them the flexibility to meet these challenges without the high capital expenditure associated with owning and maintaining additional permanent facilities. This is especially crucial during peak demand seasons or emergency situations where rapid response is needed. Technological innovations in the rental market, such as advanced monitoring systems and energy-efficient generators, further align with the utilities industry’s requirements for reliable and environmentally responsible power solutions.
Regional Analysis:
To get more information on the regional analysis of this market Request Sample
- North America
- United States
- Canada
- Europe
- Germany
- United Kingdom
- France
- Russia
- Italy
- Others
- Asia Pacific
- China
- Japan
- South Korea
- India
- Australia
- Others
- Latin America
- Brazil
- Mexico
- Others
- Middle East and Africa
- Saudi Arabia
- United Arab Emirates
- South Africa
- Others
In 2025, North America accounted for the largest market share of over 33.7%. The power rental market in North America is experiencing substantial growth, influenced by the rising frequency of extreme weather events such as hurricanes, wildfires, and storms. This is often leading to power outages that necessitate temporary power solutions. Additionally, the region's industrial and infrastructural developments demand a stable and reliable power supply, making rental power services essential for construction sites, manufacturing plants, and temporary facilities. Along with this, the North American market is also getting technological benefits from generator equipment. It is more energy efficient and environmentally compliant, hence gaining widespread acceptance by businesses for stringent regulatory requirements.
Apart from this, the trend towards decentralization of power generation is contributing to the growth. In remote areas connecting to the grid is challenging, and power rental solutions offer an effective alternative. Economic factors also play a part; renting power equipment offers cost benefits, including no maintenance and depreciation costs, appealing to budget-conscious businesses. Moreover, regulatory support in the form of grants, tax incentives, and simplified approval processes for temporary installations encourages both suppliers and end-users to opt for rental solutions.
Key Regional Takeaways:
United States Power Rental Market Analysis
In 2025, the US accounted for around 80.30% of the total North America power rental market. The expansion of oil and gas exploration in remote areas of the United States is creating a strong demand for reliable portable power solutions. According to the U.S. Energy Information Administration, in 2023, U.S. crude oil production, including condensate, reached an average of 12.9 Million barrels per day (b/d), surpassing the previous record of 12.3 Million b/d set in 2019. Additionally, the U.S. established a new monthly production record in December 2023, exceeding 13.3 Million b/d. These solutions are ensuring uninterrupted operations in locations lacking infrastructure, and providing essential energy for drilling, extraction, and other critical tasks. Moreover, portable power systems are also offering flexibility, efficiency, and scalability in challenging environments. In line with this, frequent natural disasters, such as hurricanes and winter storms across the United States, are causing widespread damage to infrastructure, leading to power outages, damaged power lines, and long recovery periods, severely affecting daily life and business operations.
Asia Pacific Power Rental Market Analysis
Construction and mining industries have gained immense significance in countries such as India and China; thus, an increased power supply requirement arises for maintaining an uninterrupted source of energy. This in turn improves the need for rental power solutions while increasing efficiency in operation along with productivity. According to the India Brand Equity Foundation (IBEF), India's coal production experienced a significant increase, rising to 893.08 Million tonnes (MT) in the financial year 2023, compared to 728.72 MT in the financial year 2019, reflecting a growth of approximately 22.6%.In line with this, rapid industrialization and urban growth in countries like China, India, and various Southeast Asian nations is driving the growth of the power rental market. According to the government of China, China's urbanization rate for permanent residents reached 64.72 percent in 2021.
Europe Power Rental Market Analysis
The increasing demand for sustainable energy sources across the region is a major factor driving the demand for reliable, temporary power solutions. As renewable energy projects continue to expand, the power rental market is witnessing significant growth with flexible energy options. According to the International Energy Agency, in response to the energy crisis, the European Union accelerated the deployment of solar photovoltaic (PV) and wind energy, adding over 50 GW in 2022. Increasing demand for temporary power solutions in the construction, oil and gas, and manufacturing sectors is further pushing the power rental market forward in Europe, which assures operational continuity and cost efficiency. According to the European Union, the construction industry has been a key contributor to the EU economy, providing 18 Million direct jobs and accounting for approximately 9% of the EU's GDP. Furthermore, according to the European Commission, in 2022, EU refineries produced 544.3 Million tonnes of oil equivalent (Mtoe) of petroleum products, reflecting a 4.5% recovery compared to the previous year.
Latin America Power Rental Market Analysis
Increasing demand for machinery and irrigation systems by the agriculture industry in Latin America is a major growth factor for the power rental market. Additionally, seasonal requirements and the need for reliable sources of energy further enhance this trend. According to the International Trade Administration, despite broader economic contractions in Mexico, agribusiness production demonstrated resilience in response to COVID-19-related demand for food products, recording a 4.5 percent growth in 2021. This growth resulted in the total production of 290.7 Million tons, encompassing 21.7 Million hectares harvested, 1.9 Million tons of fisheries-related products, and 7.4 Million tons of meat.
Middle East and Africa Power Rental Market Analysis
In Middle Eastern countries, where electricity is witnessing an increased demand amidst extreme heatwaves, this increases the strain on their power grids and consequently is experiencing more frequent shutdowns. More and more users are relying on temporary rental power solutions to offset some of the deficiencies that affect the power supply. It supports the growth of the expansion of the power rental market in oil and gas exploration driven by energy needs. According to the International Trade Administration, the United Arab Emirates (UAE) ranked among the world's ten largest oil producers, having produced an average of 3.2 Million barrels of petroleum and liquids per day.
Competitive Landscape:
The power rental market globally is extremely competitive. Companies are trying to gain market share through innovation and strategic partnerships. Companies are investing in advanced, energy-efficient, and low-emission power solutions that meet the increasing environmental regulations and demands of customers. Most of these companies are expanding their rentals for hybrid and renewable power systems in coping with the shift toward solutions from sustainable energy. Strategic partnership deals, acquisitions, and mergers are held in place for geographical reach as well as enhancing services for themselves. The current digital technologies in the shape of IoT and remote monitoring systems are being adopted by the players for improving operational efficiency with live solutions for power management available in real-time to customers. Customized service, along with flexible renting options, makes this a competitive field in the market.
The report provides a comprehensive analysis of the competitive landscape in the power rental market with detailed profiles of all major companies, including:
- Aggreko Plc
- Caterpillar, Inc.
- Atlas Copco Group
- Cummins, Inc.
- United Rentals, Inc.
- HIMOINSA S.L.
- Horizon Acquisition (Horizon Power Systems)
- The Hertz Corporation
- Generac Power Systems
- Wacker Neuson SE
- Wärtsilä Oyj Abp
- Speedy Hire Plc
- Smart Energy Solutions (SES)
- SoEnergy International, Inc.
Latest News and Developments:
- February 2024: Kanoo Power Solutions (KPS), a division of Ebrahim K. Kanoo (EKK), entered into a strategic partnership with VISA SpA Group, a prominent player in the diesel generator (DG) manufacturing industry with a 63-year legacy. Under the agreement, VISA SpA committed to delivering customized solutions, backed by a dedicated team of engineers skilled in designing efficient and tailored responses to meet specific client requirements.
- May 2024: Lighting tower and generator specialist Trime launched a range of diesel-powered generators. This new line, covering a power range from 6kVA to 670kVA, incorporated the latest diesel engines from renowned manufacturers such as Kohler Stage V, Yanmar, FPT Iveco, and Perkins
- October 2024: Power Engineering India Pvt Ltd, at its Banda facility, introduced its newest innovation: Glass Reinforced Polymer (GRP) Diesel Generators. This revolutionary product, designed with advanced engineering materials, established new industry standards for durability, aesthetics, and environmental sustainability.
- October 2024: Baudouin successfully announced the launch of its range of diesel generator sets, specifically engineered to address the requirements of the demanding data center industry. Backed by decades of expertise in power systems, the company introduced an integrated solution tailored for data centers requiring uninterrupted and reliable power.
- December 2024: Greenzo Energy India Limited (GEIL), India’s sole manufacturer of 100% Made-in-India alkaline electrolyzers, partnered with France’s EODev (Energy Observer Developments) to launch GEH2 hydrogen fuel cell power generators in the Indian and Nepalese markets.
Power Rental Market Report Scope:
| Report Features | Details |
|---|---|
| Base Year of the Analysis | 2025 |
| Historical Period | 2020-2025 |
| Forecast Period | 2026-2034 |
| Units | Billion USD |
| Scope of the Report | Exploration of Historical Trends and Market Outlook, Industry Catalysts and Challenges, Segment-Wise Historical and Future Market Assessment:
|
| Fuel Types Covered | Diesel, Natural Gas, Others |
| Equipment Types Covered | Generator, Transformer, Load Bank, Others |
| Power Ratings Covered | Up to 50 kW, 51 –500 kW, 501 –2,500 kW, Above 2,500 kW |
| Applications Covered | Peak Shaving, Standby Power, Base Load/Continuous Power |
| End Use Industries Covered | Utilities, Oil & Gas, Events, Construction, Mining, Data Centers, Others |
| Regions Covered | Asia Pacific, Europe, North America, Latin America, Middle East and Africa |
| Countries Covered | United States , Canada, Germany, United Kingdom, France, Russia, Italy, China, Japan, South Korea, India, Australia, Brazil, Mexico, Saudi Arabia, United Arab Emirates, South Africa |
| Companies Covered | Aggreko Plc, Caterpillar, Inc., Atlas Copco Group, Cummins, Inc., United Rentals, Inc., HIMOINSA S.L., Horizon Acquisition (Horizon Power Systems), The Hertz Corporation, Generac Power Systems, Wacker Neuson SE, Wärtsilä Oyj Abp, Speedy Hire Plc, Smart Energy Solutions (SES), SoEnergy International, Inc.,etc. |
| Customization Scope | 10% Free Customization |
| Post-Sale Analyst Support | 10-12 Weeks |
| Delivery Format | PDF and Excel through Email (We can also provide the editable version of the report in PPT/Word format on special request) |
Key Benefits for Stakeholders:
- IMARC’s industry report offers a comprehensive quantitative analysis of various market segments, historical and current market trends, market forecasts, and dynamics of the power rental market from 2020-2034.
- The research report provides the latest information on the market drivers, challenges, and opportunities in the global power rental market.
- The study maps the leading, as well as the fastest-growing, regional markets. It further enables stakeholders to identify the key country-level markets within each region.
- Porter's five forces analysis assist stakeholders in assessing the impact of new entrants, competitive rivalry, supplier power, buyer power, and the threat of substitution. It helps stakeholders to analyze the level of competition within the power rental industry and its attractiveness.
- Competitive landscape allows stakeholders to understand their competitive environment and provides an insight into the current positions of key players in the market.
Frequently Asked Questions About the Power Rental Market Report
Power rental refers to the temporary provision of power generation equipment, such as generators, transformers, and load banks, to meet short-term or emergency energy needs. Industries utilize rental solutions to ensure uninterrupted operations during power outages, grid failures, or fluctuating energy demands.
The power rental market was valued at USD 23.0 Billion in 2025.
IMARC estimates the global power rental market to exhibit a CAGR of 5.63% during 2026-2034.
The market is driven by the increasing demand for uninterrupted power supply across industries, frequent natural disasters, rapid urbanization, and industrialization. Advancements in energy-efficient technologies and hybrid power systems, along with the expanding oil and gas sector, are also fueling growth.
Diesel represented the largest segment by fuel type, driven by its durability, high energy output, and cost-effectiveness for heavy-duty and emergency power applications.
Generator leads the market by equipment type due to its versatility, quick deployment, and critical role in providing temporary power solutions across various industries.
The 51–500 kW segment is the leading segment by power rating, driven by its balance of portability, cost-effectiveness, and suitability for small-to-medium-sized events and industrial applications.
Base load/continuous power leads the market by application due to its ability to provide reliable, long-term power solutions for industries including manufacturing, utilities, and data centers.
Utilities represented the largest segment by end use industry, driven by the need for temporary power during maintenance, grid upgrades, and peak demand periods.
On a regional level, the market has been classified into North America, Asia Pacific, Europe, Latin America, and the Middle East and Africa, wherein North America currently dominates the market.
Some of the major players in the global power rental market include Aggreko Plc, Caterpillar, Inc., Atlas Copco Group, Cummins, Inc., United Rentals, Inc., HIMOINSA S.L., Horizon Acquisition (Horizon Power Systems), The Hertz Corporation, Generac Power Systems, Wacker Neuson SE, Wärtsilä Oyj Abp, Speedy Hire Plc, Smart Energy Solutions (SES), and SoEnergy International, Inc., among others.
Need more help?
- Speak to our experienced analysts for insights on the current market scenarios.
- Include additional segments and countries to customize the report as per your requirement.
- Gain an unparalleled competitive advantage in your domain by understanding how to utilize the report and positively impacting your operations and revenue.
- For further assistance, please connect with our analysts.
 Request Customization
 Speak to an Analyst
 Request Brochure
 Inquire Before Buying
Benefits of Customization
- Personalize this research
- Triangulate with your data
- Get data as per your format and definition
- Gain a deeper dive into a specific application, geography, customer, or competitor
- Any level of personalization
Get in Touch With Us
UNITED STATES
Phone: +1-201-971-6302
INDIA
Phone: +91-120-433-0800
UNITED KINGDOM
Phone: +44-753-714-6104
Email: [email protected]
Client Testimonials


.webp)


