
Black Gram Market Size, Share, Trends and Forecast by Region, 2026-2034
Black Gram Market Size and Share:
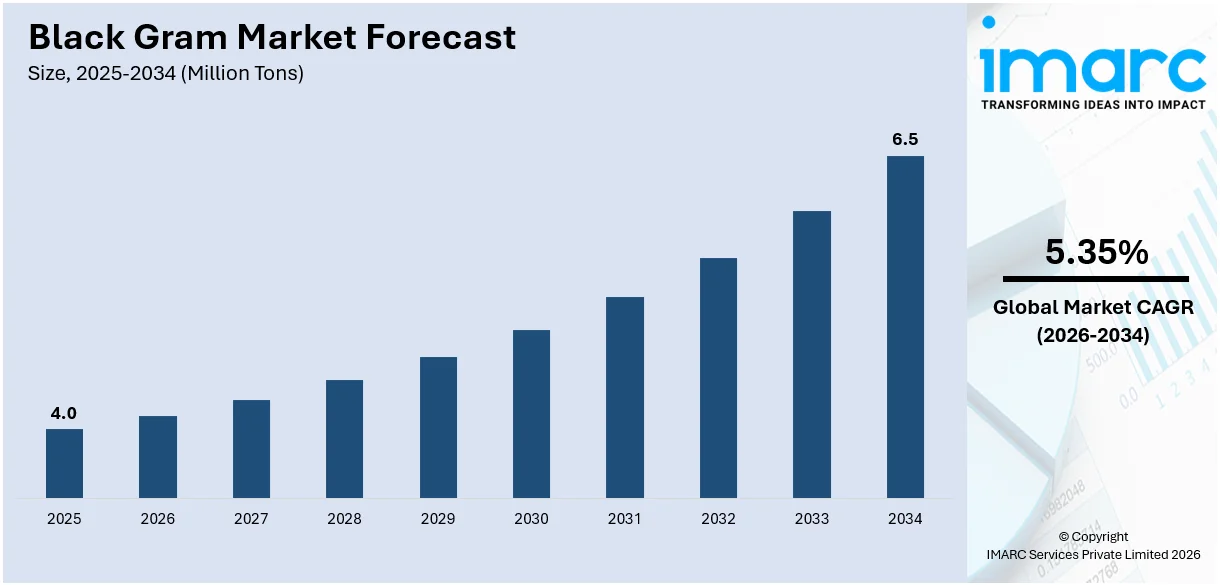
The global black gram market size reached 4.0 Million Tons in 2025. Looking forward, the market is expected to reach 6.5 Million Tons by 2034, exhibiting a CAGR of 5.35% from 2026-2034. India currently dominates the market, holding a market share of 68.8% in 2025. The market is experiencing steady growth driven by rising demand for plant-based proteins, expanding health awareness, and supportive agricultural policies. Its widespread use in traditional diets and increasing presence in packaged food products are further contributing to market expansion. With strong production and consumption in key regions, the black gram market share is expected to remain robust over the coming years, supported by evolving dietary preferences.
|
Report Attribute
|
Key Statistics
|
|---|---|
|
Base Year
|
2025
|
|
Forecast Years
|
2026-2034
|
|
Historical Years
|
2020-2025
|
|
Market Size in 2025
|
4.0 Million Tons |
|
Market Forecast in 2034
|
6.5 Million Tons |
| Market Growth Rate 2026-2034 | 5.35% |
Black gram market is majorly driven by the rising demand for protein-rich pulses from healthy food consumers. Its rich nutritional content, including proteins, fiber, and minerals, renders it a popular choice in a vegetarian diet. Also, the rising health awareness level of people towards plant-based foods is propelling increased consumption. Black gram's incorporation in the traditional food in South Asia guarantees steady domestic demand and increasing export prospects are leading to black gram market growth. Favorable agricultural policies, including subsidies and assured minimum prices, are encouraging farmers to cultivate black gram, leading to increased overall output. For instance, in January 2024, the Government of India launched a new portal for farmers to facilitate the direct purchase of Tur Dal, aiming for self-sufficiency in pulses by January 2028. The initiative will support farmers with minimum support prices and will eventually extend to other pulses, including black gram, enhancing domestic production. Innovations in pulse processing and the development of improved seed varieties are also aiding in achieving higher yields and better quality. In addition, rising concerns regarding food security and increasing demand from the packaged food and ready-to-cook industries are enhancing the market's long-term potential.
To get more information on this market Request Sample
Black Gram Market Trends:
Government Support
Government assistance for pulse cultivation remains essential in enhancing black gram production. By implementing schemes that offer minimum support prices, input subsidies, and access to high-quality seeds, authorities are working to improve farmer participation and lessen reliance on imports. There is also a push for initiatives that encourage crop diversification and intercropping with black gram to increase land productivity. For instance, in June 2025, the Indian Agricultural Research Institute (IARI) directed farmers to propagate green gram and black gram, emphasizing correct soil moisture for optimal germination. Farmers are encouraged to treat seeds with Rhizobium culture and PSB for enhanced growth. Recommended high-yield varieties include Pusa 1431 and Urd Type-9 for better market returns. Furthermore, training programs and rural extension services aim to help farmers adopt effective practices and minimize post-harvest losses. This proactive engagement is contributing to a more stable domestic supply, improved farmer income, and consistent availability, shaping one of the most significant black gram market trends today.
Expansion of E-commerce
The rise of online retailing has transformed black gram distribution, with e-commerce platforms enhancing both accessibility and convenience. According to the data published by the International Trade Administration (ITA), global B2C eCommerce revenue is projected to reach USD 5.5 Trillion by 2027, growing at a 14.4% CAGR. The Indian e-commerce market is valued at USD 63.17 Billion, with a CAGR of 14.1% expected from 2023 to 2027. In 2023, online marketplaces led product searches, with 30% usage. These platforms provide door-to-door delivery and subscription options, simplifying access to black gram for consumers in urban and rural areas. Improved logistics and real-time inventory management contribute to maintaining freshness and a steady supply, while tailored promotions and bundled offers appeal to health-conscious shoppers. Digital marketplaces also allow small producers to connect directly with consumers, enhancing transparency and competitive pricing. As shopping habits shift toward online grocery purchases, this change has a crucial impact. According to black gram market forecast, e-commerce is set to be a key growth driver moving forward.
Shift Toward Plant-Based Proteins
The increasing trend toward plant-based diets is notably affecting consumer preferences, with black gram becoming a favored protein source. Packed with essential amino acids, fiber, and minerals, black gram serves as a nutritious alternative to animal-based proteins, drawing the interest of vegetarians, vegans, and those conscious about health. With many seeking sustainable and ethical food choices, black gram is becoming more prominent in everyday meals, health supplements, and protein-rich snacks. Food manufacturers are also integrating it into ready-to-eat and high-protein products. This growing health awareness and dietary transition are directly driving the rise in black gram market demand across various consumer segments.
Black Gram Industry Segmentation:
IMARC Group provides an analysis of the key trends in each segment of the global black gram market, along with forecast at the global, regional and country levels from 2026-2034. The market has been categorized based on region.
Regional Analysis:
To get more information on the regional analysis of this market Request Sample
- India
- Myanmar
- Thailand
- Others
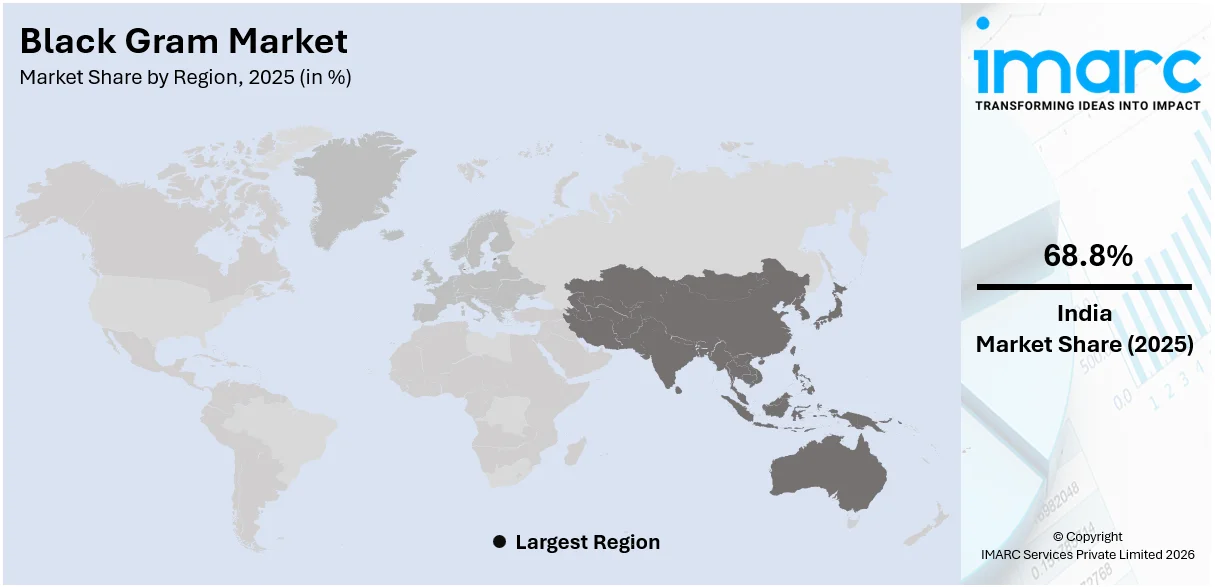
In 2025, India accounted for the largest market share of over 68.8% due to extensive cultivation, significant domestic consumption, and a strong cultural affinity for pulse-based diets. Black gram serves as a staple in Indian cuisine, with its use in traditional meals ensuring steady demand across various regions. Supporting factors include favorable agro-climatic conditions, government backing, and a solid supply chain, which bolster India's leadership in this market. The country also exports excess production, increasing its international presence. With rising health consciousness and a greater interest in plant-based protein, India's pivotal role is anticipated to continue. According to the black gram market outlook, India is set to maintain its lead in both production and consumption.
Key Regional Takeaways:
India Black Gram Market Analysis
The India black gram market is primarily driven by its high protein content, making it a vital dietary component, especially in protein-deficient and vegetarian populations. In line with this, the growing inclination toward plant-based diets is driving up consumption across both urban and rural regions. An industry report highlights that 30% of Indian restaurants focus on plant-forward dining, with 50% offering vegan, keto, or plant-based menus that emphasize health, sustainability, and locally sourced ingredients. Furthermore, favorable government initiatives, including the announcement of minimum support prices and assured procurement policies, are also encouraging farmers to increase cultivation. The ongoing deployment of climate-resilient and high-yielding seed varieties is improving crop productivity and augmenting farmer incomes. Similarly, the rising use of black gram in Ayurvedic and traditional medicine to address digestive issues, joint pain, and reproductive health is further expanding its application. The black gram’s increasing role in managing diabetes and hypertension is gaining market attention amid India’s increasing chronic disease prevalence. Apart from this, the expanding market for value-added pulse-based food products and a surge in export demand are creating a positive outlook for the industry.
Myanmar Black Gram Market Analysis
The Myanmar market for black gram is expanding due to its unique advantage as the primary global cultivator of the pulse, which is largely unavailable elsewhere. In accordance with this, the government’s supportive initiative to utilize fallow and underutilized lands for pulse farming is further promoting production. Similarly, emerging global trends of plant-based diets are driving international demand for black gram as a key source of protein. The continual technological improvements in seed quality and mechanized harvesting are enhancing yields and facilitating market expansion. Moreover, the country’s agro-climatic conditions support multiple harvests annually, improving supply consistency and stimulating market appeal. The liberalized trade policies and infrastructural investments in port logistics are also facilitating smoother export processes in the industry. As such, India-Myanmar trade is projected to exceed USD 1.6 Billion in FY 2024–25, driven by liberalized trade policies, direct Kyat-Rupee payment systems, and strong exports of pulses and other goods from Myanmar to India. Besides this, expanded government-backed farming programs are increasing farmer participation and influencing market trends.
Thailand Black Gram Market Analysis
The Thailand black gram market is predominantly propelled by the rising preference for plant-based protein, as consumers increasingly prioritize health and dietary sustainability. Research on food trends in Thailand indicates that one in three consumers of plant-based, sports, or functional nutrition products report increasing their consumption of these products. Also, the incorporation of black gram in traditional Thai cuisine and street food is supporting robust domestic demand. Similarly, the government’s heightened emphasis on crop diversification and sustainable agricultural practices is promoting the cultivation of black gram. Moreover, Thailand’s organic food movement is fueling interest in pesticide-free black gram varieties among health-conscious consumers. The country’s growing exports of pulses to ASEAN and South Asian markets are further stimulating market growth. Furthermore, the rising use of black gram in ready-to-eat and convenience food segments is aligning with busy urban lifestyles and augmenting product sales. Additionally, ongoing investments in agricultural research and improved seed development are strengthening productivity and encouraging Thailand’s competitiveness in regional and global markets.
Competitive Landscape:
The landscape of the black gram market is competitive, featuring a variety of players operating at both local and national scales. Participants are focused on establishing robust procurement networks, enhancing supply chain efficiency, and ensuring consistent quality to stand out. Many are dedicating resources to advanced processing techniques to offer value-added products and meet the increasing demand for packaged and organic pulses. Companies are increasingly leveraging branding, innovative packaging, and digital marketing to distinguish their products in a saturated market. As consumer preference shifts toward traceable and sustainably sourced products, there's a greater emphasis on certifications and quality assurance. Additionally, collaborations with retailers and a push into e-commerce avenues are heightening competition, making innovation, cost management, and customer engagement essential for long-term success in the black gram market.
The report provides a comprehensive analysis of the competitive landscape in the global black gram market with detailed profiles of all major companies.
Latest News and Developments:
- June 2025: Telangana Agricultural University launched a seed distribution program to mark State Formation Day, providing quality seed kits, including black gram, to 40,000 progressive farmers across 11,000 villages. Aiming for seed self-sufficiency, the initiative encourages farmers to share seeds post-harvest, reducing dependency on costly commercial seeds within two to three years.
- March 2025: India extended its free import policy for black gram (urad) until March 2026 to meet rising domestic demand.
- February 2025: Finance Minister Nirmala Sitharaman launched a six-year mission to boost pulses output, targeting self-sufficiency by 2029-30. Focused on tur, urad (black gram), and masoor, the initiative includes seed development, assured procurement, and post-harvest support, addressing inflation and import dependence amid recent weather-induced drops in black gram production.
- October 2024: Union Minister Shri Shivraj Singh Chouhan launched rural development schemes in Madhya Pradesh, including 500 km of roads, a housing survey, and the Awas Sakhi app. He announced MSP procurement of black gram and other crops, support for farmers, and the Lakhpati Didi initiative to empower women economically.
- September 2024: The NCCF launched India’s first assured buyback farming scheme for pulses, including black gram (urad), in tribal areas of Jharkhand and Tamil Nadu. Covering 1,259 acres, the initiative aims to augment pulse production, ensure MSP-based procurement, and achieve self-sufficiency by 2027 amid declining yields and rising import dependence.
Black Gram Market Report Scope:
| Report Features | Details |
|---|---|
| Base Year of the Analysis | 2025 |
| Historical Period | 2020-2025 |
| Forecast Period | 2026-2034 |
| Units | Million Tons, Million USD |
| Scope of the Report |
Exploration of Historical Trends and Market Outlook, Industry Catalysts and Challenges, Segment-Wise Historical and Future Market Assessment:
|
| Regions Covered | India, Myanmar, Thailand, Others |
| Customization Scope | 10% Free Customization |
| Post-Sale Analyst Support | 10-12 Weeks |
| Delivery Format | PDF and Excel through Email (We can also provide the editable version of the report in PPT/Word format on special request) |
Key Benefits for Stakeholders:
- IMARC’s report offers a comprehensive quantitative analysis of various market segments, historical and current market trends, market forecasts, and dynamics of the black gram market from 2020-2034.
- The research study provides the latest information on the market drivers, challenges, and opportunities in the global black gram market.
- The study maps the leading, as well as the fastest-growing, regional markets. It further enables stakeholders to identify the key country-level markets within each region.
- Porter's five forces analysis assist stakeholders in assessing the impact of new entrants, competitive rivalry, supplier power, buyer power, and the threat of substitution. It helps stakeholders to analyze the level of competition within the black gram industry and its attractiveness.
- Competitive landscape allows stakeholders to understand their competitive environment and provides an insight into the current positions of key players in the market.
Frequently Asked Questions About the Black Gram Market Report
The black gram market reached 4.0 Million Tons in 2025.
The black gram market is projected to exhibit a CAGR of 5.35% during 2026-2034, reaching 6.5 Million Tons by 2034.
Rising health awareness, growing demand for plant-based protein, government support for pulse cultivation, and expanding applications in food processing are key drivers fueling the black gram market growth.
India currently dominates the black gram market, accounting for a significant share due to high consumption, favorable farming conditions, and strong government support.
Need more help?
- Speak to our experienced analysts for insights on the current market scenarios.
- Include additional segments and countries to customize the report as per your requirement.
- Gain an unparalleled competitive advantage in your domain by understanding how to utilize the report and positively impacting your operations and revenue.
- For further assistance, please connect with our analysts.
 Request Customization
 Speak to an Analyst
 Request Brochure
 Inquire Before Buying
Benefits of Customization
- Personalize this research
- Triangulate with your data
- Get data as per your format and definition
- Gain a deeper dive into a specific application, geography, customer, or competitor
- Any level of personalization
Get in Touch With Us
UNITED STATES
Phone: +1-201-971-6302
INDIA
Phone: +91-120-433-0800
UNITED KINGDOM
Phone: +44-753-714-6104
Email: [email protected]
Client Testimonials


.webp)


