
Pro AV Market Size, Share, Trends and Forecast by Solution, Distribution Channel, Application, and Region, 2026-2034
Pro AV Market Size and Share:
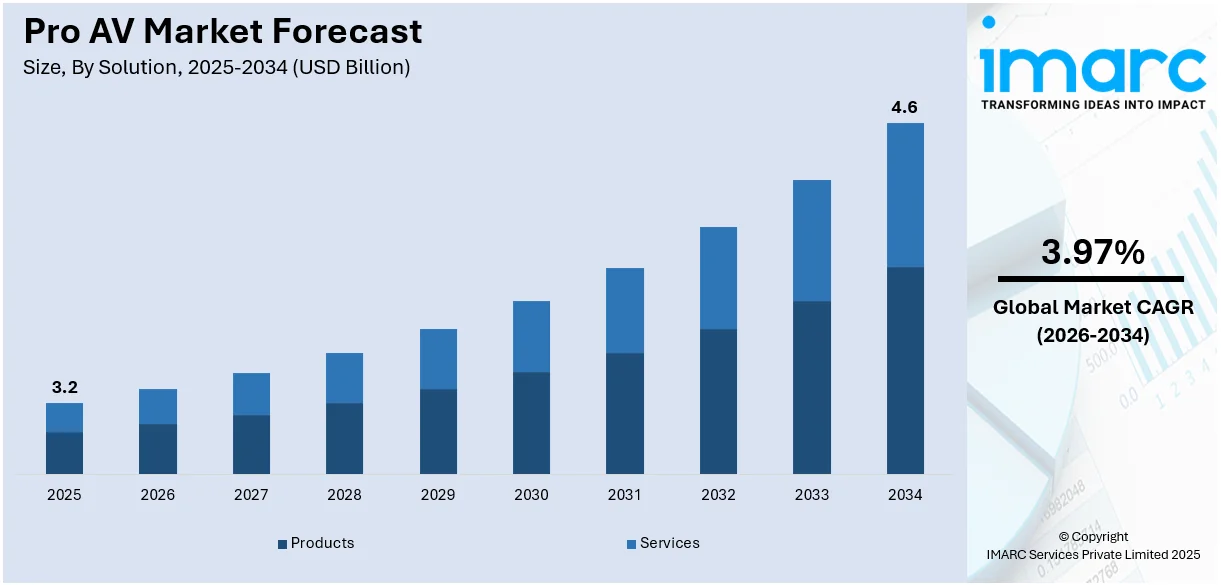
The global pro AV market size was valued at USD 3.2 Billion in 2025. Looking forward, IMARC Group estimates the market to reach USD 4.6 Billion by 2034, exhibiting a CAGR of 3.97% during 2026-2034. North America currently dominates the market, holding a significant market share of around 35.0% in 2025. The increasing demand for high-quality audio-visual solutions in corporate, educational, and entertainment sectors, growing adoption of cloud-based technologies, continual advancements in video conferencing tools, rising need for immersive experiences, integration of AI and IoT in AV systems, and the expansion of live events and remote working environments are some of the key factors expanding the market share.
|
Report Attribute
|
Key Statistics
|
|---|---|
|
Base Year
|
2025
|
|
Forecast Years
|
2026-2034
|
|
Historical Years
|
2020-2025
|
|
Market Size in 2025
|
USD 3.2 Billion |
|
Market Forecast in 2034
|
USD 4.6 Billion |
| Market Growth Rate 2026-2034 | 3.97% |
The growth of the pro AV market is significantly driven by advancements in digital technologies, enhancing audiovisual experiences for both businesses and consumers. Moreover, greater incorporation of artificial intelligence (AI) and machine learning (ML) into AV systems is streamlining content delivery and engagement. Apart from this, greater emphasis on live events is contributing to market expansion. This pro AV market trend is especially pronounced in India, where the number of live events climbed from 26,359 to 30,687 in 2024, a year-on-year increase of 39%, according to an industry report. Increased demand for high-quality audiovisual solutions to facilitate these events is fueling innovation in Pro AV technologies. In addition, the movement toward immersive technologies such as virtual and augmented reality is raising demand for high-quality AV solutions. Also, the increase in remote work and hybrid collaboration is growing the demand for smooth, secure AV systems.
To get more information on this market Request Sample
The market in the United Sates is propelled by the increasing investments in smart infrastructure and urban development, which is leading to higher demand for integrated AV systems in both commercial and residential projects. For instance, on June 20, 2024, the U.S. General Services Administration (GSA) reported an USD 80 Million funding from the Inflation Reduction Act to deploy smart building technologies in about 560 federal buildings across the country. Moreover, the growing usage of virtual events and video conferencing technologies, spurred on by the pandemic, is one of the key drivers supporting market growth. Besides this, ongoing improvements in 4K and 8K display technology are still further increasing demand for high-definition AV solutions. Further, widespread adoption of interactive learning tools within education, is generating new opportunities in the market for the latest Pro AV solutions.
Pro AV Market Trends:
Corporate collaboration and training
Pro AV has become integral to corporate environments, facilitating effective communication, collaboration, and training, which is providing an impetus to pro AV market growth. Modern office spaces are equipped with video conferencing systems, wireless presentation solutions, and interactive displays to foster teamwork and productivity. According to an industry report, In the United States, around 22 million adults, or 14% of the workforce, are working from home as of 2024. This shift in work dynamics has significantly increased the demand for pro AV technologies, which are crucial in facilitating seamless communication and collaboration across remote and hybrid teams. With businesses adopting flexible work models, pro AV solutions such as video conferencing systems, interactive displays, and wireless presentation tools are essential for maintaining productivity and ensuring effective information sharing. In addition to this, the training sector relies on pro AV for immersive simulations, employee development, and onboarding processes. As the corporate world recognizes the significance of efficient communication and skill development, the pro AV market share continues to thrive as a critical enabler of these objectives.
Continual technological advancements
Emerging innovations in display technologies, such as 4K and 8K resolution screens, OLED displays, and LED video walls, are leading t to enhanced visual experiences. Similarly, audio technologies, such as immersive sound systems and high-definition audio processing is improving the auditory aspect of these solutions. The global home audio equipment market reached USD 33.3 Billion in 2024 and is projected to double, reaching USD 66.5 Billion by 2033, at a CAGR of 7.57% during 2025-2033, according to IMARC Group. These advancements enhance the quality of presentations and entertainment and enable the integration of AV in various sectors, including education, healthcare, corporate, and entertainment. Furthermore, pro AV market forecast indicate that the ongoing convergence of pro AV with IT and networking technologies is set to revolutionize these systems, enhancing their versatility, scalability, and ease of management. This evolution is positioning pro AV solutions better to address the dynamic demands of modern enterprises and institutions. As a result, businesses and organizations are increasingly adopting AV solutions to stay competitive and provide superior experiences to their audiences.
Education technology integration
Interactive whiteboards, high-definition projectors, and collaborative audio systems facilitate engaging lessons in both physical classrooms and virtual learning environments. These technologies encourage student participation and improve knowledge retention, which is creating a positive pro AV market outlook. The ongoing evolution of remote and hybrid learning models further fuels the demand for AV equipment, ensuring that students have access to quality education regardless of their location. As educational institutions invest in modernizing their infrastructure, the market stands to benefit from this essential sector. In 2024, the global e-learning market size reached USD 342.4 Billion, and looking ahead, IMARC Group expects it to grow to USD 682.3 Billion by 2033, exhibiting a CAGR of 8.0% during 2025-2033. Furthermore, the systems are utilized for administrative purposes, including campus-wide announcements, event promotion, and safety alerts. Digital signage and campus-wide audio systems ensure efficient communication within educational institutions.
Pro AV Industry Segmentation:
IMARC Group provides an analysis of the key trends in each segment of the global pro AV market, along with forecasts at the global, regional, and country levels from 2026-2034. The market has been categorized based on solution, distribution channel, and application.
Analysis by Solution:
- Products
- Display
- AV Acquisition and Delivery Products
- Projectors
- Sound Reinforcement Products
- Conferencing Products
- Other Products
- Services
- Installation Services
- Maintenance Services
- IT Networking Services
- System Designing Services
- Other Services
Products lead the market with around 57.1% of market share in 2025. The products encompass a diverse range of physical goods across multiple industries. They represent the core technological technology developments that allow experts in industries such as live events, corporate settings, education, and broadcasting to offer premium audio-visual experiences. With high-definition screens and video walls, audio systems, and conferencing solutions, Pro AV products provide smooth integration, reliability, and enhanced performance. The ongoing product innovation, fueled by technological breakthroughs in areas like 4K/8K video, virtual sound, and AI-driven automation, assists enterprises and organizations to remain competitive in a rapidly technologically advanced world. As demand for superior multimedia solutions rises, the importance of these products lies in their ability to enhance communication, collaboration, and engagement, making them essential for the success of modern-day enterprises and events. Therefore, product innovation is a major driver in the growth and development of the Pro AV market.
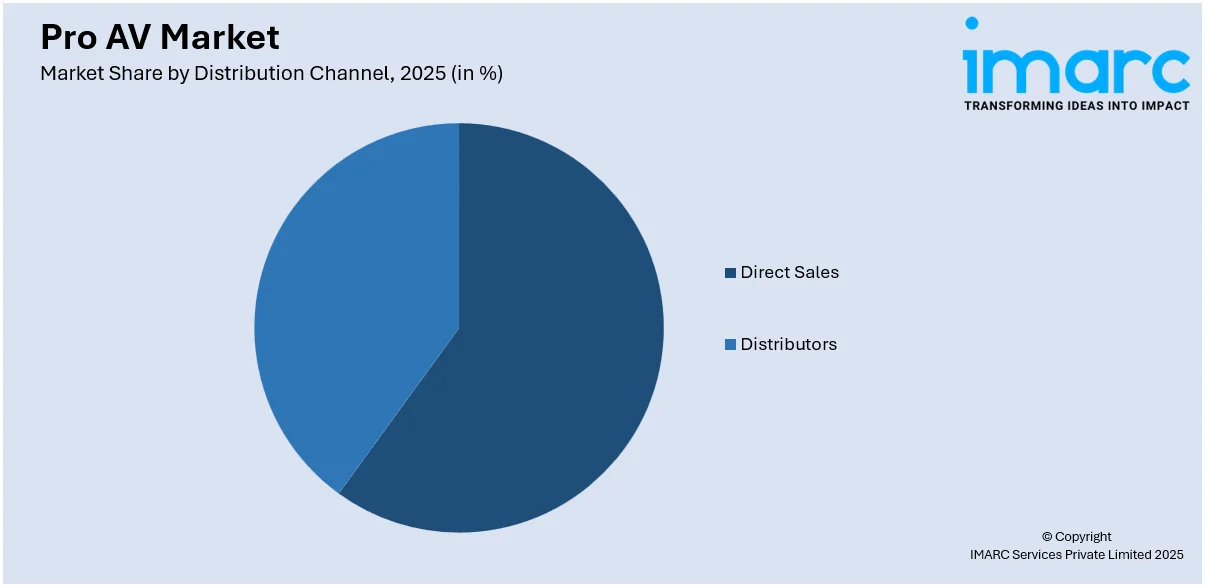
Analysis by Distribution Channel:
Access the comprehensive market breakdown Request Sample
- Direct Sales
- Distributors
Direct sales lead the market with around 38.5% of market share in 2025. Direct sales are one of the main modes of creating strong, personal relationships between manufacturers and end-users. This mode allows Pro AV businesses to provide customized solutions that meet the specific requirements of their customers, whether in a corporate environment, education, or live events. Direct sales teams have specialists who can offer in-depth product knowledge, technical support, and customizations, thus helping clients choose the optimal solutions for their precise needs. This sales method also creates trust and reliability, which are critical to high-investment products such as AV systems. It also provides more effective feedback loops, which help manufacturers learn more about market needs and change their offerings accordingly. In an increasingly changing market, direct selling continues to be critical to achieving customer satisfaction, securing high-value sales, and long-term client retention in the Pro AV business.
Analysis by Application:
- Home Use
- Commercial
- Education
- Government
- Hospitality
- Others
Education leads the market in 2025. Education is an important segment, both as a driver of demand and as a key factor in the successful implementation of AV technologies. Educational institutions are depending on Pro AV systems to make learning more efficient and there is an increasing integration of high-end audio-visual solutions in training centers, lecture halls, and classrooms. Such technologies enable multimedia presentations, remote education, and interactive learning, which are essential to engage students in the modern world of technology. Moreover, education in Pro AV provides end-users with the appropriate skills to use and maintain complex AV systems effectively. This transfer of knowledge is crucial for optimizing the potential of AV solutions, achieving best performance, and ensuring long-term success. With further integration by educational institutions, demand for Pro AV products and training services will continue to grow, further cementing the importance of education in the market’s growth and development.

Regional Analysis:
- North America
- United States
- Canada
- Asia Pacific
- China
- Japan
- India
- South Korea
- Australia
- Indonesia
- Others
- Europe
- Germany
- France
- United Kingdom
- Italy
- Spain
- Russia
- Others
- Latin America
- Brazil
- Mexico
- Others
- Middle East and Africa
In 2025, North America accounted for the largest market share of over 35.0%. North America is a dominant region for demand as well as innovation. There are some of the biggest business conglomerates, universities, and entertainment centers found within the region that are quite heavily dependent upon pro AV technology in their functionalities. Furthermore, there is an increased demand for excellent-quality AV equipment within corporate areas, live shows, and television broadcasts. North America is also at the forefront of technological innovations, with manufacturers constantly pushing the limits of audio-visual equipment, such as 4K/8K displays, immersive sound technology, and AI solutions. The established infrastructure of the region, its high disposable income, and consistent investments in smart city projects and digital transformation projects further establish it as a crucial player in the global Pro AV market. Consequently, North America continues to be an important market for product innovation, business trends, and the uptake of advanced AV technologies.
Key Regional Takeaways:
United States Pro AV Market Analysis
The United States holds a substantial share of the North America pro AV market with 83.40% in 2025. The market in the United States is experiencing significant growth due to advancements in display technology, hybrid work solutions, and digital signage expansion. The rise in immersive experiences in entertainment, education, and corporate sectors is driving investments in high-quality AV solutions. AI-powered automation and cloud-based AV services are transforming content delivery and management. The integration of AV with IoT and smart building technologies is also supporting the market. Live events, virtual collaboration, and experiential retail are among the key sectors driving adoption. The ongoing digital transformation in education and healthcare further enhances market opportunities. The expansion of e-learning and remote collaboration tools is creating sustained pro AV market demand, with significant growth expected in the online learning industry. According to reports, the online learning sector in the United States is projected to reach a staggering worth of USD 687 Billion by 2030. This rapid expansion is fueling investments in advanced AV technologies that support interactive and high-quality virtual learning experiences. Innovation in LED walls, projection mapping, and high-resolution displays is expected to drive the market forward, enhancing visual communication and audience engagement across various industries.
Europe Pro AV Market Analysis
The Europe pro AV market is experiencing significant growth due to digital transformation investments in corporate, education, retail, and entertainment sectors. Cloud-based AV solutions and AI-driven automation are improving operational efficiency and user experience. Smart meeting rooms, digital signage, and interactive displays are becoming essential for businesses. Hybrid work models are propelling the demand for advanced video conferencing and collaboration tools. The region's emphasis on sustainability is also influencing the market, with energy-efficient displays and eco-friendly AV solutions gaining traction. The increasing integration of AR/VR in training and immersive experiences is expanding the scope of Pro AV applications. Furthermore, investment in technology continues to rise, with Tech EU reporting that European tech companies raised over €74.4 Billion in 2024, highlighting the region’s commitment to digital innovation. As organizations focus on enhancing audience engagement and content delivery, the market is expected to continue its upward trajectory, supported by continuous advancements in display, audio, and automation technologies.
Asia Pacific Pro AV Market Analysis
The Asia Pacific pro AV market is experiencing rapid growth due to digital transformation initiatives in the education, corporate, retail, and entertainment sectors. The demand for high-resolution displays, interactive technologies, and cloud-based AV solutions is fueling market expansion. Hybrid work environments and online learning are increasing the need for advanced video conferencing and collaboration tools. Smart cities and IoT integration are enhancing the adoption of intelligent display and automation solutions. Moreover, large-scale investments in entertainment, gaming, and immersive experiences are also leading to a higher requirement for high-quality AV systems. Furthermore, the increasing revenue from the technology sector is positively impacting the Pro AV market. According to Invest India, the estimated revenue of India’s technology industry, including hardware, reached USD 254 Billion in FY24, marking a USD 9 Billion increase over the previous year. Advanced technologies are gaining Prominence in business and consumer applications, driving demand for innovative AV solutions. As businesses and institutions adopt next-generation technologies, the market is expected to grow significantly.
Latin America Pro AV Market Analysis
The Latin America pro AV market is expanding due to digital signage, corporate communication solutions, and immersive entertainment technologies. Businesses invest in advanced systems for customer engagement, training, and collaboration. Hybrid work, online learning, and AI-driven automation are increasing efficiency. In addition to this, digital transformation initiatives are Propelling the growth of the market. A key indicator of this trend is the expansion of the smart TV market, which is seeing robust growth in the region. According to IMARC Group, the Mexico smart TV market size reached USD 3.7 Billion in 2024 and is expected to reach USD 10.8 Billion by 2033, exhibiting a CAGR of 12.50% during 2025-2033. Furthermore, the market is experiencing a surge in demand for high-resolution displays and advanced AV solutions, indicating continued growth in various industries.
Middle East and Africa Pro AV Market Analysis
The Middle East and Africa market is growing due to increasing investments in smart infrastructure, digital transformation, and immersive entertainment experiences. Advanced display technologies, AI-powered automation, and cloud-based solutions enhance business communication and customer experiences. The demand for large-format displays, Projection mapping, and high-resolution LED technology is increasing, particularly in event management and public spaces, which is positively impacting market growth. Furthermore, the growing focus on smart cities and connected environments is driving the adoption of innovative AV solutions. Notably, the display market in Saudi Arabia reached USD 1,590.8 Million in 2024, and according to IMARC Group, it is expected to grow to USD 2,141.8 Million by 2033 at a CAGR of 3.36% during 2025-2033. This growth reflects the expanding role of display technologies in various applications across the region.
Competitive Landscape:
The leading players in the market are heavily investing in research and development (R&D) activities to introduce cutting-edge pro AV technologies. This includes advancements in display technology, audio systems, and control solutions. They aim to stay ahead of the competition by offering Products that Provide superior performance, energy efficiency, and innovative features. In addition to this, several key players are expanding their presence globally by establishing partnerships, distribution networks, and subsidiaries in emerging markets. This strategy allows them to tap into the growing demand for AV solutions in regions, such as Asia Pacific, Latin America, and the Middle East. Furthermore, companies are offering customizable solutions and integration services. Businesses work closely with clients to design and implement AV systems tailored to their unique requirements, ensuring seamless integration with existing infrastructure.
The report Provides a comprehensive analysis of the competitive landscape in the pro AV market with detailed Profiles of all major companies, including:
- Anixter International Inc. (Wesco International Inc.)
- AVI Systems Inc.
- AVI-SPL Inc.
- Biamp Systems LLC
- CCS Presentation Systems LLC
- Ford Audio-Video Systems LLC
- New ERA Technology Inc.
- Professional Audio-Visual Ltd.
- Solutionz Inc
- Telerent Leasing Corp. (ITOCHU International Inc.)
- Vistacom Inc.
Latest News and Developments:
- January 2024: Wesco Anixter launched its subscription-based Conference Room as a Service globally at ISE Barcelona. Designed for hybrid workforces, it offers flexible AV solutions with remote monitoring and 24/7 support. The service enables seamless collaboration, helping businesses scale their technology needs efficiently while managing capital expenditures.
- June 2024: AVI Systems introduced its Enterprise Service Management Program, offering flexible, cost-effective AV support for large organizations. The Program includes three service tiers, Lite, Plus, and Ultimate, each Providing varying levels of incident support, service requests, and field dispatch calls. Featuring ITIL-driven workflows and ServiceNow integration, the Program ensures rapid AV issue resolution.
- June 2024: Biamp unveiled eight new Products and updates at InfoComm 2024, including the Biamp Workplace cloud-based platform for AV monitoring, Community R.15-3696 and CCA-80 loudspeakers for large spaces, and the Parlé VBC 2800 conferencing bar with upgraded camera optics. Other additions include the Vidi 280 ePTZ camera and Voltera D M series amplified loudspeaker controllers with integrated DSP.
- December 2024: CCS Presentation Systems expanded to Wisconsin, opening a new office in La Crosse through a strategic partnership with Eric and Kristi Pederson. With a strong background in education-focused technology integration, the Pedersons will help CCS serve K-12 schools, higher education, enterprises, healthcare, and hospitality across Wisconsin, Minnesota, and Northern Illinois.
- September 2024: The RUCKUS Pro AV portfolio, a specialized set of wired and wireless networking technologies designed for professional AV installations, was introduced by CommScope. Leading AV standards including NDI, DANTE, QSYS, AES65, Crestron, and SONOS are supported by the portfolio, which also includes enterprise-class ICX switches, cloud-based remote management, and Wi-Fi 6 and 7 access points (APs).
Pro AV Market Report Scope:
| Report Features | Details |
|---|---|
| Base Year of the Analysis | 2025 |
| Historical Period | 2020-2025 |
| Forecast Period | 2026-2034 |
| Units | Billion USD |
| Scope of the Report |
Exploration of Historical Trends and Market Outlook, Industry Catalysts and Challenges, Segment-Wise Historical and Future Market Assessment:
|
| Solutions Covered |
|
| Distribution Channels Covered | Direct Sales, Distributors |
| Applications Covered | Home Use, Commercial, Education, Government, Hospitality, Others |
| Regions Covered | Asia Pacific, Europe, North America, Latin America, Middle East and Africa |
| Countries Covered | United States, Canada, Germany, France, United Kingdom, Italy, Spain, Russia, China, Japan, India, South Korea, Australia, Indonesia, Brazil, Mexico |
| Companies Covered | Anixter International Inc. (Wesco International Inc.), AVI Systems Inc., AVI-SPL Inc., Biamp Systems LLC, CCS Presentation Systems LLC, Ford Audio-Video Systems LLC, New ERA Technology Inc., Professional Audio Visual Ltd., Solutionz Inc., Telerent Leasing Corp. (ITOCHU International Inc.), Vistacom Inc., etc. |
| Customization Scope | 10% Free Customization |
| Post-Sale Analyst Support | 10-12 Weeks |
| Delivery Format | PDF and Excel through Email (We can also provide the editable version of the report in PPT/Word format on special request) |
Key Benefits for Stakeholders:
- IMARC’s report offers a comprehensive quantitative analysis of various market segments, historical and current market trends, market forecasts, and dynamics of the pro AV market from 2020-2034.
- The pro AV market research report provides the latest information on the market drivers, challenges, and opportunities in the global market.
- The study maps the leading, as well as the fastest-growing, regional markets. It further enables stakeholders to identify the key country-level markets within each region.
- Porter's five forces analysis assist stakeholders in assessing the impact of new entrants, competitive rivalry, supplier power, buyer power, and the threat of substitution. It helps stakeholders to analyze the level of competition within the pro AV industry and its attractiveness.
- Competitive landscape allows stakeholders to understand their competitive environment and provides an insight into the current positions of key players in the market.
Frequently Asked Questions About the Pro Av Market Report
The pro AV market was valued at USD 3.2 Billion in 2025.
The pro AV market is projected to exhibit a CAGR of 3.97% during 2026-2034, reaching a value of USD 4.6 Billion by 2034.
The market is driven by the increasing demand for immersive experiences in corporate, education, and entertainment sectors. In addition to this, continual technological advancements in audiovisual equipment, the growing adoption of 4K and 8K resolution, and the rise of hybrid work models enhance the need for advanced audio-visual solutions are major factors Propelling market growth.
North America currently dominates the pro AV market, accounting for a share of 35.0% in 2025. The dominance is fueled by the region’s advanced infrastructure, high adoption of cutting-edge audiovisual technologies in corporate and entertainment sectors, and significant investments in smart building and digital signage solutions.
Some of the major players in the pro AV market include Anixter International Inc. (Wesco International Inc.), AVI Systems Inc., AVI-SPL Inc., Biamp Systems LLC, CCS Presentation Systems LLC, Ford Audio-Video Systems LLC, New ERA Technology Inc., Professional Audio Visual Ltd., Solutionz Inc., Telerent Leasing Corp. (ITOCHU International Inc.), and Vistacom Inc., among others.
Need more help?
- Speak to our experienced analysts for insights on the current market scenarios.
- Include additional segments and countries to customize the report as per your requirement.
- Gain an unparalleled competitive advantage in your domain by understanding how to utilize the report and positively impacting your operations and revenue.
- For further assistance, please connect with our analysts.
 Request Customization
 Speak to an Analyst
 Request Brochure
 Inquire Before Buying
Benefits of Customization
- Personalize this research
- Triangulate with your data
- Get data as per your format and definition
- Gain a deeper dive into a specific application, geography, customer, or competitor
- Any level of personalization
Get in Touch With Us
UNITED STATES
Phone: +1-201-971-6302
INDIA
Phone: +91-120-433-0800
UNITED KINGDOM
Phone: +44-753-714-6104
Email: [email protected]
Client Testimonials


.webp)


