
Rare Earth Elements Market Size, Share, Trends and Forecast by Application and Region, 2026-2034
Global Rare Earth Elements Market Size, Share, Trends & Forecast (2026-2034)
The global rare earth elements market size was valued at USD 14.03 Billion in 2025 and is projected to reach USD 41.15 Billion by 2034, exhibiting a CAGR of 12.32% during the forecast period 2026-2034. Surging demand for permanent magnets in EVs and wind turbines, expanding defense applications, rising consumer electronics consumption, tightening Western supply security mandates, and clean-energy build-out are driving the rare earth elements market growth. Magnets lead the application segment at 31.2% in 2025, while China dominates regional supply at 58.3%.
Market Snapshot
|
Metric |
Value |
|
Market Size (2025) |
USD 14.03 Billion |
|
Forecast Market Size (2034) |
USD 41.15 Billion |
|
CAGR (2026-2034) |
12.32% |
|
Base Year |
2025 |
|
Historical Period |
2020-2025 |
|
Forecast Period |
2026-2034 |
|
Largest Region |
China (58.3% share, 2025) |
|
Fastest Growing Region |
China (CAGR ~13.1%) |
|
Leading Application |
Magnets (31.2%, 2025) |
The global rare earth elements market growth trajectory from 2020 through 2034 reflects a steady historical expansion from USD 7.85 Billion to USD 14.03 Billion, followed by an accelerating forecast curve powered by EV magnet demand, wind power build-out, and Western supply chain investment.
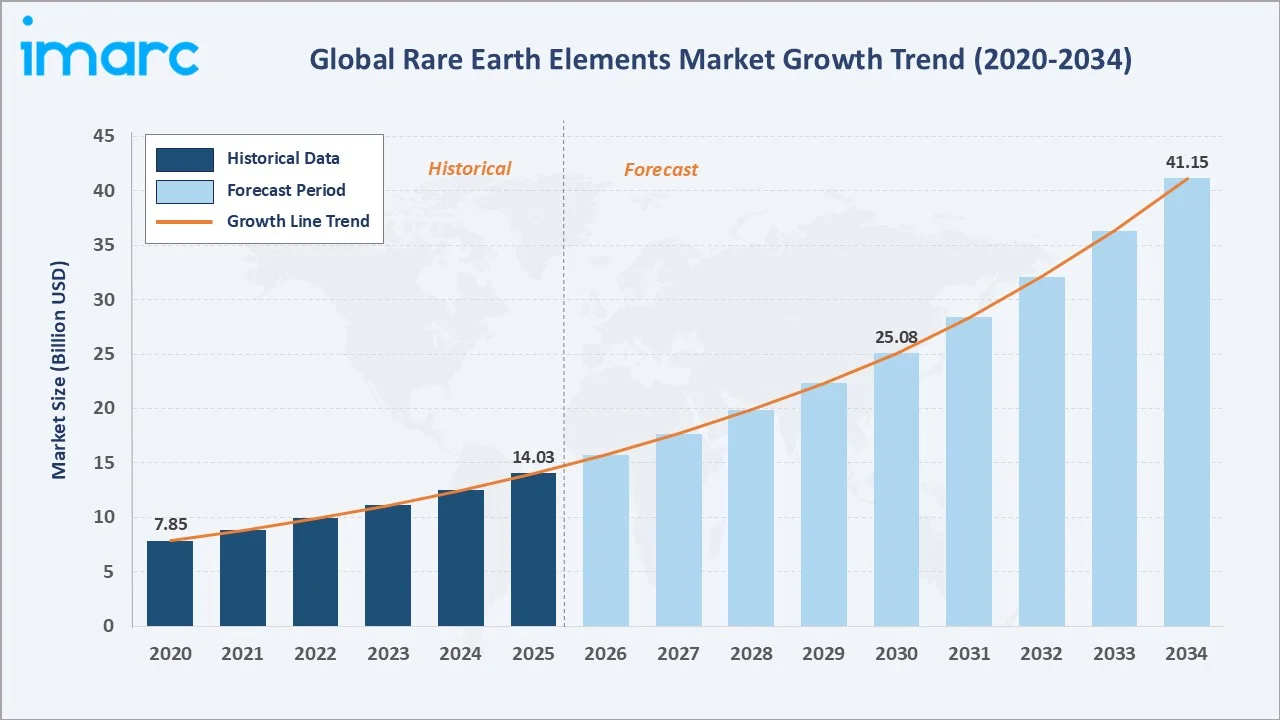
To get more information on this market, Request Sample
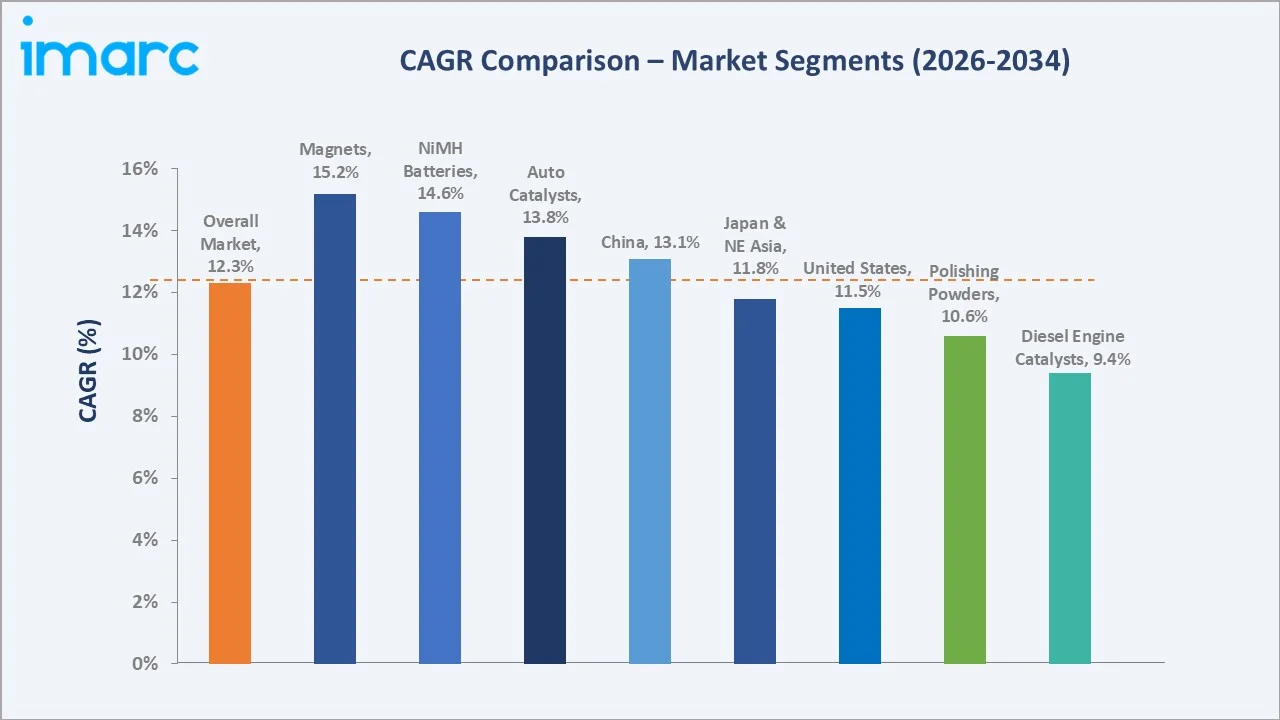
Segment-level CAGR comparisons highlight permanent magnets and NiMH batteries as two of the fastest-growing application sub-categories within the global rare earth elements industry analysis through 2034.
Executive Summary
The global rare earth elements market is undergoing structural realignment, fuelled by the convergence of clean-energy electrification, defense reindustrialisation, and Western supply chain diversification. Valued at USD 14.03 Billion in 2025, the market is forecast to reach USD 41.15 Billion by 2034 at a CAGR of 12.32%. Global rare earth oxide production reached approximately 390,000 metric tons in 2024, signalling that supply is scaling to meet rapid downstream demand growth from EVs, wind power, and high-performance electronics.
Magnets command the dominant application share at 31.2% in 2025, supported by EV traction motors, wind turbine generators, and consumer electronics miniaturisation. Auto Catalysts follow at 16.4% with sustained demand from gasoline-engine emissions controls. Polishing Powders hold 11.8%, anchored by display-glass and semiconductor wafer manufacturing.
China dominates with a 58.3% global production share in 2025, led by integrated mining, separation, and magnet manufacturing capacity in Inner Mongolia and Sichuan, alongside vertically integrated state players such as China Northern Rare Earth and Shenghe Resources. Japan & Northeast Asia hold 24.6%, anchored by Japan’s magnet manufacturing and Korea’s electronics assembly. The United States holds 17.1%, with MP Materials, Energy Fuels, and Lynas pivoting toward domestic mine-to-magnet integration under DPA funding.
Key Market Insights
|
Insight |
Data |
|
Largest Application |
Magnets – 31.2% share (2025) |
|
Second Application |
Auto Catalysts – 16.4% share (2025) |
|
Leading Region |
China – 58.3% production share (2025) |
|
Second Region |
Japan & Northeast Asia – 24.6% share (2025) |
|
Top Companies |
Northern Rare Earth, Lynas Rare Earths Ltd, MP Materials, Shenghe Resources Holding Co., Iluka Resources Limited, JL MAG Rare-Earth Co., Ltd., Energy Fuels Inc., NEO, Arafura Rare Earths, and Hastings Technology Metals Limited |
Key Analytical Observations Supporting the Above Data:
- Magnets’ 31.2% dominance in 2025 reflects EV traction motor demand, wind turbine generator growth, and consumer electronics miniaturisation underpinning rare earth demand globally.
- Auto Catalysts at 16.4% in 2025 are driven by stringent gasoline-engine emissions standards and continued ICE production through 2030, particularly in emerging markets where catalyst-grade cerium and lanthanum demand remains structural.
- China’s 58.3% global dominance in 2025 reflects integrated mine-to-magnet capacity in Inner Mongolia and Sichuan, combined with state-driven export controls on processing technology and downstream policy support.
Global Rare Earth Elements Market Overview
Rare earth elements (REEs) are a group of seventeen metallic elements (the lanthanide series plus scandium and yttrium) that exhibit unique magnetic, optical, and catalytic properties. They are essential inputs to permanent magnets, fluorescent phosphors, polishing compounds, glass additives, NiMH batteries, and a wide range of catalysts used across automotive and petroleum refining applications.
Applications span the full clean-energy and high-tech sector: electric vehicle traction motors, wind turbine generators, smartphones, defense radar and missile guidance, oil refining catalysts, fibre optics, and medical imaging, with adjacencies into laser systems, hydrogen storage alloys, and superconductor research.
Macroeconomic enablers include global EV sales topping 17 million units in 2024 (with combined wind power capacity additions exceeding 117 GW in 2024), accelerating Western supply chain diversification investment, and rising defense procurement budgets across the US, EU, and Japan, supporting structural REE demand.
Market Dynamics
To evaluate market opportunities, Request Sample
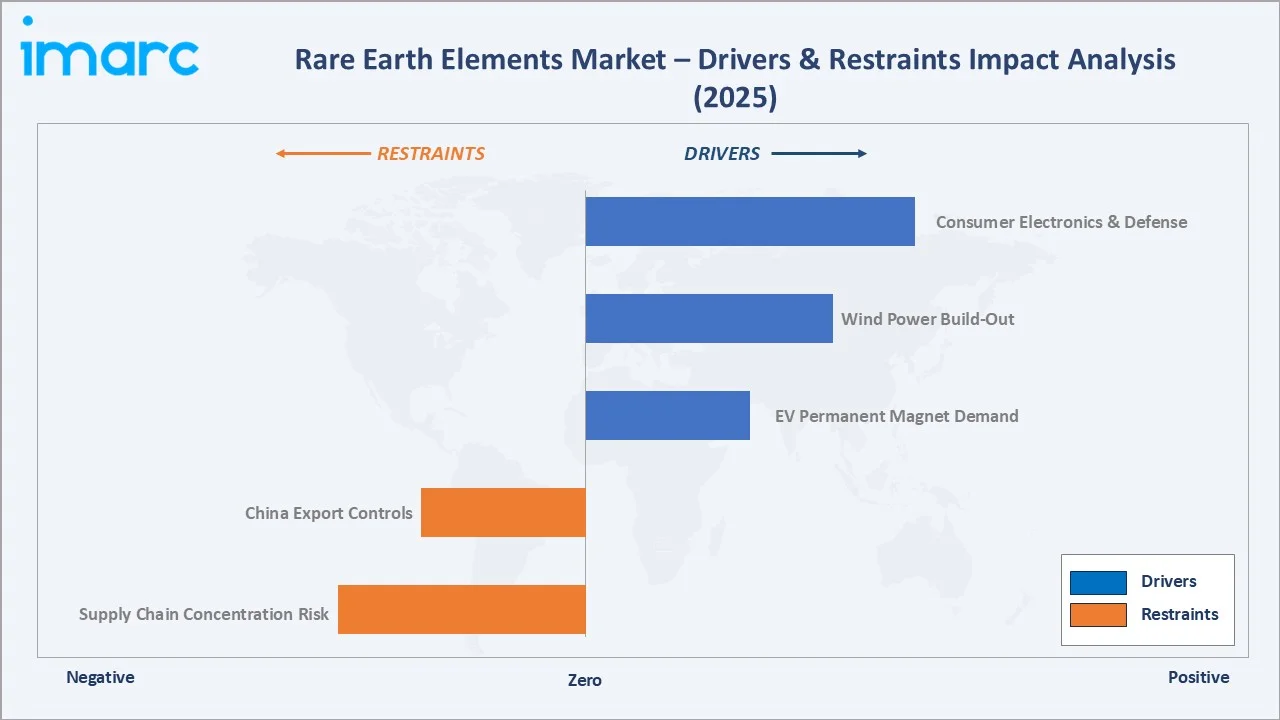
Market Drivers
- EV Permanent Magnet Demand: Global EV sales reached 17 million units in 2024, which is the most powerful structural driver for sustained rare earth demand. Each EV traction motor consumes roughly 1-2 kg of NdFeB magnet material, with neodymium, praseodymium, dysprosium, and terbium content scaling directly with EV penetration through 2034.
- Wind Power Build-Out: Offshore wind turbines use 600-1,000 kg of permanent magnets per MW of installed capacity. Global wind power capacity additions exceeded 117 GW in 2024, with offshore growth concentrated in Europe and China driving sustained NdFeB and dysprosium demand through the forecast period.
- Consumer Electronics & Defense Applications: Smartphones, hard drives, laser systems, and defense electronics consume rare earth phosphors, magnets, and specialty alloys at scale. Defense procurement budgets across the US, EU, and Japan have expanded materially since 2024.
Market Restraints
- China Export Controls: Beijing’s 2023-2024 export restrictions on gallium, germanium, and rare earth processing technology have tightened global supply visibility, with downstream buyers facing pricing volatility and contract reformulation pressure across multiple end markets.
- Supply Chain Concentration Risk: Roughly 85-90% of global rare earth refining and magnet manufacturing remains concentrated in China, leaving Western OEMs structurally exposed to single-country supply disruption and geopolitical escalation risks.
Market Opportunities
- Western Mine-to-Magnet Integration: US Defense Production Act funding and EU Critical Raw Materials Act support are catalysing domestic supply chains. MP Materials, Lynas, and Iluka are building integrated separation and magnet capacity outside China through 2027.
- Rare Earth Recycling and Urban Mining: Recycling end-of-life NdFeB magnets, NiMH batteries, and phosphors offers a structural supply complement. For example, Solvay has partnered with Cyclic Materials to establish a circular rare earth supply chain, where recycled materials from end-of-life permanent magnets are processed into mixed rare earth oxides and supplied to Solvay’s La Rochelle facility in France for separation and reintegration into automotive, wind energy, and electronics applications.
- Substitution & Material Innovation: Alternative magnet chemistries (ferrite, samarium-cobalt) and reduced-rare-earth motor designs are being commercialised. These reduce structural exposure to dysprosium and terbium volatility while preserving performance for non-traction applications.
Market Challenges
- Environmental and Permitting Friction: Rare earth mining and separation generate radioactive thorium and uranium tailings, complicating environmental permitting in Western jurisdictions and slowing greenfield project timelines by 5-7 years on average.
- Price Volatility and Tokenomics Risk: Rare earth oxide prices (especially neodymium, dysprosium, terbium) have shown 2-3x annual swings since 2020, complicating long-term offtake contract negotiations and OEM cost forecasting throughout the supply chain.
Emerging Market Trends
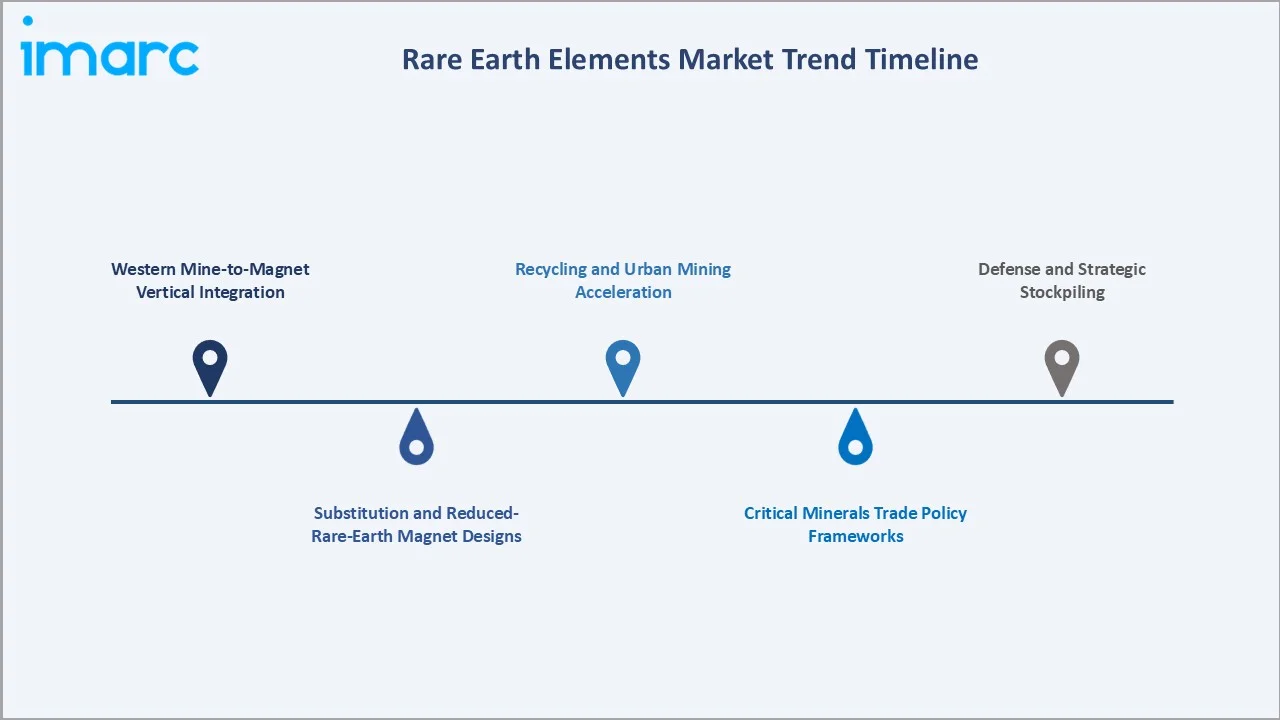
1. Western Mine-to-Magnet Vertical Integration
The industry is transitioning from China-centric processing to vertically integrated Western supply chains. MP Materials in California, Lynas in Australia and the US, and Iluka in Australia are commissioning separation and magnet capacity through 2027, supported by DPA and EU CRMA funding.
2. Recycling and Urban Mining Acceleration
End-of-life NdFeB magnet recycling is scaling rapidly, with players such as Solvay, REEcycle, and Geomega Resources building commercial-scale circular supply chains to reduce dependence on primary mining and offer 30-50% lower carbon-intensity rare earth oxide.
3. Defense and Strategic Stockpiling
The US Defense Logistics Agency and allied defense ministries are expanding rare earth strategic stockpiles. US National Defense Stockpile rare earth holdings expanded materially through 2023-2024.
4. Substitution and Reduced-Rare-Earth Magnet Designs
Tesla’s 2023 announcement of a permanent-magnet motor without heavy rare earths set a precedent for substitution research across the auto industry. Reduced-dysprosium and reduced-terbium magnet chemistries are projected to capture a meaningful share of new EV motor designs by 2030.
5. Critical Minerals Trade Policy Frameworks
The US Inflation Reduction Act, EU Critical Raw Materials Act, and Japan-Australia critical minerals partnership are reshaping global rare earth trade flows, supporting non-China supply chains and incentivising allied mining and processing investment.
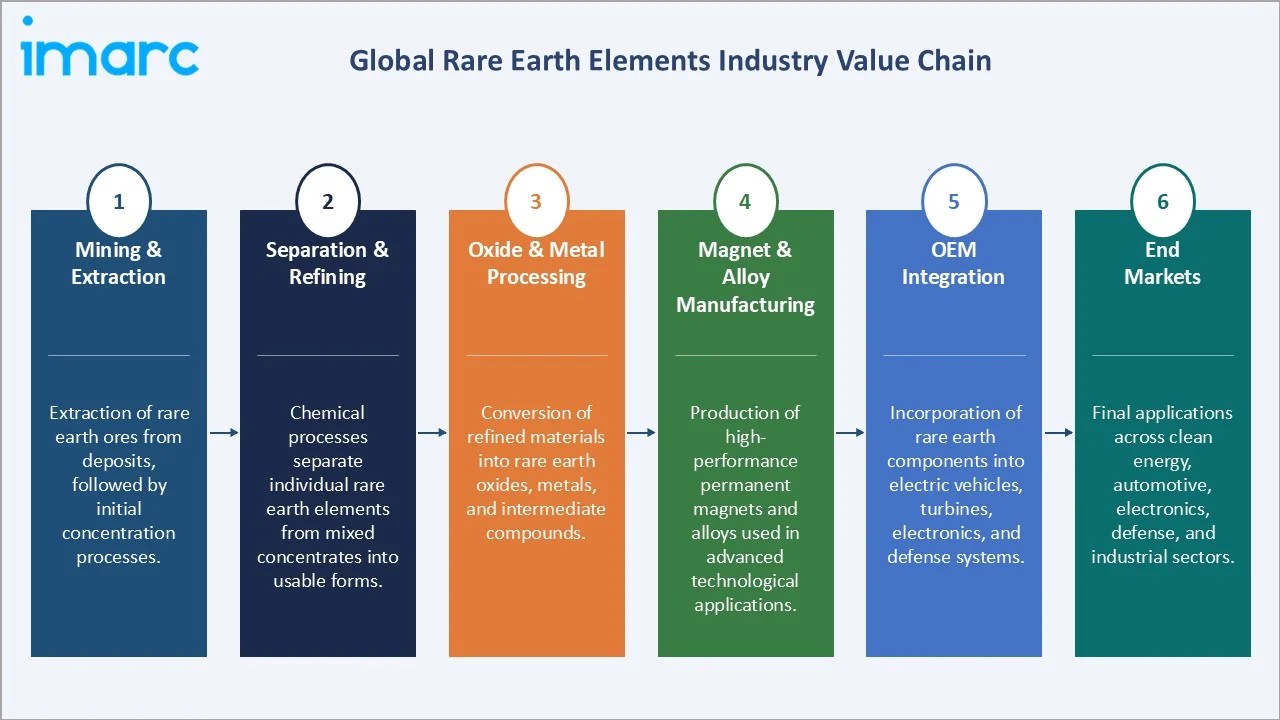
Industry Value Chain Analysis
The rare earth elements value chain spans six integrated stages from mining and extraction through end-use markets. Each stage exhibits distinct margin profiles, with separation, refining, and magnet manufacturing capturing the largest share of unit economics globally.
|
Stage |
Key Players / Examples |
|
Mining & Extraction |
Extraction of rare earth ores from deposits, followed by initial concentration processes. |
|
Separation & Refining |
Chemical processes separate individual rare earth elements from mixed concentrates into usable forms. |
|
Oxide & Metal Processing |
Conversion of refined materials into rare earth oxides, metals, and intermediate compounds. |
|
Magnet & Alloy Manufacturing |
Production of high-performance permanent magnets and alloys used in advanced technological applications. |
|
OEM Integration |
Incorporation of rare earth components into electric vehicles, turbines, electronics, and defense systems. |
|
End Markets |
Final applications across clean energy, automotive, electronics, defense, and industrial sectors. |
Separation, refining, and magnet manufacturing occupy the highest strategic value position in the rare earth value chain, integrating mined concentrate, chemical separation, and metallurgical conversion into magnet-grade output. China retains roughly 85-90% of global magnet manufacturing capacity, the most contested chokepoint in the chain.
Technology Landscape in the Rare Earth Elements Industry
Mining and Extraction Technologies
Modern rare earth mining relies on hard-rock open-pit and ion-adsorption clay extraction methods. In 2024, MP Materials, Lynas Mt Weld, and Bayan Obo collectively accounted for a significant share of global rare earth oxide production, with extraction efficiencies improving through updated flotation circuits and advanced ore-sorting across major operations.
Separation and Refining Innovation
Solvent extraction remains the dominant separation technology, but ion-exchange and membrane-based separation are gaining traction. Energy Fuels and Solvay are commercialising new lower-emissions separation flowsheets that meaningfully reduce reagent consumption and waste-water volumes versus legacy Chinese refining benchmarks.
Magnet Manufacturing and Performance Engineering
NdFeB sintered magnets dominate the high-performance segment, with grain-boundary diffusion processes enabling reduced dysprosium and terbium content while maintaining coercivity. Recycling-derived magnet feedstock is forecast to support over 10% of supply by 2030, lowering dependence on primary mining and supply concentration risk.
Market Segmentation Analysis
The report includes following segments:
|
Segment Category |
Leading Segment |
Market Share |
Year |
|
Application |
Magnets |
31.2% |
2025 |
|
Region |
China |
58.3% |
2025 |

By Application
Magnets command a 31.2% majority share in 2025, the largest of any application, supported by EV traction motors, wind turbine generators, and miniaturised consumer electronics. NdFeB sintered magnets sustain the highest unit-value rare earth demand globally, with neodymium and praseodymium content driving premium pricing across the segment.
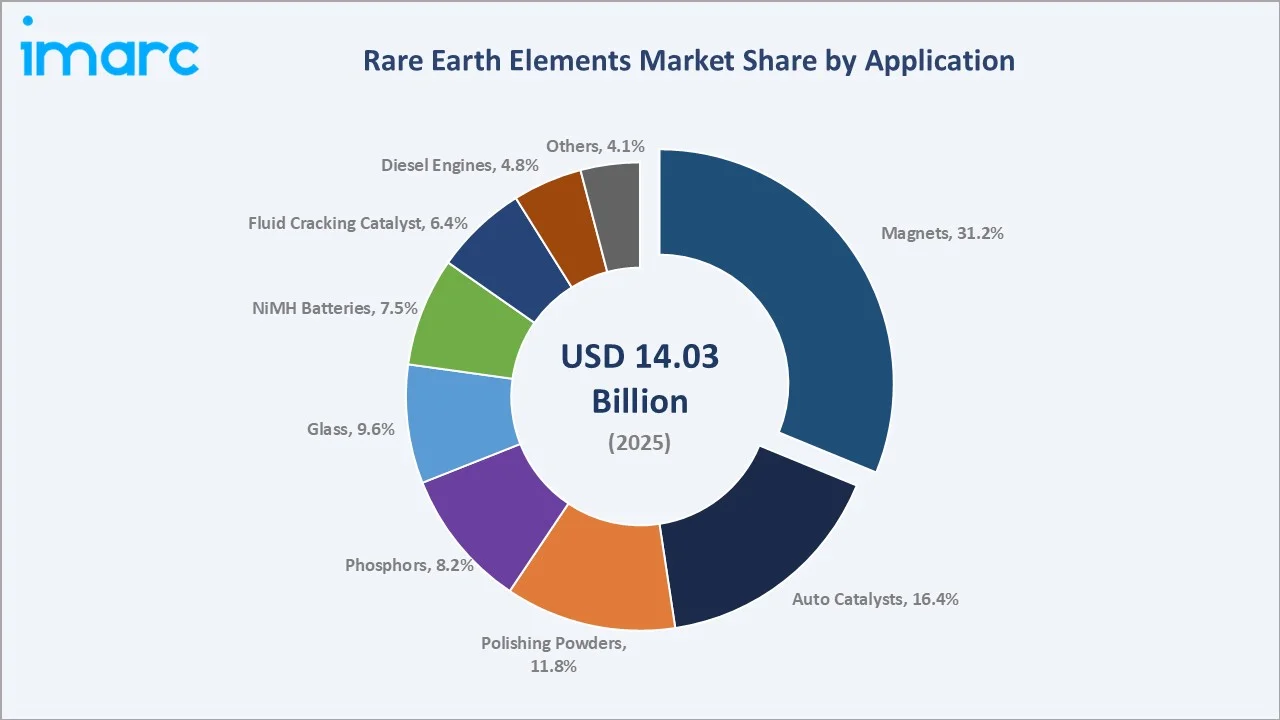
To access detailed market analysis, Request Sample
Auto Catalysts at 16.4% in 2025 are driven by gasoline-engine emissions controls, where cerium and lanthanum support catalytic converter performance. Polishing Powders hold 11.8%, anchored by display-glass and semiconductor wafer manufacturing. Glass at 9.6%, Phosphors at 8.2%, and NiMH Batteries at 7.5% round out the top six application categories globally.
Regional Market Insights
|
Region |
Share (2025) |
Key Growth Drivers |
|
China |
58.3% |
Bayan Obo and Sichuan integrated production, state-driven magnet capacity, and export control leverage. |
|
Japan & Northeast Asia |
24.6% |
Japan magnet manufacturing (Hitachi/Proterial, TDK), Korea electronics assembly, Taiwan semiconductor demand. |
|
United States |
17.1% |
MP Materials Mountain Pass mine, Defense Production Act funding, Energy Fuels separation capacity. |
China commands a 58.3% global revenue share in 2025, the most dominant regional position in the rare earth elements market. Inner Mongolia and Sichuan provinces concentrate integrated mining, separation, and magnet capacity, with Bayan Obo alone accounting for over 40% of global rare earth oxide production, alongside state-driven players such as China Northern Rare Earth, Shenghe Resources, and JL Mag commanding deep vertical integration.
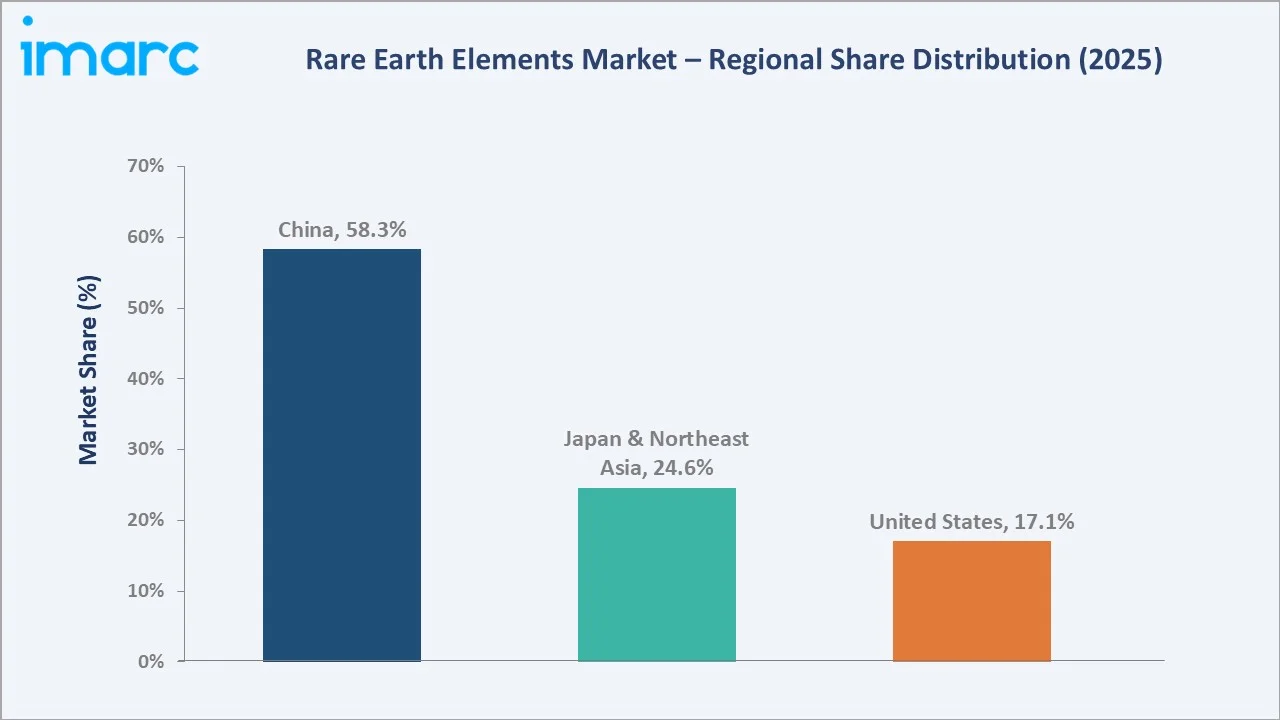
Japan & Northeast Asia at 24.6% in 2025 is anchored by Japan’s magnet manufacturing leadership through Hitachi Metals (Proterial) and TDK, alongside Korea’s electronics and EV assembly. Japan Oil, Gas and Metals National Corporation (JOGMEC) has made significant long-term investments in rare earth supply diversification since 2010, backing non-China rare earth projects to reduce supply concentration. The United States at 17.1%, benefits from MP Materials’ Mountain Pass mine, Energy Fuels separation capacity, and DPA funding for domestic mine-to-magnet integration.
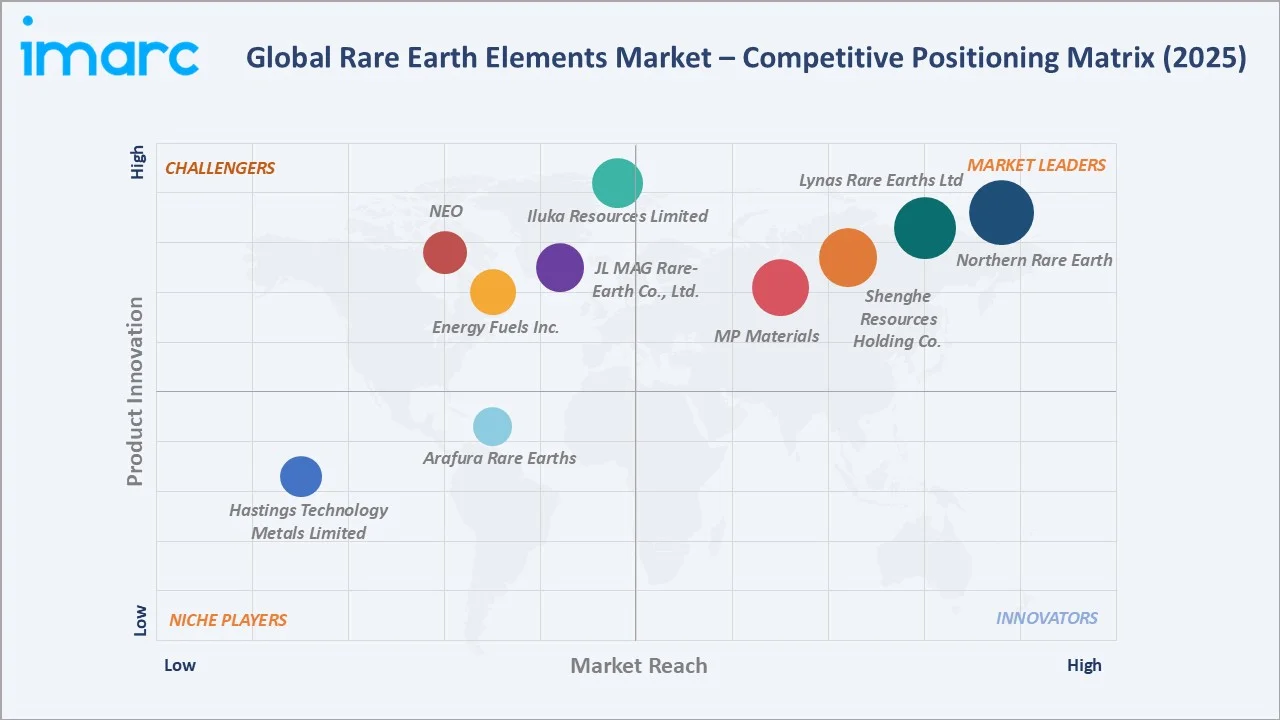
Competitive Landscape
|
Company Name |
Market Position |
Core Strength |
|
Northern Rare Earth |
Leader |
Bayan Obo concentrate access, integrated separation and magnet, state backing |
|
Lynas Rare Earths Ltd |
Leader |
Largest non-China producer, Malaysia separation, US Texas magnet site |
|
MP Materials |
Leader |
US-domestic mine, Texas magnet plant, DPA-backed integrated supply |
|
Shenghe Resources Holding Co. |
Leader |
Sichuan integrated processing, MP Materials offtake relationship |
|
Iluka Resources Limited |
Challenger |
Australian government-backed Eneabba refinery, by-product monazite |
|
JL MAG Rare-Earth Co., Ltd. |
Challenger |
Leading Chinese magnet maker, EV and wind turbine OEM relationships |
|
Energy Fuels Inc. |
Challenger |
US monazite processing, uranium-by-product economics, REE separation capacity |
|
NEO |
Challenger |
Estonia separation facility, magnet-grade alloys, North America presence |
|
Arafura Rare Earths |
Emerging |
Australian Nolans deposit, integrated mine-to-oxide development pipeline |
|
Hastings Technology Metals Limited |
Emerging |
Yangibana NdPr-rich deposit, Western Australia development |
The rare earth elements competitive landscape features a small number of vertically integrated state and corporate leaders commanding deep mining and processing scale, alongside Western challengers building greenfield separation and magnet capacity, and emerging Australian, African, and Brazilian developers.
Key Company Profiles
Lynas Rare Earth Ltd.
Lynas Rare Earths is the largest non-China producer of separated rare earth oxides globally, operating the Mt Weld mine in Western Australia and integrated separation facilities in Malaysia and Texas.
- Product & Platform Portfolio: NdPr oxide, dysprosium oxide, terbium oxide, lanthanum carbonate, mixed cerium products.
- Recent Developments: In April 2026, the U.S. Department of Defense partnered with Lynas to begin heavy rare earth processing in Malaysia, the first time in three decades that heavy rare earths have been separated outside China.
- Strategic Focus: Lynas is pursuing a fully vertically integrated rare earth strategy spanning concentrate mining, light and heavy separation, oxide processing, and magnet feedstock supply. The company prioritises long-term offtake agreements with EV, wind, and defense OEMs.
MP Materials
MP Materials operates the Mountain Pass mine in California, the only integrated rare earth concentrate-to-magnet facility in the United States, with downstream magnet manufacturing capacity under construction in Texas.
- Product & Platform Portfolio: Mountain Pass concentrate, separated NdPr oxide, NdFeB magnet alloys (under construction), recycled magnet feedstock.
- Recent Developments: In April 2026, Wedbush initiated coverage on MP Materials with an Outperform rating and a $90 price target, spotlighting its vertically integrated U.S. rare earth mine-to-magnet platform.
- Strategic Focus: MP Materials’ strategy centers on building the only fully integrated US mine-to-magnet rare earth supply chain. The company has secured offtake agreements with General Motors and Department of Defense funding under the Defense Production Act framework.
Iluka Resources Limited
Iluka Resources is an Australian heavy mineral sands producer pivoting into rare earth separation, supported by an Australian government USD 1.65 Billion non-recourse loan for its Eneabba refinery.
- Product & Platform Portfolio: Heavy mineral sands (zircon, rutile), monazite by-product feed, separated NdPr/Dy/Tb oxides (under construction).
- Recent Developments: In 2024-2025, Iluka progressed construction of its Eneabba fully integrated rare earth refinery, expected to commission in late 2027, processing both monazite stockpiles and third-party concentrate feed for separated heavy and light oxides.
- Strategic Focus: Iluka’s strategy combines its established mineral sands operations with a government-backed pivot into rare earth separation. The company prioritises allied-supply offtake markets across Japan, Korea, Europe, and the US for its non-China refinery output.
Market Concentration Analysis
The global rare earth elements market exhibits high concentration at the production tier, with Chinese players (Northern Rare Earth, Shenghe Resources, JL Mag) plus Lynas and MP Materials collectively accounting for over 70% of global rare earth oxide output and magnet capacity in 2025.
The market is structurally fragmented at the junior-explorer tier, with over 200 active rare earth exploration and development projects globally as of 2024. Fragmentation is most pronounced in Australia, Canada, Brazil, and Africa, where greenfield projects compete for offtake agreements and government funding.
Consolidation is accelerating around three vectors: Chinese state players acquiring rare earth juniors, Western OEMs and defense ministries securing equity stakes in allied projects, and integrated platform leaders acquiring complementary processing IP. The top 10 producers are projected to capture over 80% of global market value by 2030.
Investment & Growth Opportunities
Fastest-Growing Segments
Magnets and NiMH Batteries are the highest-growth combination segment. Permanent-magnet rare earths benefit from EV and wind turbine demand, while NiMH batteries continue to anchor hybrid-vehicle drivetrains across Toyota, Honda, and other Japanese OEM platforms.
Emerging Market Expansion
Australia, Canada, and Brazil represent the highest-velocity supply expansion regions, supported by government critical-minerals funding, allied offtake agreements, and tier-1 mining infrastructure. Combined, these regions are forecast to add substantial cumulative rare earth supply value through 2034.
Venture & Private Investment Trends
The notable transactions include Lynas’ expanded DoD-funded Texas facility, MP Materials’ GM offtake agreement, and the emergence of dedicated critical-minerals private equity funds. Western rare earth projects attracted significant government and private investment in 2024, including a USD 3.5 billion US–Australia funding initiative supporting critical minerals and rare earth supply chain development.
Future Market Outlook (2026-2034)
The global rare earth elements market forecast projects steady value expansion from USD 14.03 Billion in 2025 to USD 41.15 Billion by 2034 at a CAGR of 12.32%, a significant increase over nine years, underpinned by EV magnet demand, wind power build-out, and Western supply chain investment.
Three structural discontinuities will reshape the market through 2034. Western mine-to-magnet capacity will reduce China supply concentration from 85-90% toward roughly 65-70% by 2030. Recycling will scale from under 2% to over 10% of supply. Reduced-rare-earth motor designs will moderate dysprosium and terbium demand growth.
By 2034, the rare earth elements industry is forecast to have completed its transformation from a China-centric supply chain into a multipolar, allied-economy industrial base. The competitive landscape will be shaped by integrated state players (China Northern REE, Shenghe), Western mine-to-magnet leaders (Lynas, MP Materials), and emerging Australian and African producers.
Research Methodology
Primary Research
Primary research encompassed structured interviews conducted in 2024-2025 with rare earth stakeholders, including mining and processing executives, magnet manufacturers, OEM procurement leads, defense ministry officials, junior exploration management, and institutional investors in critical-minerals projects. Primary insights validated market sizing, segmentation, and competitive positioning.
Secondary Research
Secondary sources include USGS Mineral Commodity Summaries, IEA Critical Minerals reports, Adamas Intelligence analytics, S&P Global Market Intelligence, JOGMEC publications, US Department of Defense announcements, EU Critical Raw Materials Act documentation, and trade coverage from Reuters, Bloomberg, and Argus.
Forecasting Models
Market size estimations and growth projections were derived using a combination of top-down and bottom-up forecasting models, incorporating EV penetration trajectories, wind capacity additions, magnet content per unit, and rare earth oxide pricing curves. Scenario analysis (base, optimistic, conservative) accounted for trade-policy and price-volatility risk.
Rare Earth Elements Market Report Scope:
| Report Features | Details |
|---|---|
| Base Year of the Analysis | 2025 |
| Historical Period | 2020-2025 |
| Forecast Period | 2026-2034 |
| Units | 000’ Metric Tons, Billion USD |
| Scope of the Report |
Exploration of Historical Trends and Market Outlook, Industry Catalysts and Challenges, Segment-Wise Historical and Future Market Assessment:
|
| Applications Covered | Magnets, NiMH Batteries, Auto Catalysts, Diesel Engines, Fluid Cracking Catalyst, Phosphers, Glass, Polishing Powders, Others |
| Regions Covered | China, Japan & Northeast Asia, United States |
| Companies Covered | Northern Rare Earth, Lynas Rare Earths Ltd, MP Materials, Shenghe Resources Holding Co., Iluka Resources Limited, JL MAG Rare-Earth Co., Ltd., Energy Fuels Inc., NEO, Arafura Rare Earths, Hastings Technology Metals Limited, etc. |
| Customization Scope | 10% Free Customization |
| Post-Sale Analyst Support | 10-12 Weeks |
| Delivery Format | PDF and Excel through Email (We can also provide the editable version of the report in PPT/Word format on special request) |
Key Benefits for Stakeholders:
- IMARC’s report offers a comprehensive quantitative analysis of various market segments, historical and current market trends, market forecasts, and dynamics of the rare earth elements market from 2020-2034.
- The research study provides the latest information on the market drivers, challenges, and opportunities in the global rare earth elements market.
- The study maps the leading, as well as the fastest-growing, regional markets. It further enables stakeholders to identify the key country-level markets within each region.
- Porter's Five Forces analysis assists stakeholders in assessing the impact of new entrants, competitive rivalry, supplier power, buyer power, and the threat of substitution. It helps stakeholders to analyze the level of competition within the Rare Earth Elements industry and its attractiveness.
- Competitive landscape allows stakeholders to understand their competitive environment and provides an insight into the current positions of key players in the market.
Frequently Asked Questions About the Rare Earth Elements Market Report
The global rare earth elements market was valued at USD 14.03 Billion in 2025, driven by EV permanent-magnet demand, wind power build-out, and defense and electronics consumption.
The market is projected to reach USD 41.15 Billion by 2034, growing at a CAGR of 12.32% during 2026-2034, driven by EV traction motors, wind turbines, and Western supply diversification.
Magnets lead with a 31.2% share in 2025, supported by EV traction motors, wind turbine generators, and consumer electronics miniaturisation driving premium NdFeB demand globally.
China leads with a 58.3% share in 2025, driven by Bayan Obo and Sichuan integrated production, state-backed magnet capacity, and export-control leverage over global supply.
Rare earths power permanent magnets in EVs and wind turbines, auto and FCC catalysts, polishing powders for displays, glass additives, phosphors, and NiMH batteries.
Key drivers include EV traction motor demand (17M EV sales in 2024), 117 GW of wind capacity additions, defense procurement, and Western mine-to-magnet supply chain investment.
Permanent magnets and NiMH batteries are the fastest-growing combination through 2034, both projecting over 14% CAGR, fuelled by EV adoption and hybrid vehicle drivetrains.
Leading companies include Northern Rare Earth, Lynas Rare Earths Ltd, MP Materials, Shenghe Resources Holding Co., Iluka Resources Limited, JL MAG Rare-Earth Co., Ltd., Energy Fuels Inc., NEO, Arafura Rare Earths, and Hastings Technology Metals Limited.
Recycling recovers rare earths from end-of-life NdFeB magnets, NiMH batteries, and phosphors via chemical separation. The segment is forecast to scale from under 2% to over 10% of supply by 2030.
China holds 58.3% of global supply in 2025 through Bayan Obo and Sichuan operations and approximately 85-90% of magnet manufacturing, exerting structural pricing and trade-policy leverage globally.
EVs consume 1-2 kg of NdFeB magnet material per traction motor. With 17M EV sales in 2024 and continued growth, EVs anchor the largest single demand driver for permanent-magnet rare earths.
Need more help?
- Speak to our experienced analysts for insights on the current market scenarios.
- Include additional segments and countries to customize the report as per your requirement.
- Gain an unparalleled competitive advantage in your domain by understanding how to utilize the report and positively impacting your operations and revenue.
- For further assistance, please connect with our analysts.
 Request Customization
 Speak to an Analyst
 Request Brochure
 Inquire Before Buying
Benefits of Customization
- Personalize this research
- Triangulate with your data
- Get data as per your format and definition
- Gain a deeper dive into a specific application, geography, customer, or competitor
- Any level of personalization
Get in Touch With Us
UNITED STATES
Phone: +1-201-971-6302
INDIA
Phone: +91-120-433-0800
UNITED KINGDOM
Phone: +44-753-714-6104
Email: [email protected]
Client Testimonials


.webp)


