
India Hospitality Market Size, Share, Trends and Forecast by Type, Segment, and Region, 2026-2034
India Hospitality Market Size, Share, Trends & Forecast (2026-2034)
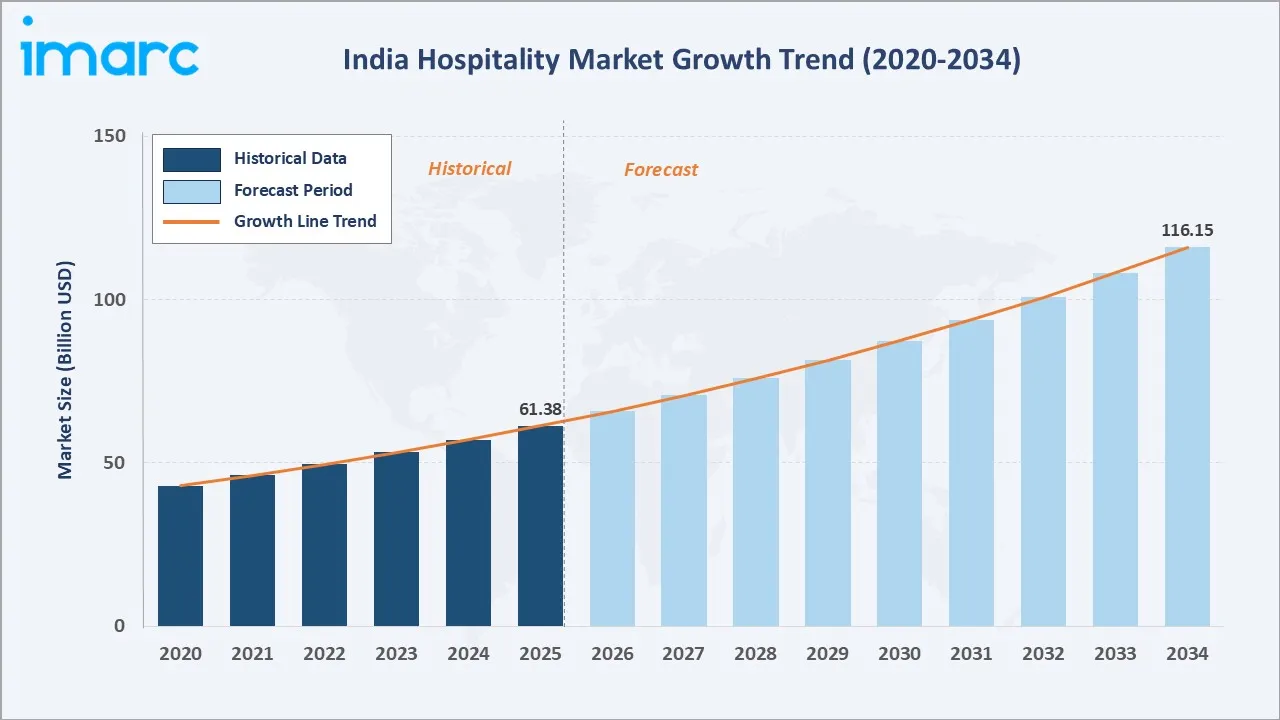
The India hospitality market grew from USD 61.38 Billion in 2025 to USD 65.89 Billion in 2026 and is projected to reach USD 116.15 Billion by 2034, growing at a CAGR of 7.34% during 2026-2034. The market demand is widening as domestic leisure travel, wedding and celebration spending, corporate travel and inbound tourism expand at once, and as a young working population treats weekend breaks as routine consumption. Rising room supply, new resort and conference capacity and faster conversion of independent properties into branded inventory lift the number of keys available across price tiers. Supporting growth factors include rising domestic travel, expanding branded room supply and steady institutional investment. Chain hotels dominate at 54.1%. Budget and economy hotels lead at 39.7%. West India commands 35.2% of the regional market share.
Market Snapshot
|
Metric |
Value |
|
Base Year Market Size (2025) |
USD 61.38 Billion |
|
Market Size (2026) |
USD 65.89 Billion |
|
Forecast Market Size (2034) |
USD 116.15 Billion |
|
CAGR (2026-2034) |
7.34% |
|
Base Year |
2025 |
|
Historical Period |
2020-2025 |
|
Forecast Period |
2026-2034 |
|
Dominant Type |
Chain Hotels (54.1%, 2025) |
|
Dominant Segment |
Budget and Economy Hotels (39.7%, 2025) |
|
Leading Region |
West India (35.2%, 2025) |
The India hospitality market size increased from USD 43.07 Billion in 2020 to USD 61.38 Billion in 2025 and is estimated to reach USD 65.89 Billion in 2026. The market is further expected to grow to USD 87.47 Billion by 2030 and USD 116.15 Billion by 2034. Its commercial distinctiveness rests on a demand base that mixes domestic leisure, weddings, pilgrimage and corporate travel, so occupancy holds up across seasons rather than depending on a single source market.
To get more information on this market, Request Sample
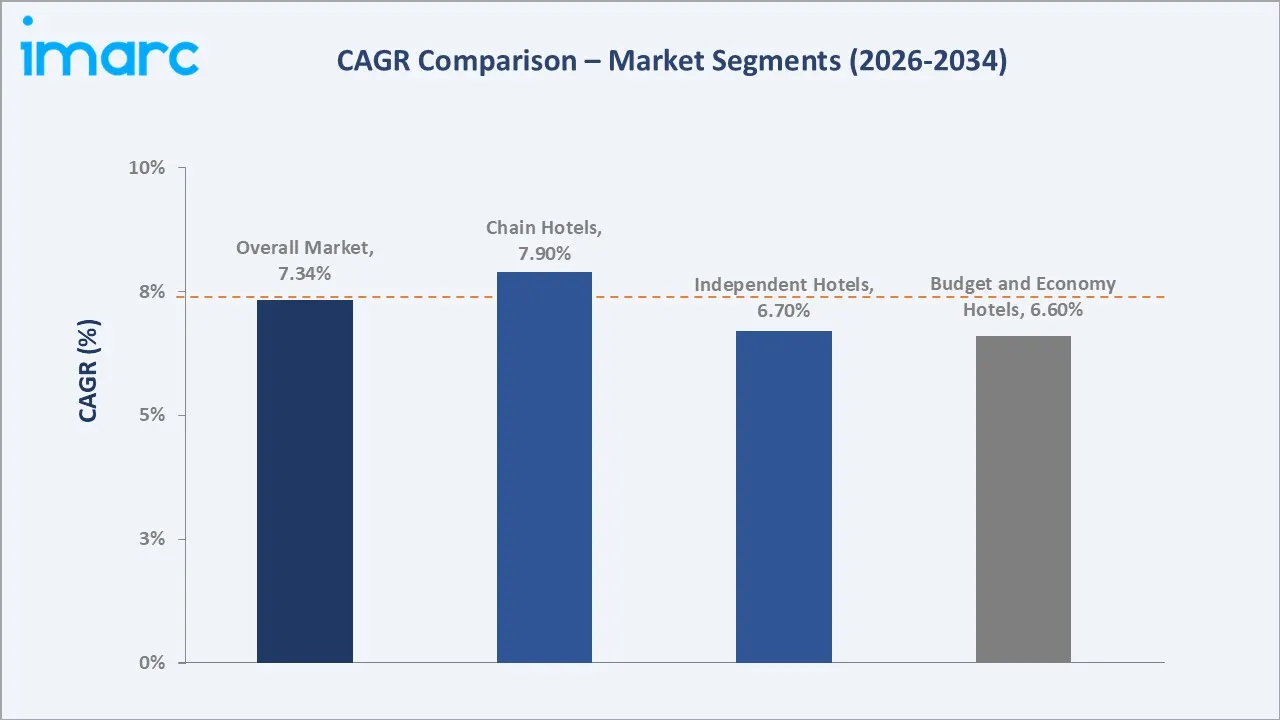
Chain hotels at ~7.9% CAGR and independent hotels at ~6.7% CAGR are the two fastest-growing types, supported by asset-light conversion of existing properties into branded inventory and by owner preference for established distribution and loyalty systems.
Executive Summary
The India hospitality market expanded from USD 61.38 Billion in 2025 to an estimated USD 65.89 Billion in 2026, with demand anchored in domestic leisure travel, wedding and event demand, corporate and MICE travel and a steadily recovering inbound market, all supported by a room pipeline that keeps adding branded inventory in metros as well as leisure destinations.
The fastest-developing areas are chain-operated hotels, service apartments and luxury and upper mid-scale properties, each outpacing the wider market because they combine higher average room rates with stronger occupancy and more predictable demand from both domestic and international guests. The market is projected to reach USD 116.15 Billion by 2034. Chain hotels lead at 54.1% through branded distribution and loyalty reach. Budget and economy hotels account for 39.7% anchor volume across price-sensitive demand. West India leads regionally at 35.2%.
Key Market Insights
|
Insight |
Data |
|
Dominant Type |
Chain Hotels - 54.1% share (2025) |
|
Dominant Segment |
Budget and Economy Hotels - 39.7% market share (2025) |
|
Leading Region |
West India - 35.2% share (2025) |
|
Market Opportunity |
Service apartments, luxury and upper mid-scale resorts, branded mid-market conversions, spiritual and wedding tourism clusters. |
Key Analytical Observations Supporting the Above Data:
- Chain Hotels at 54.1%: Branded chains control reservation systems, loyalty programs and corporate rate agreements, and they convert existing independent properties faster than new builds can be added, so they hold the majority of organized room revenue.
- Budget and Economy Hotels at 39.7%: This tier serves the largest volume of domestic travelers, including pilgrims, small business visitors and family groups, and it fills the room supply closest to highway, station and city-center demand.
- West India at 35.2%: Mumbai and Pune anchor corporate and MICE demand, Goa anchors leisure, and Gujarat adds industrial travel, giving the region the deepest branded room concentration and the highest average room rates.
India Hospitality Market Overview
The India hospitality market is built around a dual structure of owned and managed hotel assets, spread across branded chains, independent properties and a growing layer of serviced apartments and alternative accommodation. Supply is organized around large domestic operators, the India businesses of global chains, asset-light franchise networks and a long tail of standalone hotels and guest houses.
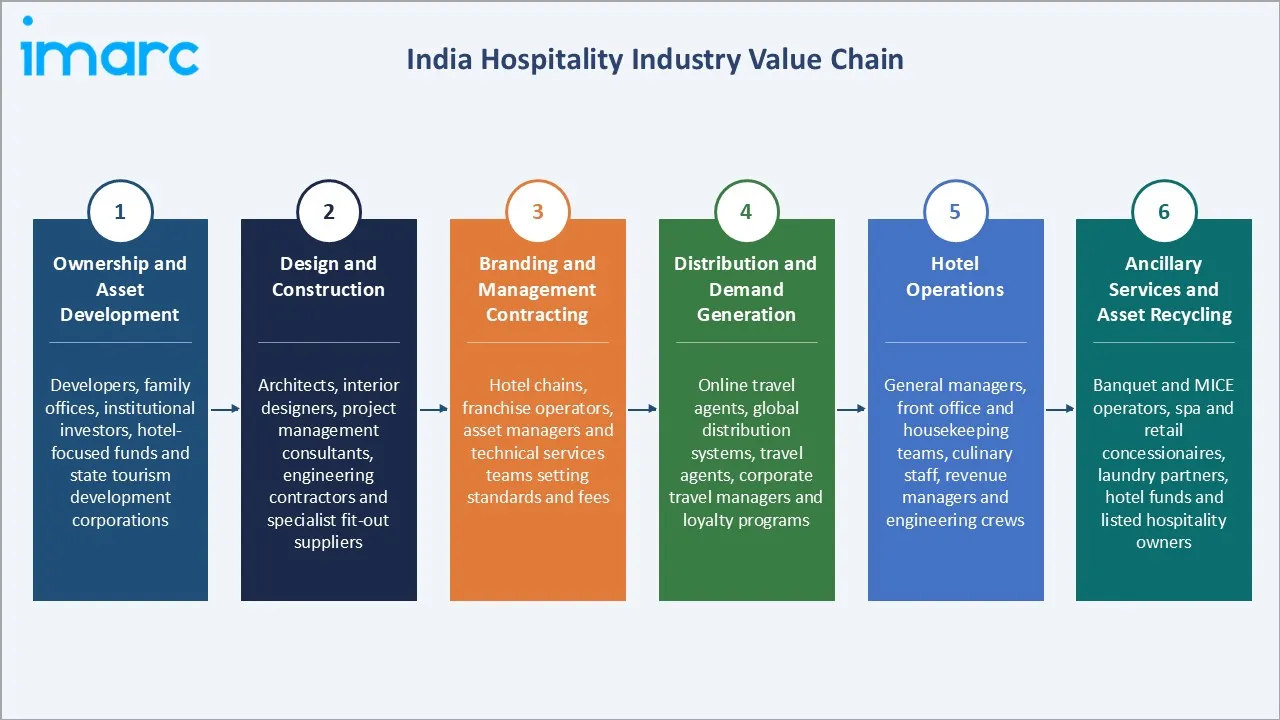
Demand comes from domestic leisure travelers, corporate and MICE clients, weddings and celebrations, pilgrimage circuits and inbound tourists, each with different seasonality and price sensitivity. Ownership sits mainly with developers, family businesses and institutional investors, while operations increasingly run under management contracts and franchises. Distribution has shifted toward online travel agents, direct booking platforms and loyalty programs, which now shape pricing and occupancy. Entry barriers are highest in luxury and metro business hotels, where land, capital and brand credibility decide outcomes.
Market Dynamics
To evaluate market opportunities, Request Sample
Market Drivers
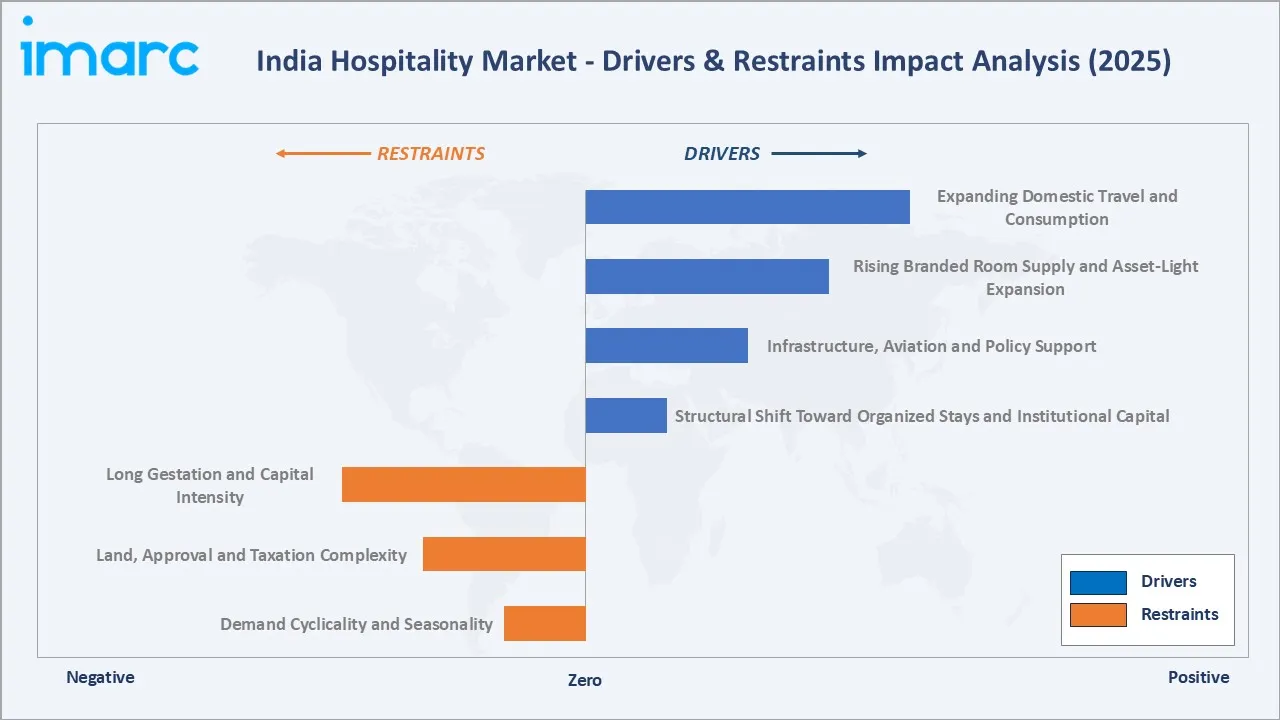
- Expanding Domestic Travel and Consumption: Domestic tourist visits across Indian states reached 428.55 crore in 2025, registering a 45.51% increase compared with 2024. A rising share of households treats travel as a regular expense rather than a rare occasion, and short weekend trips, family holidays and celebration travel now fill demand through the year. Improved road, rail and air connectivity has shortened travel times to leisure destinations, while digital booking has made planning simpler.
- Rising Branded Room Supply and Asset-Light Expansion: Hotel companies are adding inventory mainly through management contracts and franchises rather than owned construction, which lets them grow room count with limited capital. Owners of existing independent hotels increasingly convert to recognized brands to access distribution, loyalty and corporate rate agreements.
- Infrastructure, Aviation and Policy Support: Public investment in airports, highways, metro rail and convention facilities is expanding the catchment of destinations that were previously hard to reach. Region-linked air connectivity, easier visa processing for inbound visitors and state-level tourism promotion all lower the friction of travel.
- Structural Shift Toward Organized Stays and Institutional Capital: Travelers are moving from unbranded lodging toward branded hotels, serviced apartments and verified alternative accommodation, because they value consistency, safety, hygiene standards and transparent pricing. At the same time, institutional investors, family offices and listed hospitality companies are buying and developing hotel assets as long-term income assets, bringing professional asset management and refurbishment discipline.
Market Restraints
- Long Gestation and Capital Intensity: New hotel development requires land assembly, approvals, construction and pre-opening work that can take several years before the first guest is billed. Capital is committed upfront while revenue arrives late, which exposes developers to interest cost, construction inflation and changes in demand during the build period.
- Land, Approval and Taxation Complexity: Hotel projects cut across multiple approvals covering land use, environmental clearance, fire safety and licensing, and timelines vary widely between states and municipalities. Higher effective tax treatment on premium room rates in some categories affects pricing and demand at the top end.
- Demand Cyclicality and Seasonality: Leisure demand concentrates around holiday periods, festivals and wedding seasons, while corporate travel softens during holiday weeks and budget cycles. Inbound demand is sensitive to global economic conditions, currency movements and travel advisories. Operators respond with dynamic pricing, but sharp swings in occupancy force discounting in low periods and constrain revenue management in peak periods.
Market Opportunities
- Service Apartments and Extended Stay: Longer assignments, project-based corporate postings, medical travel and relocation create demand for accommodation with kitchens, laundry and flexible stay lengths. This format earns higher occupancy over longer periods with lower housekeeping and food costs per room night, and it suits conversion of residential buildings. Furthermore, converting existing residential buildings and underutilized properties into professionally managed serviced apartments offers developers a cost-effective expansion opportunity without requiring extensive greenfield hotel development.
- Branded Mid-Market and Conversion-Led Growth: A large stock of independent hotels already occupies good locations but lacks distribution, loyalty and consistent standards. Converting these properties under a mid-market or economy brand brings them into organized inventory quickly and at moderate cost, while owners gain access to corporate accounts and online demand. Meanwhile, existing hotel owners benefit from access to organized demand, improved occupancy potential, standardized operations, and stronger pricing capabilities. This model creates opportunities for rapid expansion across Tier II and Tier III cities while supporting the formalization of India's fragmented hospitality sector.
- Luxury Resort, Wedding and MICE Clusters: High-spend demand is concentrating in destinations that combine scenic or heritage appeal with event infrastructure. Large weddings, corporate conferences and incentive groups pay premium rates and book in blocks, which lifts both room revenue and food and beverage income. Properties positioned around convention centers, resort corridors and heritage circuits can charge higher rates while sustaining occupancy through weekday events.
Market Challenges
- Rate Pressure from New Supply: Where several branded properties open in one destination within a short window, occupancies are split and average rates soften until demand catches up. Owners then face pressure on returns while brands must protect standards and loyalty pricing. Managing a pipeline so that supply arrives in step with demand is difficult because development decisions are made years ahead of opening.
- Cost Inflation in Construction and Operations: Land, materials, labor and energy costs move faster than room rates can be revised, squeezing development margins and operating profits. Utility and food costs are difficult to pass through in price-sensitive segments, which forces continuous efficiency work on procurement, staffing and energy use.
- Informal and Unverified Accommodation: A substantial volume of rooms sits outside organized standards, advertised through informal channels with limited safety or service accountability. This supply competes on price in budget segments and complicates enforcement. Branded operators must justify their premium through consistency, security and transparent billing, which requires sustained investment in standards and staff training.
Emerging Market Trends
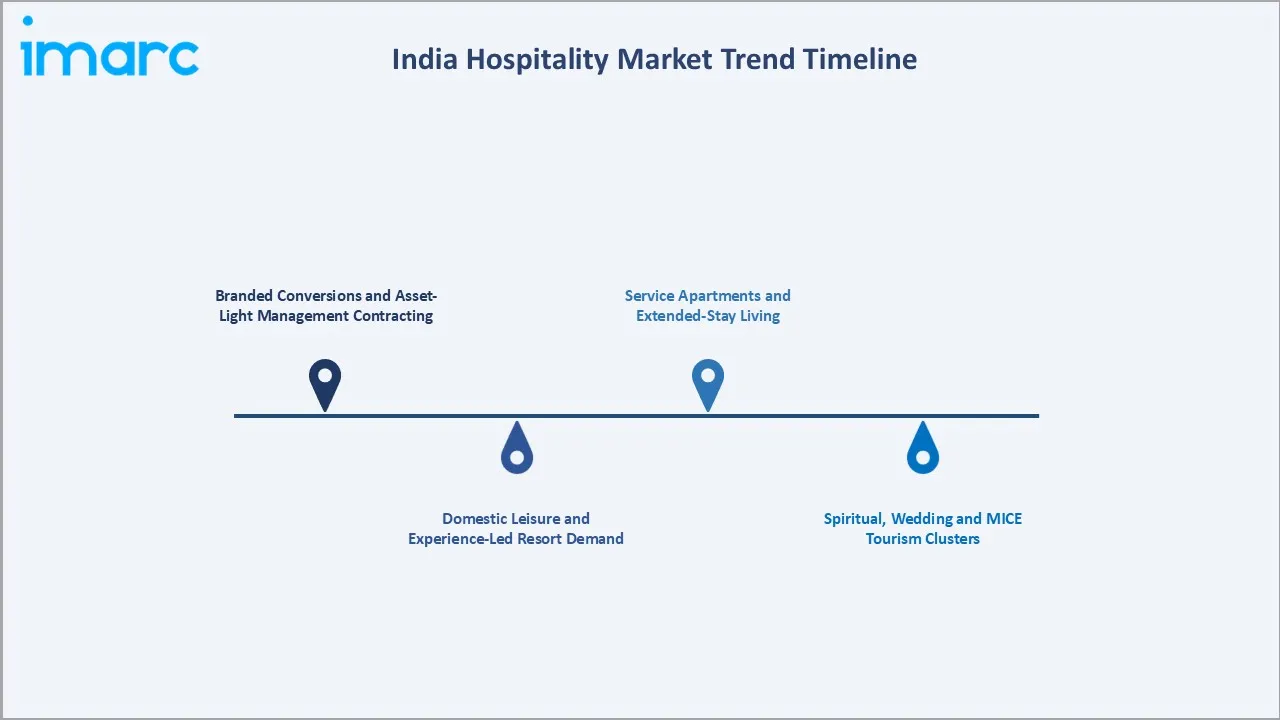
1. Branded Conversions and Asset-Light Management Contracting
Branded conversions and asset-light management contracting are driving the India hospitality market by enabling established hotel operators to expand their presence without significant investments in property ownership and new construction. Independent hotels are increasingly partnering with recognized hospitality brands to access established distribution networks, loyalty programs, standardized operating practices, and corporate customer bases. This model improves property visibility, service consistency, occupancy potential, and revenue generation while reducing capital requirements for hotel chains. Additionally, the conversion of existing properties into branded economy and mid-market hotels is accelerating organized hospitality supply across Tier II and Tier III cities.
2. Domestic Leisure and Experience-Led Resort Demand
Government initiatives, including Vision@2047, aim to boost India's tourism sector by attracting 100 million international tourists by 2047. Domestic leisure has become the most reliable demand engine, with travelers favoring shorter, more frequent trips built around experiences such as heritage walks, wellness retreats, wildlife visits and culinary tourism. Resort and villa formats in drive-to destinations now compete with city hotels for weekend demand, and guests compare properties through social media and review platforms before booking.
3. Service Apartments and Extended-Stay Living
The growing popularity of service apartments and extended-stay living is driving the India hospitality market by catering to increasing demand from corporate travelers, relocating professionals, medical tourists, and long-term business visitors. These accommodations offer residential-style amenities, including fully equipped kitchens, laundry facilities, workspaces, and flexible booking arrangements, providing greater convenience for extended stays. Rising employment mobility and business activities across major commercial hubs are further supporting demand for such properties. Additionally, longer guest stays enable operators to maintain stable occupancy, optimize operating expenses, and diversify revenue streams beyond conventional hotel accommodation.
4. Spiritual, Wedding and MICE Tourism Clusters
The expansion of spiritual, wedding, and MICE tourism clusters is driving the India hospitality market by generating year-round demand for accommodation, event venues, and associated hospitality services. Increasing pilgrim footfall at destinations such as Varanasi, Ayodhya, Tirupati, and Shirdi is encouraging investments in hotels, resorts, and organized lodging facilities. Simultaneously, the growing popularity of destination weddings and corporate conferences is boosting demand for luxury resorts, banquet halls, convention centers, and premium catering services. These developments are enabling hospitality operators to diversify revenue streams, attract high-spending travelers, and improve property occupancy across established and emerging tourism destinations.
Industry Value Chain Analysis
The India hospitality industry value chain encompasses multiple interconnected stages, beginning with land acquisition and asset ownership, followed by property design, construction, and infrastructure development. Branding and management contracting add value by introducing established operating standards, distribution networks, and hospitality expertise. Distribution and demand generation involve online travel agencies, direct booking platforms, corporate partnerships, and marketing activities that attract guests.
| Stage | Key Players / Examples |
|---|---|
| Ownership and Asset Development | Developers, family offices, institutional investors, hotel-focused funds and state tourism development corporations. |
| Design and Construction | Architects, interior designers, project management consultants, engineering contractors and specialist fit-out suppliers. |
| Branding and Management Contracting | Hotel chains, franchise operators, asset managers and technical services teams setting standards and fees. |
| Distribution and Demand Generation | Online travel agents, global distribution systems, travel agents, corporate travel managers and loyalty programs. |
| Hotel Operations | General managers, front office and housekeeping teams, culinary staff, revenue managers and engineering crews. |
| Ancillary Services and Asset Recycling | Banquet and MICE operators, spa and retail concessionaires, laundry partners, hotel funds and listed hospitality owners. |
Hotel operations represent the most commercially critical stage of the India hospitality market value chain, as they directly determine guest experience, service quality, occupancy levels, and overall profitability. This stage encompasses room management, housekeeping, food and beverage services, guest relations, facility maintenance, and revenue management. Furthermore, effective pricing strategies, digital booking systems, and personalized guest services help maximize revenue per available room (RevPAR) and strengthen long-term customer loyalty.
Technology Landscape in the India Hospitality Industry
Cloud Property Management and Revenue Management Systems
Property management platforms have moved from on-premise terminals to cloud systems that connect front desk, housekeeping, billing and reporting in one workflow. Revenue management tools then use booking pace, competitor rates and demand forecasts to reset prices several times a day rather than once a season. For multi-property groups, a shared platform gives head office live visibility of occupancy and rate discipline across cities, which matters when a single brand operates both metro business hotels and seasonal resorts.
Digital Distribution and Direct Booking Platforms
Distribution is now the main competitive battleground. Online travel platforms deliver reach but charge commission, so chains invest in their own websites and apps, member-only rates and loyalty-linked benefits to shift bookings to direct channels. Metasearch, messaging apps and social commerce have added new entry points, especially for leisure travelers discovering resort properties.
Smart Room and Contactless Guest Technology
Digital check-in, mobile keys, in-room controls and messaging-based service requests are becoming standard in new and refurbished properties. Guests expect to complete paperwork before arrival and to raise requests without calling the front desk, while hotels gain labor flexibility during peak check-in periods. Energy-linked room controls reduce consumption when rooms are empty, and sensor data helps engineering teams catch maintenance issues before they affect guests.
Energy Management, Water Recycling and Green Certification
Operating costs and buyer expectations are pushing sustainability technology into mainstream hotel design. Heat pumps, solar water heating, LED lighting with occupancy sensing, variable refrigerant flow cooling and treated water reuse for landscaping all reduce utility bills while supporting certification. Institutional owners and lenders increasingly ask for documented environmental performance before acquiring or funding assets, and corporate clients include sustainability criteria in venue selection.
Market Segmentation Analysis
The report covers the following segments:
|
Segment Category |
Leading Segment |
Market Share |
Year |
|
Type |
Chain Hotels |
54.1% |
2025 |
|
Segment |
Budget and Economy Hotels |
39.7% |
2025 |
|
Region |
West India |
35.2% |
2025 |

By Type
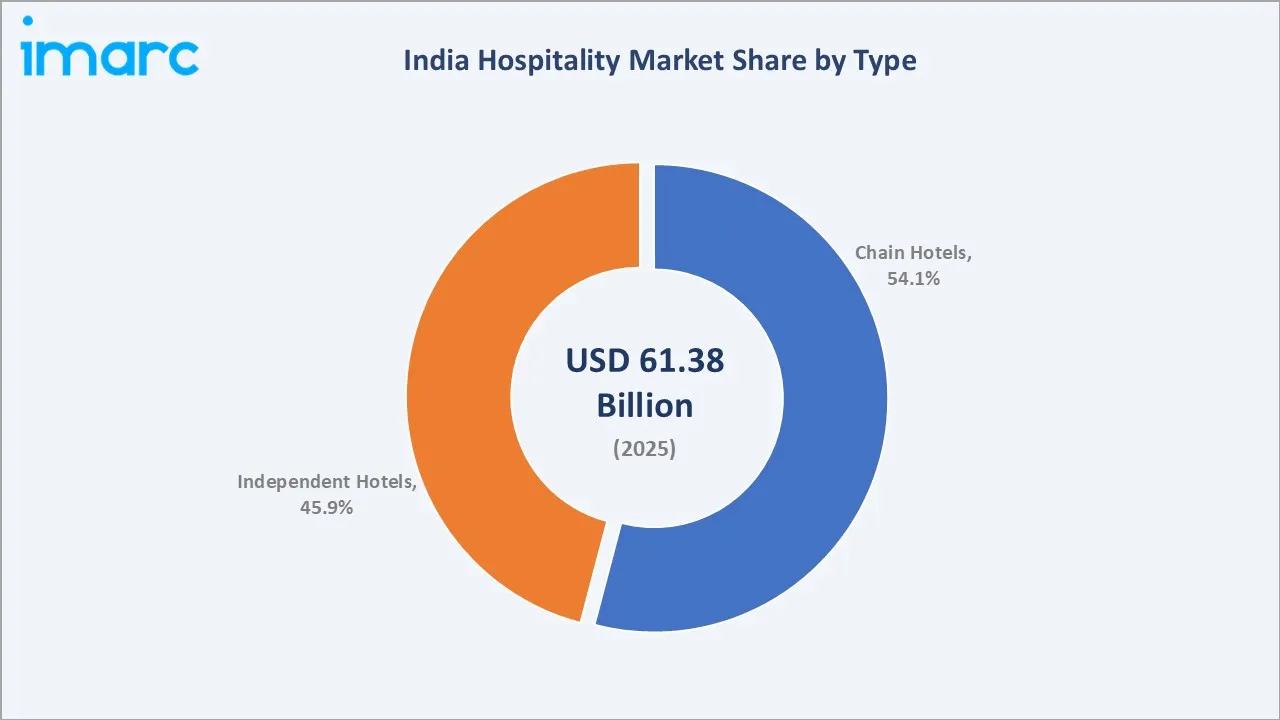
Chain hotels lead at 54.1% (2025). Branded chains carry the reservation systems, loyalty programs and corporate rate agreements that individual properties cannot replicate, and they convert existing independent hotels quickly. Their control of distribution and consistent service standards keeps them ahead across business and leisure demand alike. Chain hotels are the fastest-growing type at ~7.9%
To access detailed market analysis, Request Sample
Independent hotels at 45.9% grow at ~6.7% CAGR, supported by strong local loyalty, lower cost structures and their hold on destination-specific and heritage properties that brands find difficult to standardize.
By Segment
Budget and economy hotels lead at 39.7% (2025). This tier serves the largest volume of domestic travelers and sits closest to highway, station, airport and city-center demand. Low build cost, rapid conversion potential and high occupancy across price-sensitive segments keep it the widest base of the market.
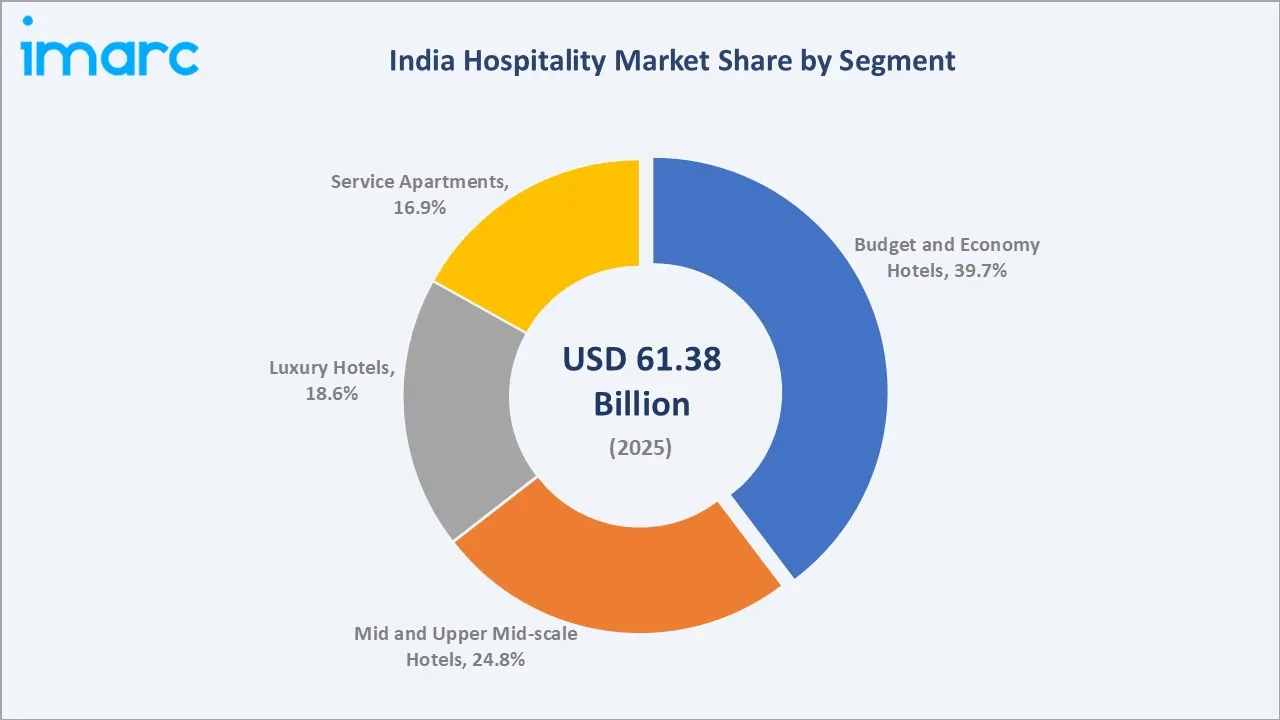
Mid and upper mid-scale hotels are at 24.8%. Luxury hotels are at 18.6% and are growing at ~7.8% CAGR, supported by destination weddings, high-spend inbound demand and resort development in heritage and coastal locations. Service apartments account for 16.9% and are the fastest-growing segment at ~8.3% CAGR. Longer corporate assignments, medical travel and relocation create demand for kitchens, laundry and flexible stay lengths, and the format operates at a lower cost per occupied room than a full-service hotel.
Regional Market Insights
|
Region |
Share (2025) |
Key India Hotel Market Drivers & Characteristics |
|
West India |
35.2% |
Mumbai and Pune corporate and MICE demand, Goa leisure resorts and Gujarat industrial travel with the highest rates. |
|
South India |
24.3% |
Bengaluru, Chennai and Hyderabad technology and corporate travel plus Kerala and Nilgiris leisure and medical tourism. |
|
North India |
22.1% |
Delhi-NCR business base, Golden Triangle inbound circuit, Rajasthan heritage and wedding destinations and pilgrimage routes. |
|
East India |
18.4% |
Kolkata corporate demand, Buddhist and coastal pilgrimage circuits and lower branded penetration with rising new supply. |
West India accounts for 35.2% of the India hospitality market, supported by a well-established combination of corporate travel, industrial activity, financial services, and leisure tourism. Mumbai serves as a major demand center due to its concentration of financial institutions, multinational corporations, business headquarters, commercial events, and premium hospitality establishments. South India holds 24.3% of the India hospitality market, driven by a combination of established information technology hubs, manufacturing centers, healthcare infrastructure, and diverse leisure destinations. Bengaluru, Chennai, and Hyderabad generate substantial weekday accommodation demand through corporate travel, technology-sector activities, business conferences, industrial visits, and multinational company operations.
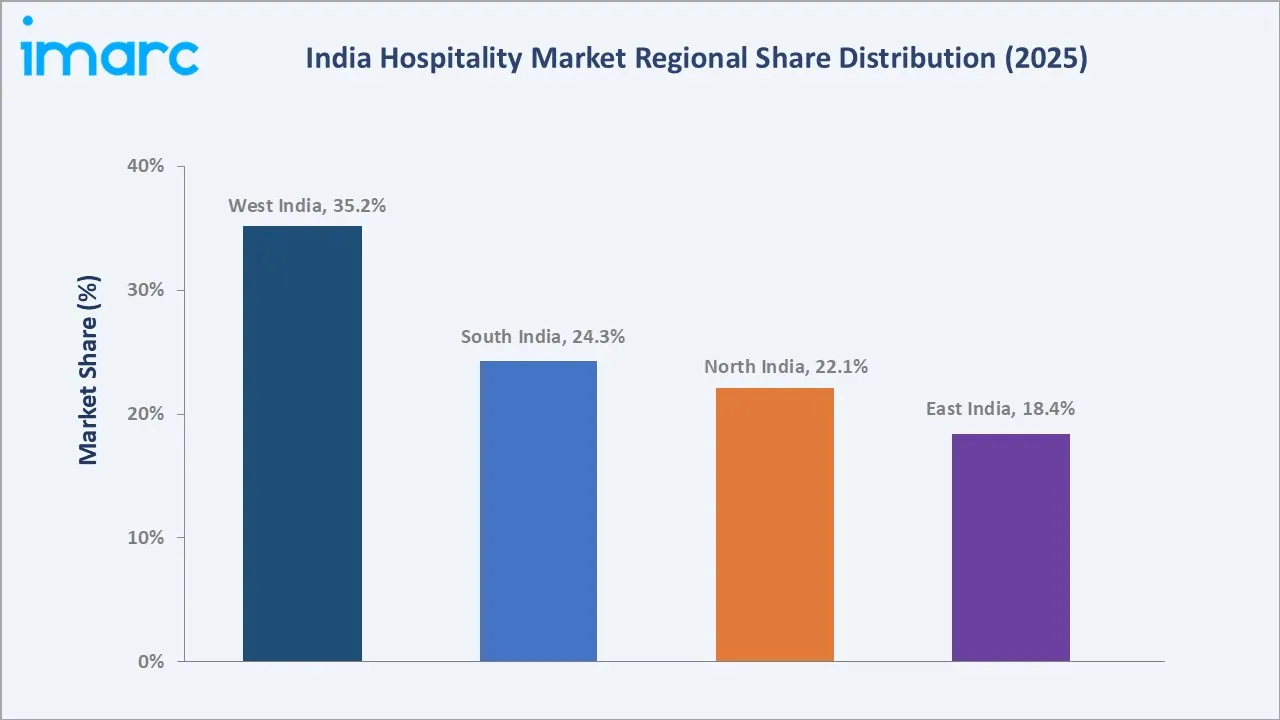
North India contributes 22.1%, shaped by the Delhi-NCR business district, the Golden Triangle inbound circuit, Rajasthan heritage and wedding properties and major pilgrimage routes. East India accounts for 18.4%, where Kolkata anchors corporate demand while Buddhist circuits, coastal destinations and improving connectivity draw new supply into a market that remains less penetrated by branded hotels.
Competitive Landscape
The competitive landscape is moderately concentrated among branded operators and fragmented across the wider market, where independent hotels and unbranded guest houses still hold a large share of rooms. Competition turns on location, brand trust, distribution reach, loyalty strength and the ability to win management contracts from owners who compare fee structures and performance records.
| Company | Key Offerings | Market Position | Core Strength |
|---|---|---|---|
| Tata Group | Taj, Vivanta, SeleQtions, Ginger, Atmantan, Brij Hotels | Market Leader | The Tata Group, primarily through The Indian Hotels Company Limited (IHCL), is India's largest hospitality company and a pioneer of modern Indian hotels, starting with The Taj Mahal Palace. |
| Marriott International, Inc. | The Ritz-Carlton, St. Regis, JW Marriott, EDITION, W Hotels | Market Leader | Marriott holds a leading share of India’s branded hotel room inventory. It offers a wide range of brands serving both domestic and international travelers. |
| ITC Hotels Limited | ITC Hotels, Welcomhotel, Mementos, Storii | Strong Challenger | ITC Hotels Limited plays a major role in Indian hospitality as one of the country's largest hotel operators, leading in sustainable "Responsible Luxury," heritage-inspired stays, and signature culinary brands. |
| The Oberoi Group | Oberoi Hotels & Resorts, Trident Hotels, Maidens Hotel | Established Player | The Oberoi Group has shaped Indian hospitality by setting benchmarks in luxury service, hospitality education, and heritage and destination resorts. |
| Lemon Tree Hotels Ltd. | Aurika Hotels & Resorts, Lemon Tree Premier, Keys Prima, Lemon Tree Hotel | Innovator | Lemon Tree established standardized service, hygiene, and contemporary interiors at accessible price points for business and leisure guests. |
Owner bargaining power has risen alongside the number of brands available, so fee structures, performance guarantees and pre-opening support now decide contract awards as much as brand strength. At the same time, the emergence of large institutional owners with multi-property portfolios is shifting influence toward owners who can award several contracts at once.
Key Company Profiles
Tata Group
Tata Group is an Indian multinational conglomerate with a diversified presence across several industries, including hospitality, automotive, technology, and consumer products. Through its subsidiary, The Indian Hotels Company Limited (IHCL), the Group operates a diverse portfolio of hospitality brands. Its offerings span luxury hotels, upscale accommodation, and midscale hospitality services. The Group focuses on expanding its hotel portfolio, strengthening its presence in emerging tourism destinations, and delivering differentiated hospitality experiences across domestic and international markets.
- Key Brands: Taj, Vivanta, SeleQtions, Ginger, Atmantan, Brij Hotels
- Recent Developments: In November 2026, Indian Hotels Company Limited (IHCL) opened Taj Pushkar Resort & Spa in Rajasthan, strengthening its hospitality presence in the state. The resort combines Taj’s signature services with local traditions, offering guests an immersive experience centered on Pushkar’s spiritual heritage and cultural attractions.
- Strategic Focus: The company is prioritizing asset-light growth, expanding its mid-market Ginger brand, deepening leisure and heritage formats, and using its loyalty program to shift demand toward direct booking channels.
Marriott International, Inc.
Marriott International operates the largest international hotel portfolio in India, spanning luxury, premium, select-service and extended-stay brands. Its position rests on brand breadth, a deep loyalty base and the ability to place several brands within one market at different price points.
- Key Brands: The Ritz-Carlton, St. Regis, JW Marriott, EDITION, W Hotels.
- Recent Developments: In May 2026, Marriott International, in partnership with Concept Hospitality Pvt. Ltd., recorded 75 hotel signings and 50 openings under its Series by Marriott brand within six months of its November 2025 launch in India. The expansion adds over 3,556 rooms across 43 cities, covering Tier 1, Tier 2, and Tier 3 markets.
- Strategic Focus: Marriott is focusing on mid-scale and select-service growth, conversions of existing properties, loyalty-led direct booking and expansion into emerging business and leisure destinations.
Market Concentration Analysis
The market is moderately concentrated at the branded end and fragmented overall. The Tata Group holds the largest branded position, with an estimated 12% to 18% share of organized room revenue, supported by the widest portfolio of brands and cities. Other established players hold strong positions in specific tiers and locations. Independent hotels still account for a large share of total rooms, which keeps overall concentration low even as branded supply grows.
Two opposing competitive forces are reshaping market concentration in the India hospitality industry. On one hand, established hotel chains are strengthening their market positions through management contracts, multi-brand expansion strategies, franchising arrangements, and loyalty-driven distribution networks. On the other hand, independent hotel owners, emerging domestic hospitality brands, serviced apartment providers, and alternative accommodation platforms are capturing demand in underserved market segments. These players are addressing specific requirements such as budget accommodation, extended stays, regional travel preferences, boutique experiences, and flexible lodging options that larger chains may not adequately serve.
Investment & Growth Opportunities
Highest Growth Segments
Service apartments at ~8.3% CAGR, chain hotels at ~7.9% CAGR, luxury hotels at ~7.8% CAGR, mid and upper mid-scale hotels at ~7.5% CAGR, independent hotels at ~6.7% CAGR and budget and economy hotels at ~6.6% CAGR form the primary investment vectors through 2034. These segments grow fastest because demand pull is shifting toward longer stays, higher-spend leisure occasions and branded consistency that independent supply cannot easily match.
Emerging Investment Opportunities
The most dynamic emerging opportunity is serviced apartments and extended-stay formats, which scale fastest in business districts, hospital catchments and project corridors where stays run for weeks rather than nights. Asset-light management of converted residential inventory keeps capital needs low and occupancy high. This model also enables operators to cater to corporate travelers, medical tourists, and relocating professionals while generating more predictable rental income and improving asset utilization.
Investment Themes
- Asset-light branded conversions: Management contracts over existing independent properties add rooms quickly, capture owner capital, and lift the organized share without heavy balance sheet exposure.
- Extended-stay and serviced apartments: Longer assignments and medical travel support high occupancy and lower operating cost per room night, with steady monthly revenue rather than seasonal peaks. Investments in furnished units, kitchen facilities, and flexible leasing further strengthen their appeal among corporate travelers and relocating professionals.
- Leisure, wedding and MICE clusters: Resort and convention-linked assets command premium rates and diversify demand across weekdays and weekends, protecting returns through cycles. Integrated offerings such as banquet facilities, wellness amenities, and event-management services can generate additional revenue and improve overall asset profitability.
Future Market Outlook (2026-2034)
The India hospitality market is projected to grow from USD 61.38 Billion in 2025 to USD 65.89 Billion in 2026, reaching USD 116.15 Billion by 2034, registering a CAGR of 7.34% during 2026-2034. The market's anchor value of USD 87.47 Billion in 2030 reflects steady gains from domestic leisure, branded conversions and conference demand rather than a single demand spike. West India and South India sustain leadership as corporate density, leisure corridors and branded supply remain strongest there.
Three structural forces are shaping the growth of India's hospitality market. Rising domestic and international tourism is increasing demand for diverse accommodation options across leisure, business, and pilgrimage destinations. Growing disposable incomes and changing consumer preferences are encouraging travelers to seek premium, experiential, and wellness-oriented stays. Meanwhile, expanding investments in hotel infrastructure and the entry of established hospitality chains into Tier 2 and Tier 3 cities are strengthening the country's accommodation network and supporting long-term market growth.
Research Methodology
Primary Research
Primary research involved conducting structured interviews and discussions with hotel operators, chain representatives, property owners, travel agents, hospitality consultants, and industry experts. The research gathered insights into occupancy patterns, room pricing, customer preferences, operating costs, investment trends, and competitive strategies. These inputs were cross-validated with secondary sources to assess market dynamics and future growth prospects.
Secondary Research
Secondary research encompasses the analysis of industry reports, government tourism statistics, hotel association publications, company annual reports, regulatory documents, and credible news sources. It examines tourism trends, hotel supply, market developments, competitive landscapes, investment activities, and industry performance to establish a comprehensive market outlook.
Forecasting Models
Forecasting models incorporate historical market performance, tourist arrival trends, hotel occupancy rates, average daily room rates (ADR), revenue per available room (RevPAR), infrastructure investments, and macroeconomic indicators. These variables are assessed to estimate future demand, market expansion, and growth patterns across hospitality segments.
India Hospitality Market Report Coverage:
|
Report Features |
Details |
|
Base Year of the Analysis |
2025 |
|
Historical Period |
2020-2025 |
|
Forecast Period |
2026-2034 |
|
Units |
Billion USD |
|
Scope of the Report |
Exploration of Historical Trends and Market Outlook, Industry Catalysts and Challenges, Segment-Wise Historical and Future Market Assessment:
|
|
Types Covered |
Chain Hotels, Independent Hotels |
|
Segments Covered |
Service Apartments, Budget and Economy Hotels, Mid and Upper Mid-scale Hotels, Luxury Hotels |
|
Regions Covered |
North India, South India, East India, West India |
| Companies Covered | Tata Group, Marriott International, Inc., ITC Hotels Limited, The Oberoi Group, Lemon Tree Hotels Ltd., etc. |
|
Customization Scope |
10% Free Customization |
|
Post-Sale Analyst Support |
10-12 Weeks |
|
Delivery Format |
PDF and Excel through Email (We can also provide the editable version of the report in PPT/Word format on special request) |
Frequently Asked Questions About the India Hospitality Market Report
The market reached USD 65.89 Billion in 2026, supported by domestic leisure travel, wedding and event demand, corporate and MICE travel and expanding branded room supply.
The market is expected to register a CAGR of 7.34% during 2026-2034, supported by rising domestic and international travel, expanding corporate activity, and growing demand for organized accommodation. The increasing popularity of serviced apartments, extended-stay formats, and branded hotel conversions is further strengthening market expansion. Additionally, investments in luxury resorts, destination weddings, and MICE infrastructure are creating new revenue opportunities for hospitality operators.
Chain hotels lead the type segment with a 54.1% share in 2025, reflecting control of reservation systems, loyalty programs and corporate rate agreements, together with faster conversion of independent properties into branded inventory.
Budget and economy hotels lead the segment with a 39.7% share in 2025, serving the largest volume of domestic travelers and occupying the room supply closest to highway, station, airport and city-center demand.
West India leads with a 35.2% regional share in 2025, anchored by Mumbai and Pune corporate and MICE demand, Goa leisure resorts and Gujarat industrial travel corridors.
Leading companies include Tata Group, Marriott International, Inc., ITC Hotels Limited, The Oberoi Group, and Lemon Tree Hotels Ltd., among others.
The market is projected to reach USD 87.47 Billion by 2030, driven by branded conversions, domestic leisure and wedding demand, growing conference capacity and extended-stay accommodation.
The top investment opportunities in the India hospitality market lie in serviced apartments and extended-stay accommodations, catering to corporate travelers, medical tourists, and relocating professionals. Asset-light branded hotel conversions offer scope for rapid expansion with lower capital requirements, particularly across Tier II and Tier III cities.
Need more help?
- Speak to our experienced analysts for insights on the current market scenarios.
- Include additional segments and countries to customize the report as per your requirement.
- Gain an unparalleled competitive advantage in your domain by understanding how to utilize the report and positively impacting your operations and revenue.
- For further assistance, please connect with our analysts.
 Request Customization
 Speak to an Analyst
 Request Brochure
 Inquire Before Buying
Benefits of Customization
- Personalize this research
- Triangulate with your data
- Get data as per your format and definition
- Gain a deeper dive into a specific application, geography, customer, or competitor
- Any level of personalization
Get in Touch With Us
UNITED STATES
Phone: +1-201-971-6302
INDIA
Phone: +91-120-433-0800
UNITED KINGDOM
Phone: +44-753-714-6104
Email: [email protected]
Client Testimonials











Related Reports

Choose your plan
*Please note that the prices mentioned below are starting prices for each bundle type. Kindly contact our team for further details.*
Single User License
- 1 User License, Access on 2 Devices
- PDF Report + Excel Dataset (Password Protected)
- Lifetime Access
- No Printing Rights
- 10% Free Report Customization
- 10–12 Weeks of Analyst Support
Five User License
- Access for 5 Users, 2 Devices per User
- PDF Report + Excel Dataset (Password Protected)
- Lifetime Access
- Dedicated Account Manager
- 12–14 Weeks of Analyst Support
- No Printing Rights
- 15% Free Report Customization
- 25% Discount on Your Next Purchase
Corporate User License
- Unlimited User Access (Within Your Organization)
- PDF Report + Excel Dataset
- Lifetime Access
- Dedicated Account Manager
- 14–20 Weeks of Analyst Support
- No Printing Rights
- 20% Free Report Customization
- 30% Discount on Your Next Purchase
Essential Insights
What's included:
3 reports
- Lifetime Access
- PDF Reports
- Excel Datasets
- 2 Weeks of Free Analyst Support
- 2 User Licenses
- Access on 2 Devices
- Printing Rights
- Complimentary PowerPoint (PPT) Version
- Complimentary License Upgrade
Professional Access
What's included:
5 reports
- Lifetime Access
- PDF Reports
- Excel Datasets
- 8 Weeks of Free Analyst Support
- 2 User Licenses
- Access on 2 Devices
- Printing Rights
- Complimentary PowerPoint (PPT) Version
- Complimentary License Upgrade
Business Advantage
What's included:
8 reports
- Lifetime Access
- PDF Reports
- Excel Datasets
- 14 Weeks of Free Analyst Support
- 2 User Licenses
- Access on 2 Devices
- Printing Rights
- Complimentary PowerPoint (PPT) Version
- Complimentary License Upgrade
Enterprise Intelligence
What's included:
10 reports
- Lifetime Access
- PDF Reports
- Excel Datasets
- 20 Weeks of Free Analyst Support
- 2 User Licenses
- Access on 2 Devices
- Printing Rights
- Complimentary PowerPoint (PPT) Version
- Complimentary License Upgrade