
Robo Taxi Market Report by Application (Goods, Passenger), Level of Autonomy (Level 4, Level 5), Vehicle (Car, Shuttle/Van), Service (Rental, Station-based), Propulsion (Electric, Hybrid, Fuel Cell), and Region 2026-2034
Market Overview:
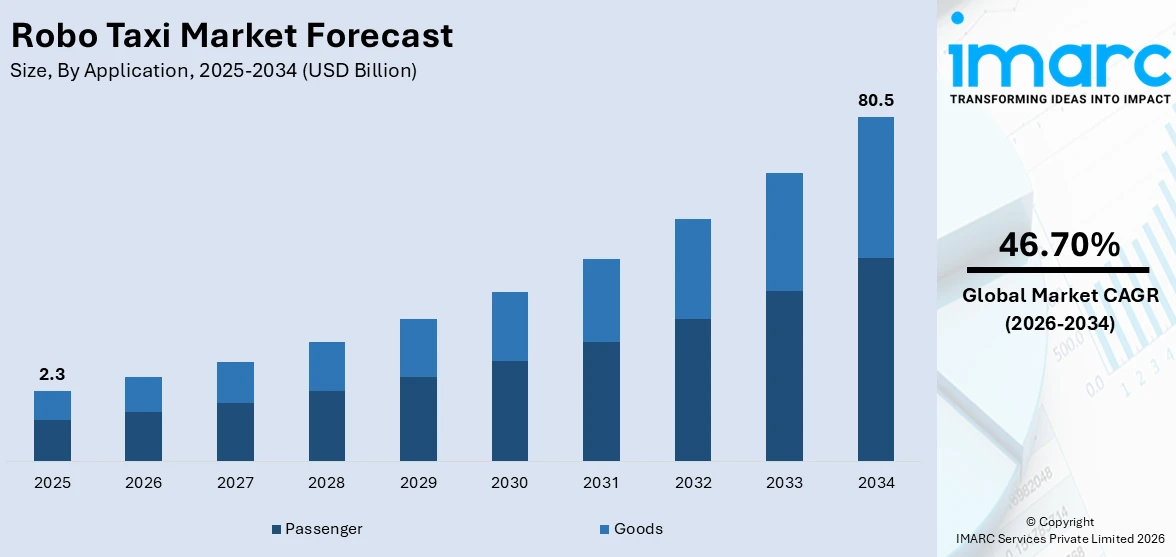
The global robo taxi market size reached USD 2.3 Billion in 2025. Looking forward, IMARC Group expects the market to reach USD 80.5 Billion by 2034, exhibiting a growth rate (CAGR) of 46.70% during 2026-2034. The significant technological advancements, shifting toward eco-friendly alternative to traditional gas-powered vehicles, rapid urbanization and growing traffic congestion challenges, and supportive regulations and legal frameworks to provide the necessary foundation for robo taxi are some of the major factors propelling the market.
|
Report Attribute
|
Key Statistics
|
|---|---|
|
Base Year
|
2025 |
|
Forecast Years
|
2026-2034
|
|
Historical Years
|
2020-2025
|
| Market Size in 2025 | USD 2.3 Billion |
| Market Forecast in 2034 | USD 80.5 Billion |
| Market Growth Rate (2026-2034) | 46.70% |
Robo taxi, also known as autonomous taxi or self-driving taxi, refers to a cutting-edge transportation service that utilizes autonomous vehicles to provide passenger transportation without the need for a human driver. These vehicles are equipped with advanced sensors, cameras, lidar, radar, and artificial intelligence algorithms that enable them to navigate through urban environments, identify obstacles, and make real-time decisions to ensure safe and efficient travel.
To get more information on this market Request Sample
With an increasing emphasis on sustainability and reducing carbon emissions, robo taxis present an eco-friendly alternative to traditional gas-powered vehicles. Electric and autonomous robo taxis have the potential to significantly reduce greenhouse gas emissions, contributing to a cleaner and greener transportation ecosystem. Additionally, as cities around the world face growing urbanization and traffic congestion challenges, robo taxis offer a promising solution. Their ability to optimize routes, share rides, and operate continuously can help ease traffic congestion and improve overall urban mobility. Other than this, utilizing robo taxi services can be more cost-effective than owning a private vehicle. Ride-sharing and on-demand services eliminate the need for car ownership expenses, such as maintenance, insurance, and parking fees. Besides this, autonomous vehicles have the potential to significantly reduce accidents caused by human error, making transportation safer for passengers and pedestrians alike. The promise of increased safety encourages consumers to embrace robo taxis as a reliable mode of transport. In line with this, governments and regulatory bodies worldwide are actively involved in formulating guidelines and policies to facilitate the safe integration of autonomous vehicles into public transportation systems. Supportive regulations and legal frameworks provide the necessary foundation for robo taxi market growth. Furthermore, rapid advancements in autonomous vehicle technology, including artificial intelligence, sensor technology, and computing power, have paved the way for the development and deployment of robo taxis. These innovations enhance the safety, reliability, and efficiency of autonomous vehicles, instilling confidence in potential users and stakeholders.
Robo Taxi Market Trends/Drivers:
Technological Advancements
Innovations in artificial intelligence, machine learning, and sensor technologies have significantly improved the capabilities of autonomous vehicles. Advanced AI algorithms enable robo taxis to perceive their surroundings, identify obstacles, and make complex decisions in real-time, ensuring safe and efficient navigation. Additionally, the development of high-resolution sensors, such as lidar and radar, enhances the vehicles' ability to detect and respond to dynamic environments accurately. The continuous evolution of computing power allows for faster data processing and enhances the overall performance of autonomous systems. As research and development in these areas continue, the potential for fully autonomous and reliable robo taxi fleets becomes increasingly viable, attracting more investments and market interest.
Environmental Concerns
Robo taxis powered by electric or hybrid technologies offer a cleaner alternative to conventional gasoline-powered vehicles. By eliminating tailpipe emissions and reducing carbon footprints, robo taxis align with global efforts to transition towards greener mobility options. Governments and environmentally conscious consumers are supportive of initiatives that promote cleaner transportation, making the adoption of robo taxis a strategic step towards achieving eco-friendly urban mobility. As cities strive to achieve ambitious carbon reduction goals, the market for robo taxis gains momentum as a practical and environmentally responsible transportation solution.
Rapid Urbanization and Traffic Congestion Challenges
Robo taxis offer the potential to address these challenges by optimizing travel routes, utilizing ride-sharing, and operating continuously, thus alleviating traffic congestion in densely populated areas. By reducing the number of private vehicles on the road through shared mobility services, robo taxis can help reclaim valuable urban space, reduce commuting times, and improve overall transportation efficiency. As cities seek innovative ways to manage urban mobility and ensure smooth traffic flow, the deployment of robo taxis presents an attractive solution that can revolutionize urban transportation and enhance the quality of life for residents.
Robo Taxi Industry Segmentation:
IMARC Group provides an analysis of the key trends in each segment of the global robo taxi market report, along with forecasts at the global, regional and country levels from 2026-2034. Our report has categorized the market based on application, level of autonomy, vehicle, service, and propulsion.
Breakup by Application:
- Goods
- Passenger
Passenger dominates the market
The report has provided a detailed breakup and analysis of the market based on the application. This includes goods and passenger. According to the report, passenger represented the largest segment.
There is a higher demand for transportation services among the general population, leading to a larger customer base for passenger-focused applications. As robo taxis gain popularity as a convenient and efficient mode of urban transportation, more consumers are inclined to opt for ride-sharing and on-demand services, contributing to the expansion of the passenger segment. Additionally, the proliferation of ride-hailing platforms and mobile applications has made it easier for users to access robo taxi services. These platforms provide seamless booking, payment options, and real-time tracking, making the experience convenient and user-friendly, further driving passenger adoption. Other than this, the potential cost savings associated with using robo taxis for daily commuting and travel make them an attractive option for individual passengers. With shared rides and reduced car ownership expenses, passengers can benefit from a more affordable transportation alternative compared to owning a private vehicle. Furthermore, the increasing focus on urban mobility and reducing traffic congestion has spurred interest in passenger-oriented robo taxis, as they offer a scalable solution to address these challenges in crowded cities.
Breakup by Level of Autonomy:
Access the comprehensive market breakdown Request Sample
- Level 4
- Level 5
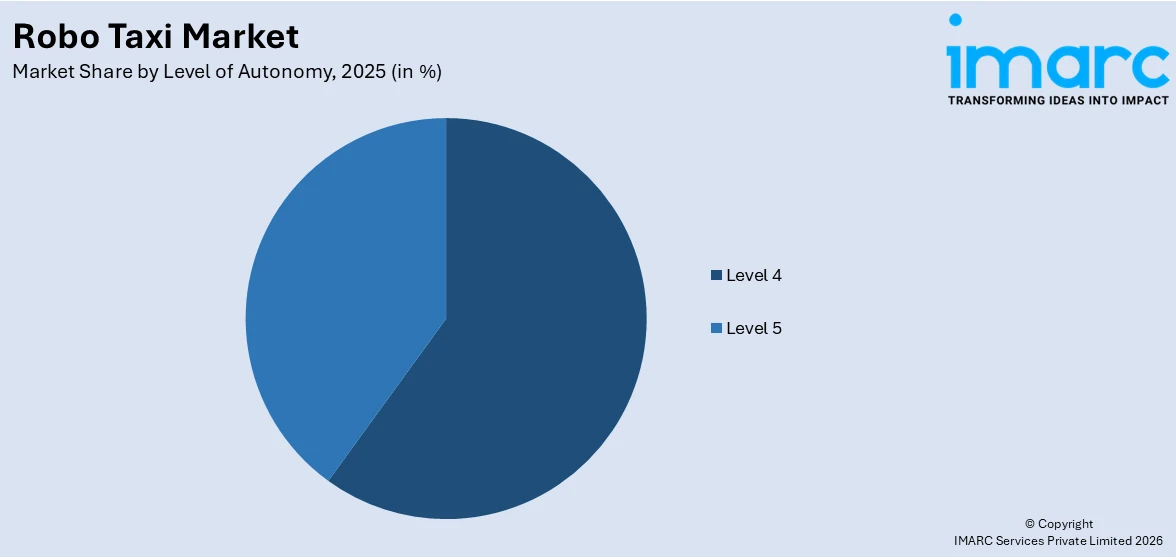
Level 4 holds the largest share in the market
A detailed breakup and analysis of the market based on the level of autonomy has also been provided in the report. This includes level 4 and level 5. According to the report, level 4 accounted for the largest market share.
Level 4 autonomy instills a higher level of trust and confidence among consumers. The technology's ability to navigate complex urban environments and handle various driving scenarios with minimal human input appeals to safety-conscious passengers. Additionally, the development and deployment of level 4 autonomous vehicles have received substantial investments from both technology companies and automotive manufacturers. This focus on advancing level 4 autonomy has resulted in a faster pace of development and commercialization, leading to a broader availability of these vehicles in the market. Moreover, regulatory bodies have shown a willingness to support the testing and deployment of level 4 autonomous vehicles in controlled environments. As a result, manufacturers are more inclined to invest in this level of autonomy, leading to its dominant position in the market. Level 4 autonomous vehicles align with the industry's goal of achieving fully autonomous transportation. This level represents a significant step toward achieving that vision, making it a focal point of research, development, and market adoption.
Breakup by Vehicle:
- Car
- Shuttle/Van
Car accounts for the majority of the market share
The report has provided a detailed breakup and analysis of the market based on the vehicle. This includes car and shuttle/van. According to the report, car represented the largest segment.
The concept of robo taxis is closely associated with traditional car-like vehicles, and thus, the car segment represents a natural extension of the existing transportation paradigm. Consumers are more familiar with cars as a mode of transport, and the idea of autonomous cars operating as robo taxis aligns with their existing travel preferences. Additionally, the automotive industry's strong foundation and expertise in manufacturing cars have facilitated the development and deployment of autonomous vehicle technology in this segment. Automotive manufacturers have been at the forefront of autonomous vehicle research and have invested heavily in creating self-driving cars, accelerating the availability of robo taxis in the car segment. Other than this, cars offer a versatile and adaptable platform for integrating autonomous technology. The industry has a vast range of car models, from compact sedans to larger SUVs, catering to diverse passenger needs and preferences. This flexibility allows robo taxi services to cater to various customer groups, making them an appealing option for a broad audience. Furthermore, the widespread infrastructure supporting cars, such as roads, parking spaces, and service centers, makes it convenient to integrate robo taxis into existing transportation systems. The compatibility of autonomous cars with existing urban infrastructure has further fueled the growth of the car segment in the robo taxi market.

Breakup by Service:
- Rental
- Station-based
Rental hold the largest share in the market
A detailed breakup and analysis of the market based on the service has also been provided in the report. This includes rental and station-based. According to the report, rental accounted for the largest market share.
The rental model offers a flexible and cost-effective solution for consumers who seek occasional transportation needs. Many individuals may not require regular access to a personal vehicle, and renting a robo taxi when needed proves to be a convenient and economical choice. Additionally, the rental service model aligns well with the on-demand nature of robo taxis. Users can easily book a robo taxi for a specific duration, whether it's for a short trip or an extended journey, without the commitment of vehicle ownership. Other than this, the rental model allows for efficient fleet management by service providers. The rental system enables them to optimize vehicle utilization, ensuring that the robo taxis are in operation more frequently and generating revenue for the service provider. Furthermore, the rental segment attracts diverse customer segments, including tourists, business travelers, and locals who need transportation for special occasions or specific events. This broad appeal drives higher demand for rental robo taxi services, making it the largest segment in the market breakup by service. Moreover, regulatory considerations may favor the rental model in certain regions, as it ensures greater oversight and control of robo taxi operations, thereby addressing safety and regulatory concerns.
Breakup by Propulsion:
- Electric
- Hybrid
- Fuel Cell
Electric represents the largest market segment
The report has provided a detailed breakup and analysis of the market based on the propulsion. This includes electric, hybrid, and fuel cell. According to the report, electric represented the largest segment.
The increasing global focus on sustainability and reducing greenhouse gas emissions has accelerated the demand for eco-friendly transportation solutions. Electric propulsion offers a cleaner alternative to traditional internal combustion engines, as electric vehicles produce zero tailpipe emissions, making them an environmentally responsible choice. Additionally, advancements in battery technology have significantly improved the range and performance of electric vehicles, addressing the concerns of limited mileage and charging infrastructure. As a result, electric robo taxis can cover more substantial distances on a single charge, making them a viable option for various urban commuting needs. Moreover, electric vehicles benefit from lower operating costs compared to their gasoline counterparts. They require less maintenance and have fewer moving parts, translating into reduced expenses for robo taxi service providers and potential cost savings for passengers. Furthermore, governments and cities worldwide are actively promoting the adoption of electric vehicles by offering incentives, subsidies, and infrastructure development, creating a supportive ecosystem for electric robo taxis.
Breakup by Region:
- North America
- United States
- Canada
- Asia-Pacific
- China
- Japan
- India
- South Korea
- Australia
- Indonesia
- Others
- Europe
- Germany
- France
- United Kingdom
- Italy
- Spain
- Russia
- Others
- Latin America
- Brazil
- Mexico
- Others
- Middle East and Africa
Asia Pacific exhibits a clear dominance in the market
The report has also provided a comprehensive analysis of all the major regional markets, which include North America (the United States and Canada); Europe (Germany, France, the United Kingdom, Italy, Spain, Russia, and others); Asia Pacific (China, Japan, India, South Korea, Australia, Indonesia, and others); Latin America (Brazil, Mexico, and others); and the Middle East and Africa. According to the report, Asia Pacific was the largest market for robo taxis.
The Asia Pacific region possesses a vast and densely populated urban landscape, with numerous megacities and rapidly growing urban centers. These cities face challenges of traffic congestion, limited parking space, and increasing demand for efficient transportation solutions. Robo taxis offer a promising remedy to these issues by providing on-demand and shared mobility services, making them an attractive option for the region's urban population. Additionally, the region is home to several technology powerhouses and automotive manufacturers actively investing in autonomous vehicle research and development. These companies are driving innovation and accelerating the deployment of robo taxis in the region. Moreover, supportive government policies and initiatives have fostered a favorable environment for the growth of robo taxis. Governments in countries like China, Japan, and South Korea have expressed interest in advancing autonomous vehicle technology, providing regulatory frameworks, and facilitating testing and deployment of robo taxis on public roads. Furthermore, the region's strong digital infrastructure, high smartphone penetration, and widespread adoption of ride-hailing platforms have created an ideal ecosystem for robo taxi services to thrive. Moreover, the Asia Pacific market's size and diverse demographics provide ample opportunities for service providers to cater to a broad and ever-growing customer base, consolidating its position as the largest market for robo taxis.
Competitive Landscape:
Leading technology companies are heavily investing in research and development to improve autonomous vehicle technology. They conduct extensive testing to enhance safety, efficiency, and scalability, pushing the boundaries of self-driving capabilities. Additionally, companies like Uber and Lyft are expanding their robo taxi fleets to cover more cities and regions. By increasing the availability of robo taxis, they aim to attract more customers and provide a compelling alternative to traditional ride-hailing services. Other than this, key players are forming strategic partnerships and collaborations to leverage each other's strengths. Traditional automakers are teaming up with tech companies to combine automotive expertise with advanced technology, accelerating the development and deployment of robo taxis. Besides this, companies are engaging with governments and regulatory bodies to address policy, safety, and legal challenges. They actively participate in discussions, sharing insights, and providing inputs to shape autonomous vehicle regulations. In line with this, ensuring a seamless and safe customer experience is a priority for robo taxi service providers. Companies are investing in user-friendly mobile apps, customer support, and enhanced safety features to build trust and encourage adoption. Moreover, some players are integrating robo taxi services into broader Mobility as a Service platforms, offering users a seamless combination of various transportation options, from public transit to robo taxis.
The market research report has provided a comprehensive analysis of the competitive landscape in the market. Detailed profiles of all major companies have also been provided. Some of the key players in the market include:
- Aptiv plc
- Continental AG
- Daimler AG
- Ford Motor Company
- NAVYA
- NVIDIA Corporation
- Ridecell Inc
- Waymo LLC (Alphabet Inc.)
Recent Developments:
- Aptiv has entered into a joint venture with Hyundai called Motional. Motional aims to commercialize autonomous driving technology and has been actively working on developing and commercializing autonomous vehicles and systems. Through this joint venture, Aptiv is focused on advancing the development of production-ready autonomous driving systems for the commercialization of Level 4 and 5 self-driving technologies.
- Waymo LLC, a subsidiary of Alphabet Inc. (Google's parent company), has been at the forefront of autonomous vehicle development. It has launched a commercial robo-taxi service called Waymo One in Phoenix, Arizona, allowing users to hail self-driving cars through a mobile app.
Robo Taxi Market Report Scope:
| Report Features | Details |
|---|---|
| Base Year of the Analysis | 2025 |
| Historical Period | 2020-2025 |
| Forecast Period | 2026-2034 |
| Units | Billion USD |
| Scope of the Report | Exploration of Historical Trends and Market Outlook, Industry Catalysts and Challenges, Segment-Wise Historical and Predictive Market Assessment:
|
| Applications Covered | Goods, Passenger |
| Level of Autonomies Covered | Level 4, Level 5 |
| Vehicles Covered | Car, Shuttle/Van |
| Services Covered | Rental, Station-Based |
| Propulsions Covered | Electric, Hybrid, Fuel Cell |
| Regions Covered | Asia Pacific, Europe, North America, Latin America, Middle East and Africa |
| Countries Covered | United States, Canada, Germany, France, United Kingdom, Italy, Spain, Russia, China, Japan, India, South Korea, Australia, Indonesia, Brazil, Mexico |
| Companies Covered | Aptiv plc, Continental AG, Daimler AG, Ford Motor Company, NAVYA, NVIDIA Corporation, Ridecell Inc., Waymo LLC (Alphabet Inc.)., etc. |
| Customization Scope | 10% Free Customization |
| Post-Sale Analyst Support | 10-12 Weeks |
| Delivery Format | PDF and Excel through Email (We can also provide the editable version of the report in PPT/Word format on special request) |
Key Benefits for Stakeholders:
- IMARC’s industry report offers a comprehensive quantitative analysis of various market segments, historical and current market trends, market forecasts, and dynamics of the robo taxi market from 2020-2034.
- The research report provides the latest information on the market drivers, challenges, and opportunities in the global robo taxi market.
- The study maps the leading, as well as the fastest-growing, regional markets. It further enables stakeholders to identify the key country-level markets within each region.
- Porter's five forces analysis assist stakeholders in assessing the impact of new entrants, competitive rivalry, supplier power, buyer power, and the threat of substitution. It helps stakeholders to analyze the level of competition within the robo taxi industry and its attractiveness.
- Competitive landscape allows stakeholders to understand their competitive environment and provides an insight into the current positions of key players in the market.
Frequently Asked Questions About the Robo Taxi Market Report
The global robo taxi market was valued at USD 2.3 Billion in 2025.
The rising concerns towards high greenhouse gas emissions, coupled with the introduction of electric and fuel cell-based technologies, are currently driving the global robo taxi market.
The sudden outbreak of the COVID-19 pandemic had led to the implementation of stringent lockdown regulations across several nations resulting in temporary closure of numerous manufacturing units of robo taxis.
Based on the application, the global robo taxi market can be segmented into goods and passenger. Currently, passenger holds the majority of the total market share.
Based on the level of autonomy, the global robo taxi market has been divided into level 4 and level 5, where level 4 currently exhibits a clear dominance in the market.
Based on the vehicle, the global robo taxi market can be categorized into car and shuttle/van. Currently, car accounts for the majority of the global market share.
Based on the service, the global robo taxi market has been segregated into rental and station-based, where rental service currently exhibits a clear dominance in the market.
Based on the propulsion, the global robo taxi market can be bifurcated into electric, hybrid, and fuel cell. Among these, electric propulsion currently accounts for the largest market share.
On a regional level, the market has been classified into North America, Asia Pacific, Europe, Latin America, and Middle East and Africa, where Asia Pacific currently dominates the global market.
Some of the major players in the global robo taxi market include Aptiv plc, Continental AG, Daimler AG, Ford Motor Company, NAVYA, NVIDIA Corporation, Ridecell Inc, and Waymo LLC (Alphabet Inc.).
Need more help?
- Speak to our experienced analysts for insights on the current market scenarios.
- Include additional segments and countries to customize the report as per your requirement.
- Gain an unparalleled competitive advantage in your domain by understanding how to utilize the report and positively impacting your operations and revenue.
- For further assistance, please connect with our analysts.
 Request Customization
 Speak to an Analyst
 Request Brochure
 Inquire Before Buying
Benefits of Customization
- Personalize this research
- Triangulate with your data
- Get data as per your format and definition
- Gain a deeper dive into a specific application, geography, customer, or competitor
- Any level of personalization
Get in Touch With Us
UNITED STATES
Phone: +1-201-971-6302
INDIA
Phone: +91-120-433-0800
UNITED KINGDOM
Phone: +44-753-714-6104
Email: [email protected]
Client Testimonials


.webp)


