
Scar Treatment Market Report by Product or Treatment Type (Topical Products, Laser Treatment, Surface Treatment, Injectables), Scar Type (Atrophic Scars, Hypertrophic and Keloid Scars, Contracture Scars, and Others), End-User (Hospitals, Clinics, Retail Pharmacies, and Others), and Region 2026-2034
Scar Treatment Market Size:
The global scar treatment market size reached USD 17.7 Billion in 2025. Looking forward, IMARC Group expects the market to reach USD 31.6 Billion by 2034, exhibiting a growth rate (CAGR) of 6.45% during 2026-2034. The market is experiencing steady growth driven by the heightened beauty consciousness among the masses, increasing adoption of cosmetic surgery to enhance facial features, and rising occurrence of accidents and injuries.
|
Report Attribute
|
Key Statistics
|
|---|---|
|
Base Year
|
2025
|
|
Forecast Years
|
2026-2034
|
|
Historical Years
|
2020-2025
|
|
Market Size in 2025
|
USD 17.7 Billion |
|
Market Forecast in 2034
|
USD 31.6 Billion |
| Market Growth Rate 2026-2034 | 6.45% |
Scar Treatment Market Analysis:
- Market Growth and Size: The scar treatment market is experiencing moderate growth, on account of the increasing emphasis on physical appearance, medical advancements, and a diverse range of treatment options.
- Major Market Drivers: Advancements in medical technology, such as regenerative medicine, are key drivers offering effective scar reduction solutions. The rising demand for scar treatment services for both medical and cosmetic purposes, as well as the prevalence of skin trauma and injuries, propels market growth.
- Technological Advancements: Ongoing technological innovations in scar treatment, including laser technology and advanced topical products, are enhancing patient outcomes and driving market expansion.
- Key Market Trends: Trends include the growing interest in non-invasive scar treatments, especially topical products and surface treatments, and preferences for minimal downtime and convenience.
- Geographical Trends: North America dominates the market, supported by advanced healthcare infrastructure and the prominence of cosmetic procedures. However, Asia Pacific is emerging as a fast-growing market on account of the increasing awareness, healthcare investments, and the rising popularity of cosmetic surgeries.
- Competitive Landscape: Key players are investing in research and development (R&D) to introduce innovative scar treatment solutions and expand their global reach. Healthcare providers and clinics are collaborating to enhance accessibility and market presence.
- Challenges and Opportunities: Challenges include the need for continuous research to address scar types with limited treatment options and the affordability of advanced scar treatments. Nonetheless, opportunities for catering to the growing demand for scar reduction services, particularly in emerging markets, and developing cost-effective solutions to reach a wider patient base are projected to overcome these challenges.
To get more information on this market Request Sample
Scar Treatment Market Trends:
Advancements in medical technology
The continuous advancement in medical technology is impelling the growth of the market. Apart from this, there is a profound transformation in scar treatment options, resulting in increased efficacy and reduced invasiveness. A notable breakthrough is the widespread adoption of laser therapy. Laser technology is revolutionizing scar treatment by providing precise, controlled, and minimally invasive procedures. It can target scar tissue with exceptional precision, stimulating collagen production and significantly diminishing the appearance of scars. This innovation is not only improving patient outcomes but also reducing downtime and discomfort. Furthermore, innovations in microdermabrasion techniques are providing patients with non-surgical alternatives for scar reduction. These procedures gently exfoliate the top layer of the skin, diminishing scar prominence and enhancing overall skin texture. The emergence of advanced skin resurfacing technologies, like fractional laser treatments and radiofrequency-based devices, is expanding the scope of scar treatment options. Silicone gel sheets are another significant technological advancement in scar management. These sheets, enriched with silicone-based compounds, are designed to flatten and soften scars, making them less conspicuous.
Rising demand for aesthetic procedures
The growing popularity of aesthetic procedures to improve natural facial features or body aspects among the masses is offering a favorable market outlook. Moreover, in an image-driven society, individuals place a premium on physical appearance and aspire to achieve flawless skin. This cultural shift is leading to a heightened interest in scar treatment procedures, driven not only by medical necessity but also by cosmetic motivations. A significant portion of individuals with scars, whether resulting from surgeries, accidents, or acne, seek scar removal or reduction treatments to boost their self-esteem and confidence. Scar treatment procedures offer them an opportunity to enhance their overall appearance and regain a sense of normalcy. This expanding customer base is driving the demand for effective and painless scar treatment, underscoring the evolving beauty standards and the willingness of people to invest in treatments that improve their self-image and quality of life.
Prevalence of skin trauma and injuries
The demand for scar treatment is driven by the ongoing prevalence of skin trauma and injuries. Accidents, burns, surgical procedures, and various medical conditions continually contribute to a greater number of individuals with visible scars. Scar treatment plays an indispensable role in the recovery process for many of these patients. Surgical incisions, in particular, frequently result in scars, and as medical procedures continue to advance and become more accessible, the need for effective scar treatment remains steadfast. Additionally, the occurrence of accidents and injuries, ranging from minor mishaps to major incidents, ensures a constant stream of patients seeking professional scar treatment services. The scar treatment market is instrumental in addressing both the physical and emotional well-being of individuals affected by scars. Its growth is intrinsically tied to the ongoing incidence of skin trauma and injuries, making it a resilient and indispensable segment within the healthcare industry. With the continued development of innovative treatments, the market is well-positioned for further expansion and improvement of patient outcomes.
Scar Treatment Industry Segmentation:
IMARC Group provides an analysis of the key trends in each segment of the market, along with forecasts at the global, regional, and country levels for 2026-2034. Our report has categorized the market based on product or treatment type, scar type, and end-user.
Breakup by Product or Treatment Type:
To get detailed segment analysis of this market Request Sample
- Topical Products
- Gels
- Creams
- Oils
- Sheets
- Others
- Laser Treatment
- Surface Treatment
- Injectables
Topical products account for the majority of the market share
The report has provided a detailed breakup and analysis of the market based on the product or treatment type. This includes topical products (gel, creams, oils, sheets, and others), laser treatment, surface treatment, and injectables. According to the report, topical products represented the largest segment.
Topical products represent the largest segment in the market. These products are widely favored for their ease of use and accessibility. They include scar gels, creams, oils, silicone gel sheets, and other formulations that can be applied directly to the scarred area. Topical products are popular due to their non-invasive nature and the fact that patients can administer them at home. They work by hydrating and softening scar tissue, which can significantly improve the appearance of scars over time. The market for topical scar treatments continues to expand with ongoing product innovations and a growing consumer preference for non-surgical options.
Laser therapy involves the use of laser technology to target scar tissue beneath the surface of the skin. Lasers can precisely stimulate collagen production, reducing the appearance of scars. This method is appreciated for its effectiveness and minimal downtime, making it a preferred choice for those seeking faster results with minimal invasiveness. Laser treatment remains in demand due to its ability to treat a variety of scar types, including acne scars and surgical scars.
Surface treatments encompass a range of procedures like microdermabrasion, chemical peels, and dermabrasion that focus on the top layer of the skin. These treatments exfoliate and resurface the skin, which can lead to a reduction in the appearance of scars. Surface treatments are valued for their ability to improve skin texture and are often chosen for scars that are closer to the surface of the skin or for patients looking for a less invasive option.
Injectables involve the use of substances like corticosteroids or hyaluronic acid to treat certain types of scars, particularly hypertrophic and keloid scars. They work by reducing inflammation and promoting collagen remodeling. They provide a valuable option for specific scar types that may not respond as effectively to other treatments.
Breakup by Scar Type:
- Atrophic Scars
- Hypertrophic And Keloid Scars
- Contracture Scars
- Others
Atrophic scars hold the largest share in the industry
A detailed breakup and analysis of the market based on the scar type have also been provided in the report. This includes atrophic scars, hypertrophic and keloid scars, contracture scars, and others. According to the report, atrophic scars accounted for the largest market share.
Atrophic scars are characterized by a loss of skin tissue and are commonly associated with conditions like acne or chickenpox. The market for atrophic scar treatment includes various modalities, such as topical products, laser therapy, and dermal fillers. Topical products like creams and gels are often used to improve skin texture and stimulate collagen production, making them a popular choice for addressing atrophic scars. Laser therapy can also be effective in promoting collagen remodeling, which can help reduce the depth and visibility of atrophic scars. The demand for treatments addressing atrophic scars is driven by the desire for smoother, more even skin texture.
The hypertrophic and keloid scars are characterized by excess collagen production, leading to raised and often itchy or painful scar tissue. Treatment options for hypertrophic and keloid scars typically include topical products, corticosteroid injections, laser therapy, and surgical excision. Corticosteroid injections can help flatten and soften these scars, while laser therapy can reduce the redness and discomfort associated with them. The demand for treatments targeting hypertrophic and keloid scars is fueled by the need to alleviate physical discomfort and improve the appearance of raised scars.
Contracture scars are caused by burns or injuries that result in skin tightening and restricted movement. Treatment options for contracture scares include surgical scar revision, laser therapy, and physical therapy. Surgical scar revision can help release tight bands of scar tissue, restoring range of motion and improving the appearance of the scar. The demand for contracture scar treatments is driven by the desire to enhance both physical function and aesthetics, particularly in cases where scars impede movement.
Breakup by End-User:
- Hospitals
- Clinics
- Retail Pharmacies
- Others
Hospitals represent the leading market segment
The report has provided a detailed breakup and analysis of the market based on the end-user. This includes hospitals, clinics, retail pharmacies, and others. According to the report, hospitals represented the largest segment.
Hospitals constitute the largest segment as they are crucial in scar treatment, particularly for patients with severe or complex scars resulting from surgeries, accidents, or burns. Hospitals have access to advanced medical equipment, surgical facilities, and a team of specialized healthcare professionals, making them well-equipped to offer comprehensive scar treatment services. These services often include surgical scar revision, laser therapy, and other advanced procedures.
Clinics offer outpatient services for scar treatment, catering to individuals with less severe or more common scar issues. Clinics can provide treatments, such as topical products, surface treatments like microdermabrasion or chemical peels, and injectable therapies. Patients often prefer clinics for their convenience, shorter waiting times, and accessibility.
Retail pharmacies offer over-the-counter (OTC) scar treatment products, such as creams, gels, and silicone sheets. While they do not provide specialized medical procedures, retail pharmacies play a crucial role in making scar treatment products readily available to consumers. Many individuals with minor scars prefer to start with OTC products, and retail pharmacies cater to this market segment by offering a wide variety of scar treatment options.
Breakup by Region:
To get more information on the regional analysis of this market Request Sample
- Asia Pacific
- China
- Japan
- India
- South Korea
- Australia
- Indonesia
- Others
- North America
- United States
- Canada
- Europe
- Germany
- France
- United Kingdom
- Italy
- Spain
- Russia
- Others
- Latin America
- Brazil
- Mexico
- Argentina
- Colombia
- Chile
- Peru
- Others
- Middle East and Africa
- Turkey
- Saudi Arabia
- Iran
- United Arab Emirates
- Others
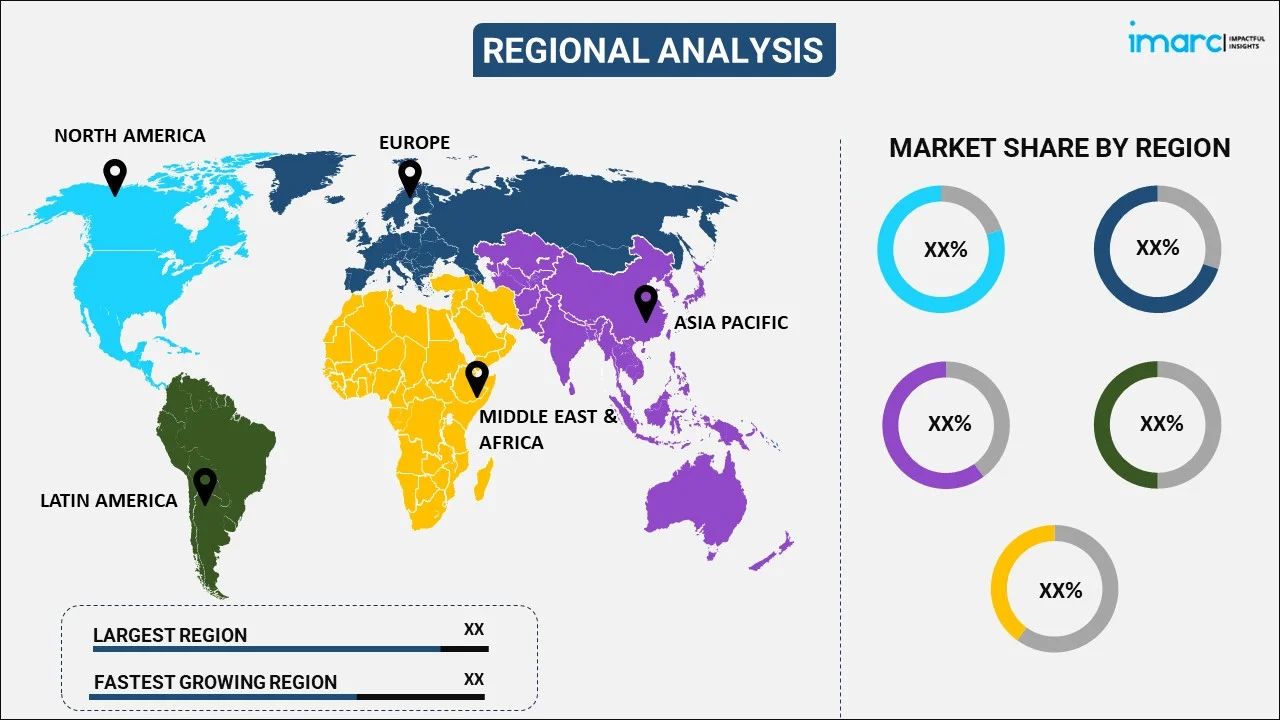
North America leads the market, accounting for the largest scar treatment market share
The market research report has also provided a comprehensive analysis of all the major regional markets, which include Asia Pacific (China, Japan, India, South Korea, Australia, Indonesia, and others); North America (the United States and Canada); Europe (Germany, France, the United Kingdom, Italy, Spain, Russia, and others); Latin America (Brazil, Mexico, Argentina, Colombia, Chile, Peru, and others); and the Middle East and Africa (Turkey, Saudi Arabia, Iran, United Arab Emirates, and others). According to the report, North America accounted for the largest market share.
The North America scar treatment market is driven by the existence of advanced healthcare infrastructure, including state-of-the-art medical facilities and skilled healthcare professionals. This infrastructure enables the adoption of cutting-edge scar treatment technologies and attracts patients seeking high-quality care.
Asia Pacific maintains a strong presence driven by the growing availability of cost-effective scar treatment options. This trend is driving international patients to seek affordable yet quality scar treatment services.
Europe stands as another key region in the market, driven by the strong focus on technological advancements in scar treatment. Innovative therapies, such as fractional laser treatments and regenerative medicine approaches, are gaining traction, attracting both patients and investors.
Latin America exhibits growing potential in the scar treatment market, fueled by the growing demand for scar treatments, especially among individuals seeking to enhance their physical appearance.
The Middle East and Africa region show a developing market for scar treatment, driven by the increasing incidences of conditions like hypertrophic and keloid scars, often related to skin pigmentation and genetics among the masses.
Leading Key Players in the Scar Treatment Industry:
The key players in the scar treatment market are actively engaged in various strategic initiatives to maintain and expand their market presence. These initiatives include research and development (R&D) efforts to introduce innovative scar treatment technologies and products, such as advanced laser therapies and regenerative medicine approaches. Additionally, major players are focusing on geographical expansion, entering emerging markets, where the demand for scar treatment services is growing. Marketing and promotional activities to raise awareness among consumers about the benefits of scar treatment are also a priority. Furthermore, partnerships and collaborations with healthcare providers and clinics are being forged to enhance the accessibility of scar treatment services. Overall, top companies are committed to meeting the evolving needs of patients and maintaining their positions as leaders in the scar treatment industry.
The market research report has provided a comprehensive analysis of the competitive landscape. Detailed profiles of all major companies have also been provided. Some of the key players in the market include:
- Alliance Pharma PLC
- AVITA Medical Ltd.
- Bausch Health Companies Inc.
- Cutera, Inc.
- Establishment Labs SA
- GC Aesthetics PLC
- Hologic Inc.
- Mölnlycke Health Care AB
- Smith & Nephew PLC
- Sonoma Pharmaceuticals Inc.
(Please note that this is only a partial list of the key players, and the complete list is provided in the report.)
Latest News:
- March 2022: Alliance Pharma PLC announced the acquisition of silicone-based scar treatment brand ScarAway in the US to expand its consumer base.
- September 2023: Cutera Inc. announced the launch of Secret DUO, an innovative skin resurfacing and revitalization platform that utilizes dual non-ablative fractional technologies.
Scar Treatment Market Report Scope:
| Report Features | Details |
|---|---|
| Base Year of the Analysis | 2025 |
| Historical Period | 2020-2025 |
| Forecast Period | 2026-2034 |
| Units | Billion USD |
| Scope of the Report | Exploration of Historical Trends and Market Outlook, Industry Catalysts and Challenges, Segment-Wise Historical and Future Market Assessment:
|
| Product or Treatment Types Covered |
|
| Scar Types Covered | Atrophic Scars, Hypertrophic and Keloid Scars, Contracture Scars, Others |
| End-Users Covered | Hospitals, Clinics, Retail Pharmacies, Others |
| Regions Covered | Asia Pacific, Europe, North America, Latin America, Middle East and Africa |
| Countries Covered | United States, Canada, Germany, France, United Kingdom, Italy, Spain, Russia, China, Japan, India, South Korea, Australia, Indonesia, Brazil, Mexico, Argentina, Colombia, Chile, Peru, Turkey, Saudi Arabia, Iran, United Arab Emirates |
| Companies Covered | Alliance Pharma PLC, AVITA Medical Ltd., Bausch Health Companies Inc., Cutera, Inc., Establishment Labs SA, GC Aesthetics PLC, Hologic Inc., Mölnlycke Health Care AB, Smith & Nephew PLC, Sonoma Pharmaceuticals Inc., etc. |
| Customization Scope | 10% Free Customization |
| Post-Sale Analyst Support | 10-12 Weeks |
| Delivery Format | PDF and Excel through Email (We can also provide the editable version of the report in PPT/Word format on special request) |
Key Benefits for Stakeholders:
- IMARC’s industry report offers a comprehensive quantitative analysis of various market segments, historical and current market trends, market forecasts, and dynamics of the scar treatment market from 2020-2034.
- The research report provides the latest information on the market drivers, challenges, and opportunities in the global scar treatment market.
- The study maps the leading, as well as the fastest-growing, regional markets. It further enables stakeholders to identify the key country-level markets within each region.
- Porter's five forces analysis assists stakeholders in assessing the impact of new entrants, competitive rivalry, supplier power, buyer power, and the threat of substitution. It helps stakeholders to analyze the level of competition within the scar treatment industry and its attractiveness.
- The competitive landscape allows stakeholders to understand their competitive environment and provides insight into the current positions of key players in the market.
Frequently Asked Questions About the Scar Treatment Market Report
The global scar treatment market was valued at USD 17.7 Billion in 2025.
We expect the global scar treatment market to exhibit a CAGR of 6.45% during 2026-2034.
The sudden outbreak of the COVID-19 pandemic had led to the postponement of elective cosmetic surgeries for scar treatment to reduce the risk of the coronavirus infection among the patients upon hospital visits and interaction with healthcare professionals or medical equipment.
The rising prevalence of various skin diseases, along with the increasing adoption of numerous laser instruments for reducing the visibility of scars after critical injuries, while ensuring a painless experience for the patient, is primarily driving the global scar treatment market.
Based on the product or treatment type, the global scar treatment market can be categorized topical products, laser treatment, surface treatment, and injectables. Currently, topical products hold the majority of the total market share.
Based on the scar type, the global scar treatment market has been segmented into atrophic scars, hypertrophic and keloid scars, contracture scars, and others. Among these, atrophic scars exhibit a clear dominance in the market.
Based on the end-user, the global scar treatment market can be bifurcated into hospitals, clinics, retail pharmacies, others. Currently, hospitals account for the largest market share.
On a regional level, the market has been classified into Asia Pacific, North America, Europe, Latin America, and Middle East and Africa, where North America currently dominates the global market.
Some of the major players in the global scar treatment market include Alliance Pharma PLC, AVITA Medical Ltd., Bausch Health Companies Inc., Cutera, Inc., Establishment Labs SA, GC Aesthetics PLC, Hologic Inc., Mölnlycke Health Care AB, Smith & Nephew PLC, Sonoma Pharmaceuticals Inc., etc.
Need more help?
- Speak to our experienced analysts for insights on the current market scenarios.
- Include additional segments and countries to customize the report as per your requirement.
- Gain an unparalleled competitive advantage in your domain by understanding how to utilize the report and positively impacting your operations and revenue.
- For further assistance, please connect with our analysts.
 Request Customization
 Speak to an Analyst
 Request Brochure
 Inquire Before Buying
Benefits of Customization
- Personalize this research
- Triangulate with your data
- Get data as per your format and definition
- Gain a deeper dive into a specific application, geography, customer, or competitor
- Any level of personalization
Get in Touch With Us
UNITED STATES
Phone: +1-201-971-6302
INDIA
Phone: +91-120-433-0800
UNITED KINGDOM
Phone: +44-753-714-6104
Email: [email protected]
Client Testimonials


.webp)


