
Self-Organizing Network Market Size, Share, Trends and Forecast by Offering, Network Infrastructure, Architecture, Network Technology, Application, and Region, 2026-2034
Self-Organizing Network Market Size, Share, Trends & Forecast (2026-2034)
The global self-organizing network market reached USD 7.0 Billion in 2025 and is projected to reach USD 14.6 Billion by 2034, growing at a CAGR of 8.36% during 2026-2034. The market is driven by the rapid expansion of 5G networks, increasing network complexity, and rising demand for automated network management solutions. Software dominates at 66.4%. North America leads with 37.5% market share. Centralized Self-Organizing Networks account for 46.8% of the market. The global surge in 5G deployment has been a primary catalyst, triggering unprecedented investment in intelligent network optimization platforms and AI-driven automation tools globally.
Market Snapshot
|
Metric |
Value |
|
Market Size (2025) |
USD 7.0 Billion |
|
Forecast Market Size (2034) |
USD 14.6 Billion |
|
CAGR (2026-2034) |
8.36% |
|
Base Year |
2025 |
|
Historical Period |
2020-2025 |
|
Forecast Period |
2026-2034 |
|
Dominant Offering |
Software (66.4%, 2025) |
|
Dominant Architecture |
Centralized Self-Organizing Networks (46.8%, 2025) |
|
Leading Region |
North America (37.5%, 2025) |
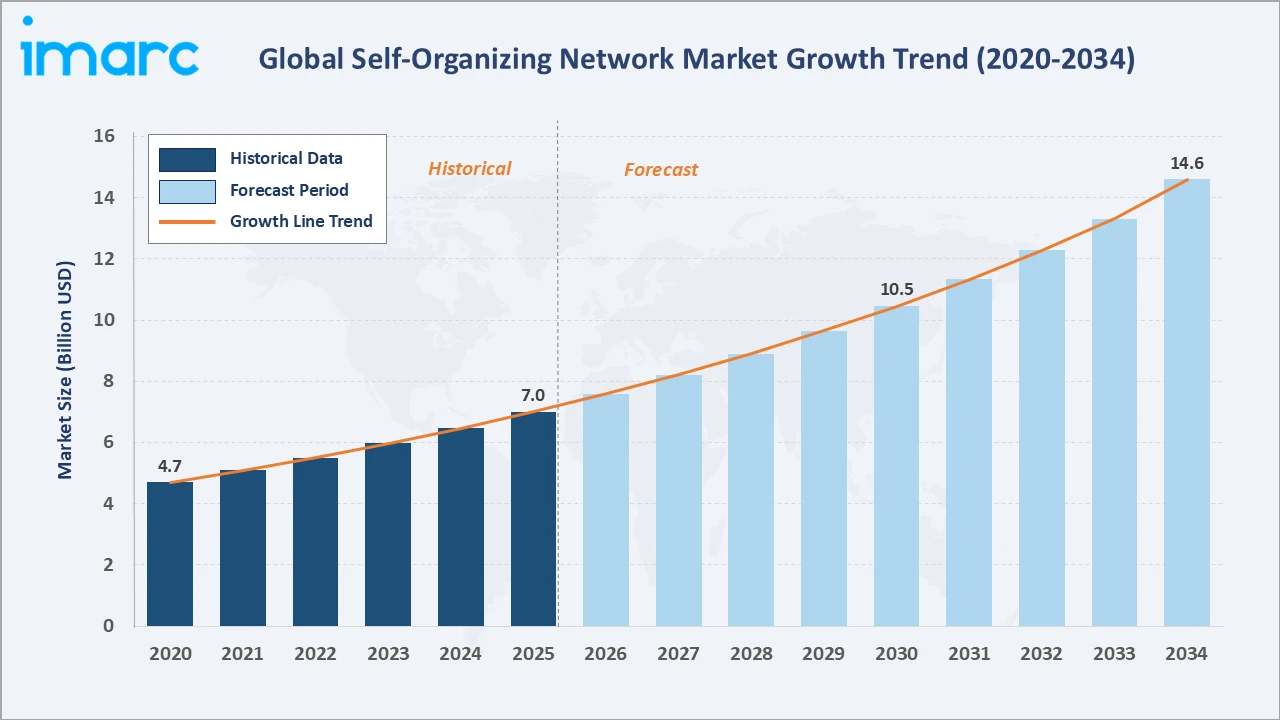
The global self-organizing network market expanded from USD 4.7 Billion in 2020 to USD 7.0 Billion in 2025, anchored at USD 10.4 Billion in 2030, and forecast to reach USD 14.6 Billion by 2034. The accelerating global 5G rollout created unprecedented demand for intelligent self-organizing capabilities. The AI-driven network automation market momentum sustained above-trend SON market growth through 2022-2025.
To get more information on this market, Request Sample
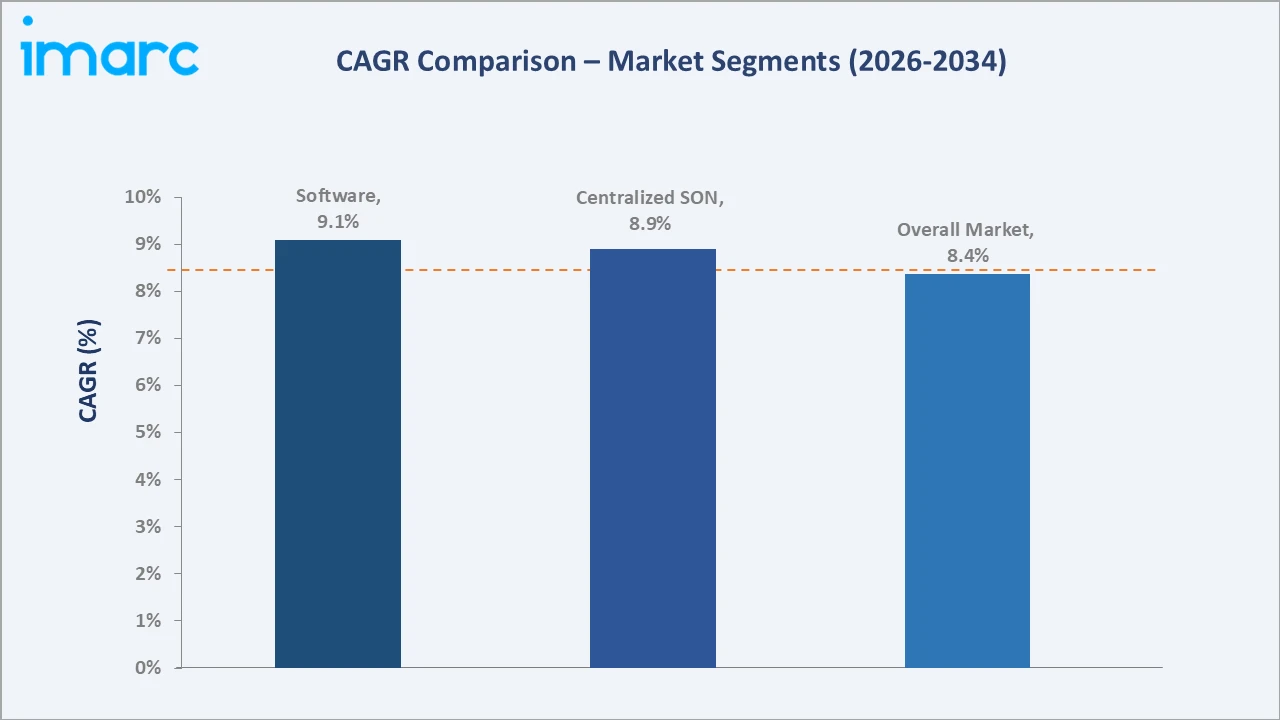
Software segment grows fastest at ~9.1% CAGR as AI and machine learning integration expands self-organizing network capabilities into cloud-native and open RAN environments. Centralized SON architectures grow at ~8.9% CAGR through large-scale network automation economics for major telecom operators.
Executive Summary
The global self-organizing network market reached USD 7.0 Billion in 2025, representing one of the most dynamic intersections of telecommunications, artificial intelligence, and network automation. The market encompasses SON software platforms, optimization algorithms, analytics tools, and managed services that enable networks to automatically configure, optimize, and heal themselves.
Software at 66.4% dominates through the centralization of intelligence in cloud-native SON platforms. Centralized SON architectures at 46.8% lead through the operational efficiency advantages of unified network intelligence. North America, at 37.5%, leads through the aggressive 5G spectrum deployment and early adoption of AI-driven network automation.
Key Market Insights
|
Insight |
Data |
|
Dominant Offering |
Software – 66.4% share (2025) |
|
Dominant Architecture |
Centralized Self-Organizing Networks – 46.8% market share (2025) |
|
Leading Region |
North America – 37.5% market share |
|
Market Opportunity |
AI-native SON platforms; open RAN SON integration; private 5G networks; emerging market 5G deployments |
Key Analytical Observations Supporting the Above Data:
- Software at 66.4%: The software segment dominates because intelligence-driven automation and AI-based optimization reside in software platforms. These solutions enable operators to automatically configure network parameters, balance load, optimize coverage, and self-heal failures without manual intervention, reducing operational costs significantly.
- Centralized Self-Organizing Networks at 46.8%: Centralized SON architecture dominates due to superior network-wide visibility and coordinated optimization capabilities. These architectures enable unified radio resource management, interference coordination, and capacity optimization across entire network domains from a single intelligence hub.
- North America at 37.5%: North America leads through early 5G spectrum deployment, substantial telecom operator investment in network automation, and the presence of leading SON technology vendors. The US FCC C-band and mmWave 5G deployments have created strong demand for intelligent network optimization platforms.
Self-Organizing Network Market Overview
The global self-organizing network market encompasses AI-driven software, analytics platforms, and managed services that enable mobile networks to automatically configure, optimize, and self-heal. The market covers self-configuration (SON), self-optimization (SON), and self-healing (SON) functions across 2G, 3G, 4G/LTE, and 5G network generations.
Macroeconomic factors include the global rollout of 5G networks requiring advanced automation, growing mobile data consumption exceeding network planning capacity, and increasing network densification through small cell deployment. In addition, operator pressure to reduce operating expenditures while improving network quality is accelerating SON platform adoption worldwide.
Market Dynamics
To evaluate market opportunities, Request Sample
Market Drivers
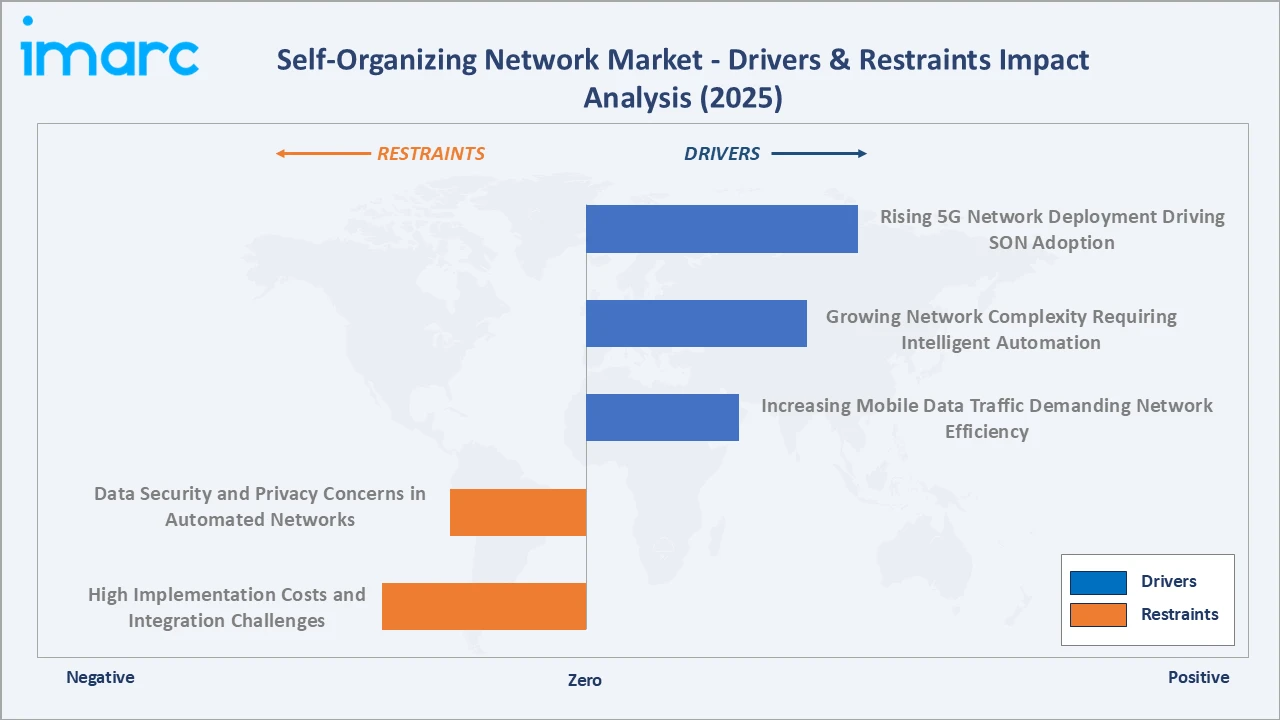
- Rising 5G Network Deployment Driving SON Adoption: The global rollout of 5G networks is creating massive demand for self-organizing capabilities to manage dense heterogeneous network environments. 5G networks require dynamic spectrum management, beam management, and inter-cell coordination that SON platforms enable automatically. Telecom operators are integrating SON solutions to manage thousands of small cells, macro sites, and virtualized network functions efficiently.
- Growing Network Complexity Requiring Intelligent Automation: Modern telecom networks have evolved into complex multi-layer, multi-technology environments spanning 4G, 5G, Wi-Fi, and small cells. Manual network management cannot scale to handle millions of parameter combinations required for optimal performance. SON platforms automate complex optimization tasks, reducing operational costs while improving network quality and customer experience.
- Cost Optimization Through Automated Network Management: Telecom operators face intense pressure to reduce operating expenditures while expanding network capacity. SON platforms reduce field engineer visits through remote self-configuration, minimize energy consumption through intelligent power management, and optimize spectrum utilization through automated frequency planning. These economic benefits are driving widespread SON platform adoption globally.
- Increasing Mobile Data Traffic Demanding Network Efficiency: Global mobile data traffic is growing at over 30% annually, driven by video streaming, IoT, and cloud applications. SON platforms enable networks to dynamically allocate capacity, balance load across cells, and optimize handover parameters to handle surging traffic efficiently. As data demands intensify, SON becomes essential infrastructure for maintaining network quality.
Market Restraints
- High Implementation Costs and Integration Challenges: Deploying SON solutions requires substantial investment in platform licensing, system integration, and network-wide data collection infrastructure. Multi-vendor network environments create complex integration challenges where SON solutions from one vendor may not seamlessly communicate with RAN equipment from another. These barriers slow adoption particularly among smaller regional operators with limited capital budgets.
- Data Security and Privacy Concerns in Automated Networks: SON platforms collect and analyze extensive network performance data, subscriber experience metrics, and location information. Regulatory requirements around data localization, privacy compliance, and cybersecurity create barriers for cloud-based SON deployments. Operators must ensure that AI-driven network decisions do not create security vulnerabilities or expose sensitive subscriber data.
- Interoperability Issues Across Multi-Vendor Network Environments: Most telecom networks use equipment from multiple vendors, creating interoperability challenges for SON implementations. Proprietary interfaces and lack of standardized SON data models prevent seamless optimization across vendor boundaries. While 3GPP and O-RAN Alliance standards are improving interoperability, full multi-vendor SON integration remains technically challenging and deployment-limiting.
Market Opportunities
- Open RAN Architecture Enabling Vendor-Neutral SON Deployment: The Open RAN movement is creating new opportunities for software-defined SON solutions that operate independently of underlying hardware vendors. Open RAN RIC (RAN Intelligent Controller) platforms provide standardized interfaces for SON applications, enabling operators to deploy best-of-breed automation solutions across multi-vendor networks. This ecosystem is creating new market opportunities for specialized SON software vendors.
- Private 5G Network Expansion Creating Enterprise SON Market: Industrial enterprises, ports, airports, and smart factories are deploying private 5G networks requiring intelligent self-management capabilities. These networks demand automated configuration, security-aware optimization, and self-healing capabilities similar to public networks but tailored for mission-critical industrial applications. Private 5G SON represents a high-growth segment with premium pricing potential.
Market Challenges
- Standardization Gaps Across Diverse SON Implementations: SON implementations vary significantly across vendors in terms of algorithms, optimization objectives, and management interfaces. The absence of universal performance benchmarks makes it difficult for operators to objectively compare SON solution effectiveness. This standardization gap complicates procurement decisions and limits operators' ability to measure return on SON investments accurately.
- AI Model Training and Data Quality Dependencies: Advanced SON platforms rely on machine learning models that require high-quality, comprehensive network data for training and operation. Data quality issues, missing performance counters, and insufficient training datasets can degrade SON optimization effectiveness. Ensuring continuous, high-quality data pipelines across complex network environments represents a significant operational challenge for SON deployments.
Emerging Market Trends
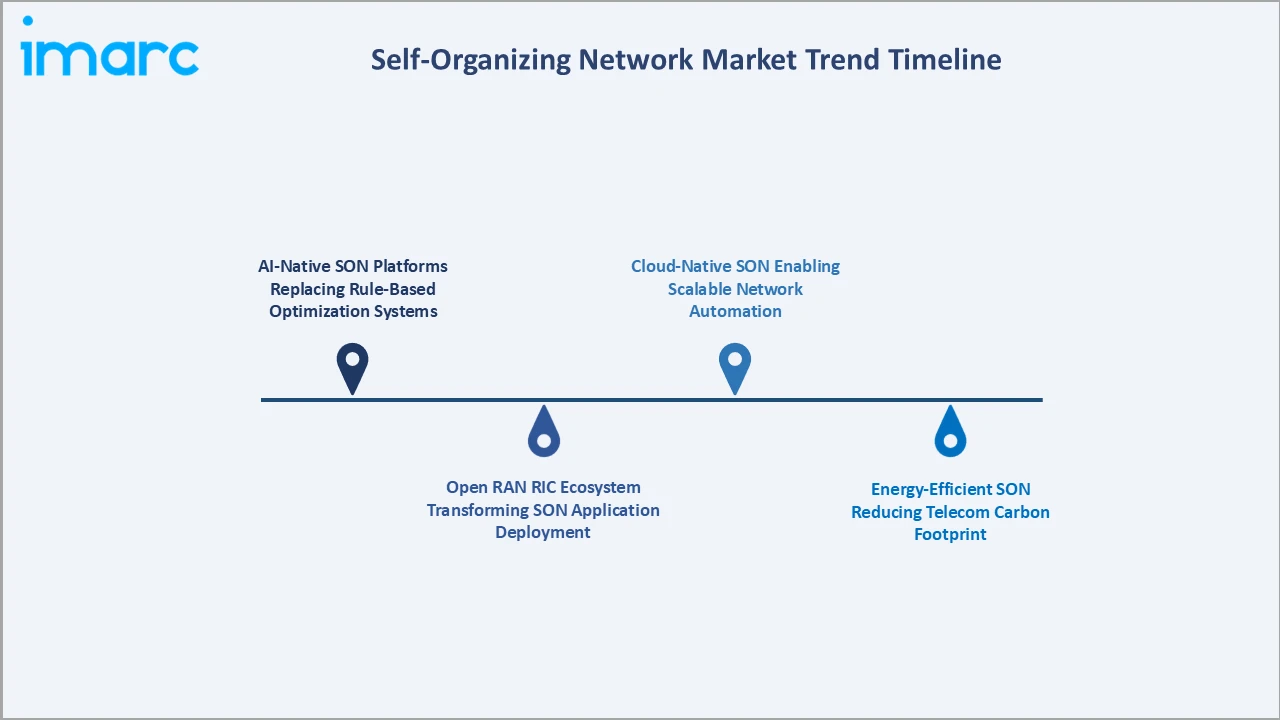
1. AI-Native SON Platforms Replacing Rule-Based Optimization Systems
AI-native SON platforms are replacing traditional rule-based systems with deep learning models that continuously adapt to network conditions. These platforms use reinforcement learning algorithms to discover optimal network configurations that cannot be determined through manual rule creation. AI-native SON achieves 15-25% improvement in network KPIs while reducing parameter update cycles from days to minutes.
2. Open RAN RIC Ecosystem Transforming SON Application Deployment
The Open RAN RAN Intelligent Controller platform is creating a standardized application ecosystem for SON functions. Near-RT RIC xApps enable real-time radio optimization while Non-RT RIC rApps handle longer-horizon policy and machine learning model management. This open ecosystem is attracting new SON software developers and enabling operators to compose best-of-breed optimization solutions.
3. Energy-Efficient SON Reducing Telecom Carbon Footprint
Energy optimization is becoming a primary SON use case as telecom operators target carbon neutrality goals. SON platforms dynamically switch off redundant radio units during low-traffic periods, optimize transmission power, and coordinate sleep scheduling across network layers. These capabilities reduce base station energy consumption by 15-30% while maintaining service quality requirements.
4. Cloud-Native SON Enabling Scalable Network Automation
Cloud-native SON architectures are replacing monolithic network management systems with containerized, microservices-based platforms. These architectures enable elastic scaling of SON processing capacity, continuous software updates without service disruption, and multi-cloud deployment flexibility. Cloud-native SON platforms accelerate feature deployment cycles and reduce total cost of ownership.
Industry Value Chain Analysis
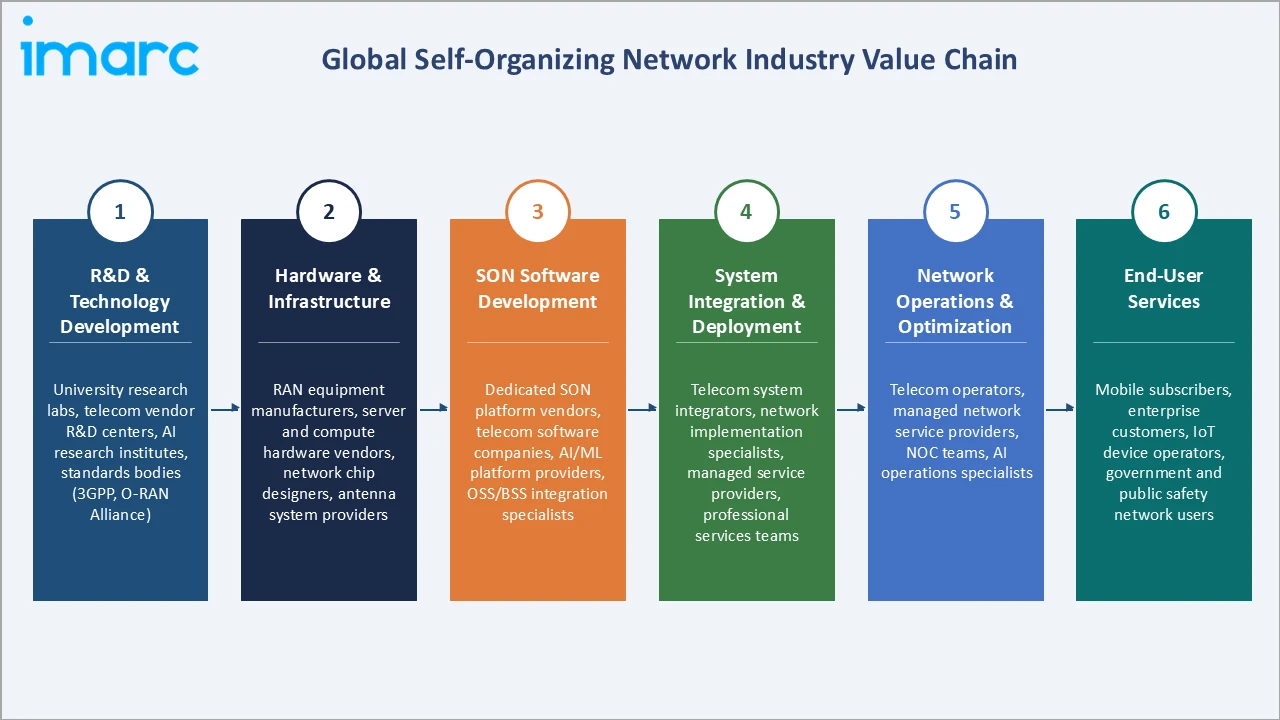
The self-organizing network value chain integrates semiconductor and hardware manufacturing, network equipment production, SON software development, system integration and deployment, managed operations services, and continuous performance optimization to deliver automated network intelligence to telecom operators worldwide.
|
Stage |
Key Participants |
|
R&D & Technology Development |
University research labs, telecom vendor R&D centers, AI research institutes, standards bodies (3GPP, O-RAN Alliance) |
|
Hardware & Infrastructure |
RAN equipment manufacturers, server and computer hardware vendors, network chip designers, antenna system providers |
|
SON Software Development |
Dedicated SON platform vendors, telecom software companies, AI/ML platform providers, OSS/BSS integration specialists |
|
System Integration & Deployment |
Telecom system integrators, network implementation specialists, managed service providers, professional services teams |
|
Network Operations & Optimization |
Telecom operators, managed network service providers, network operations center (NOC) teams, AI operations specialists |
|
End-User Services |
Mobile subscribers, enterprise customers, IoT device operators, government and public safety network users |
The SON software development stage is the value chain's most commercially differentiated phase. The system integration layer creates critical service revenue for both independent integrators and vendor professional services organizations. The managed operations phase sustains recurring revenue streams for SON vendors while delivering continuous network performance improvement.
Technology Landscape in the Self-Organizing Network Industry
AI and Machine Learning Integration in SON
AI and machine learning integration is transforming SON from rule-based to adaptive optimization. Reinforcement learning algorithms enable SON systems to discover optimal network configurations through trial-and-error interaction with the network environment. Deep neural networks predict traffic patterns and proactively adjust network parameters before congestion occurs, improving quality of experience metrics.
Cloud-Native and Virtualized SON Architecture
Cloud-native SON architectures utilize containerization, microservices, and Kubernetes orchestration to deliver scalable, resilient network optimization platforms. Virtualized SON functions run as software instances on standard commercial off-the-shelf hardware, reducing infrastructure costs and enabling flexible capacity scaling. Multi-cloud deployments provide geographic redundancy and processing proximity to network nodes.
O-RAN RIC Platform Technology
The O-RAN RAN Intelligent Controller architecture provides standardized interfaces for deploying SON applications across multi-vendor RAN environments. The Near-RT RIC enables sub-second radio optimization through standardized E2 interface connections to RAN nodes. The Non-RT RIC manages AI model lifecycle, policy configuration, and longer-horizon network optimization through the A1 interface.
Market Segmentation Analysis
The report covers the following segments:
|
Segment Category |
Leading Segment |
Market Share |
Year |
|
Offering |
Software |
66.4% |
2025 |
|
Network Infrastructure |
🔒 |
🔒 |
2025 |
|
Architecture |
Centralized Self-Organizing Networks |
46.8% |
2025 |
|
Network Technology |
2G/3G |
🔒 |
2025 |
|
Application |
Authentication and Network Security |
🔒 |
2025 |
|
Region |
North America |
37.5% |
2025 |

By Offering
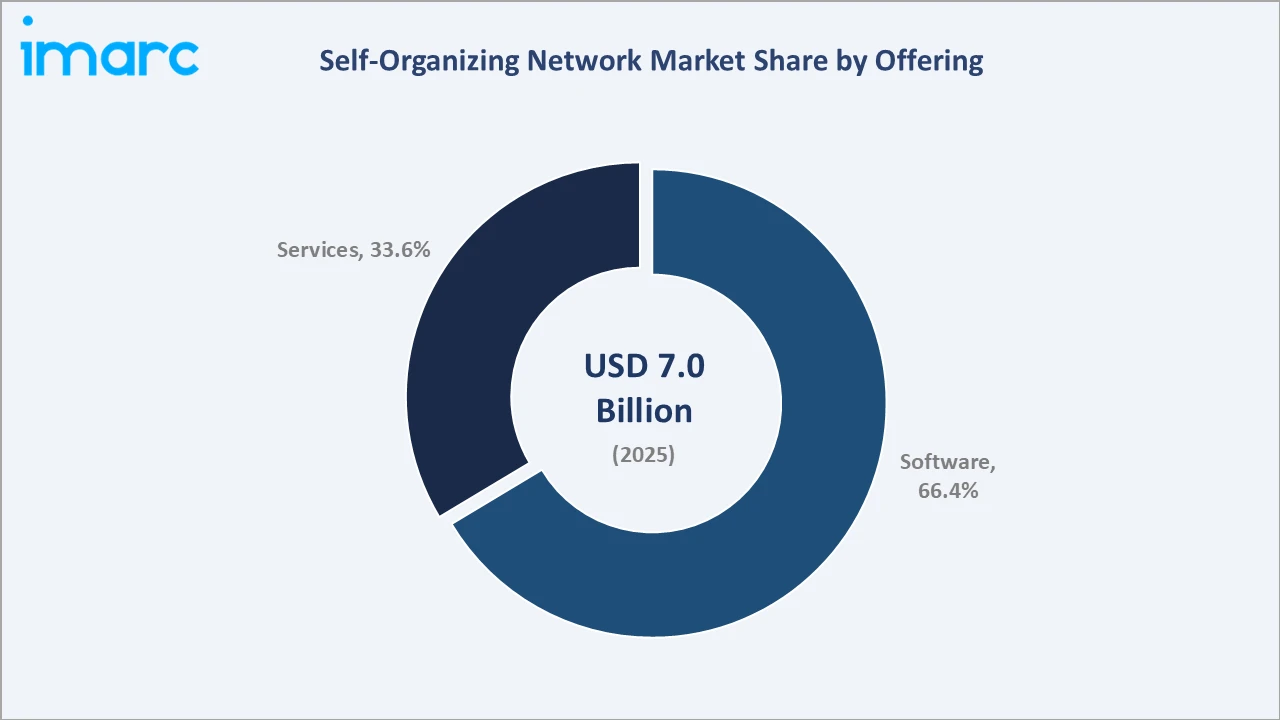
Software leads at 66.4% (2025). The software segment encompasses AI-driven SON optimization platforms, network analytics engines, self-configuration algorithms, and cloud-native automation suites. Software dominates because the core value of SON solutions resides in intelligent algorithms and data analytics platforms rather than hardware components. Software's ~9.1% CAGR reflects accelerating AI integration and cloud-native platform adoption across global telecom operators.
To access detailed market analysis, Request Sample
Services at 33.6% grow at ~7.4% CAGR through expanding managed optimization contracts and professional services for SON implementation and AI model customization. Services revenue is driven by operator demand for expert support in deploying and fine-tuning SON platforms across complex multi-vendor 5G network environments where internal expertise remains limited.
By Architecture
Centralized Self-Organizing Networks lead at 46.8% (2025). The centralized SON architecture concentrates network intelligence in a single or geographically clustered management platform with network-wide visibility across all cells and layers. This architecture enables coordinated inter-cell optimization, global interference management, and macro-level capacity planning. Centralized SON's ~8.9% CAGR reflects operator preference for unified intelligence platforms in large-scale 5G deployments.
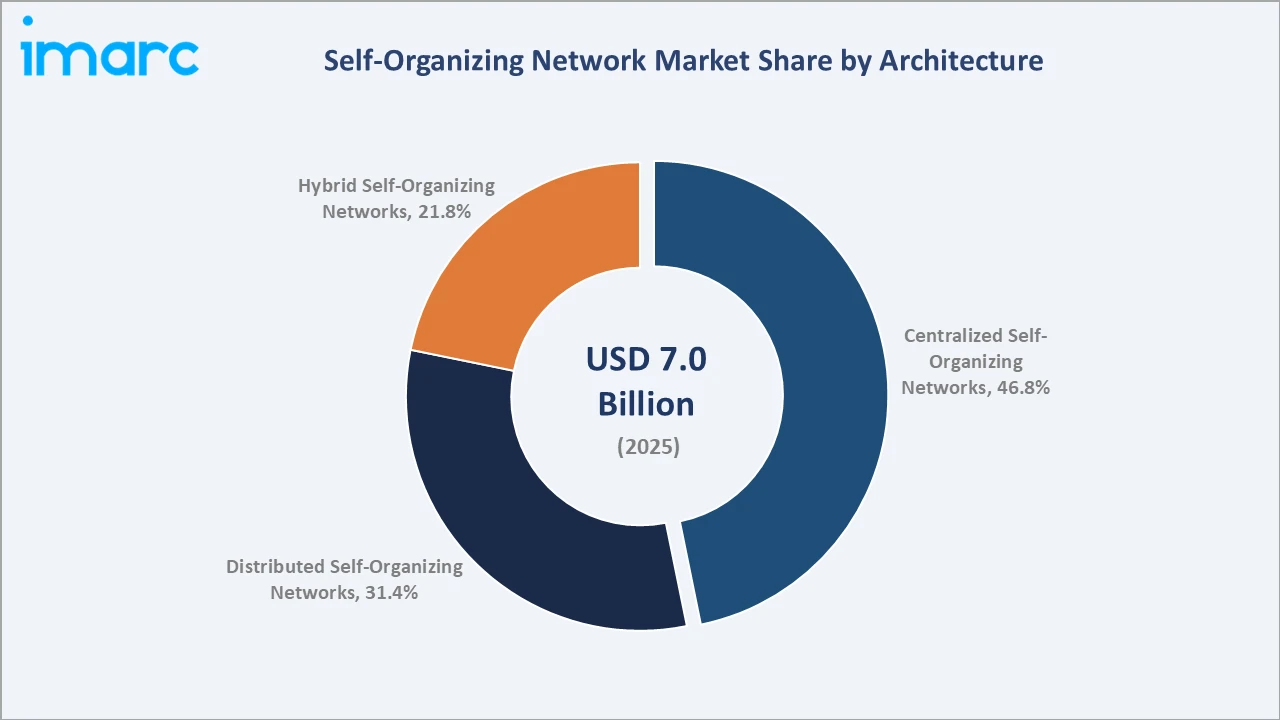
Distributed Self-Organizing Networks at 31.4% grow at ~8.2% CAGR through adoption in ultra-dense small cell deployments where low-latency local optimization is critical for real-time radio resource management. Hybrid Self-Organizing Networks at 21.8% grow fastest at ~7.8% CAGR as operators adopt architectures combining centralized policy coordination with distributed real-time execution, representing the emerging standard for 5G autonomous network deployments.
Regional Market Insights
|
Region |
Share (2025) |
Key Self-Organizing Network Market Drivers & Characteristics |
|
North America |
37.5% |
Driven by aggressive 5G spectrum deployment, substantial telecom operator investment in network automation, and presence of leading SON technology vendors. |
|
Asia Pacific |
30.4% |
Driven by massive 5G infrastructure buildout in China, Japan, South Korea, and India, creating large-scale demand for intelligent network optimization platforms. |
|
Europe |
20.8% |
Driven by strong 5G rollout momentum, regulatory focus on network sharing and spectrum efficiency, and operator investment in energy-efficient network automation. |
|
Latin America |
6.4% |
Supported by 4G network optimization requirements, emerging 5G deployment, and operator interest in cost-reduction through automated network management solutions. |
|
Middle East and Africa |
4.9% |
Driven by government-supported 5G investment programs, smart city initiatives, and increasing demand for network performance in rapidly growing mobile markets. |
North America's 37.5% market leadership is anchored by US operator 5G investment exceeding USD 35 billion annually and the strategic priority placed on network automation to manage complex multi-band 5G deployments. Asia-Pacific's 30.4% reflects China's world-leading 5G base station deployment exceeding 3 million sites and South Korea's advanced network automation initiatives.
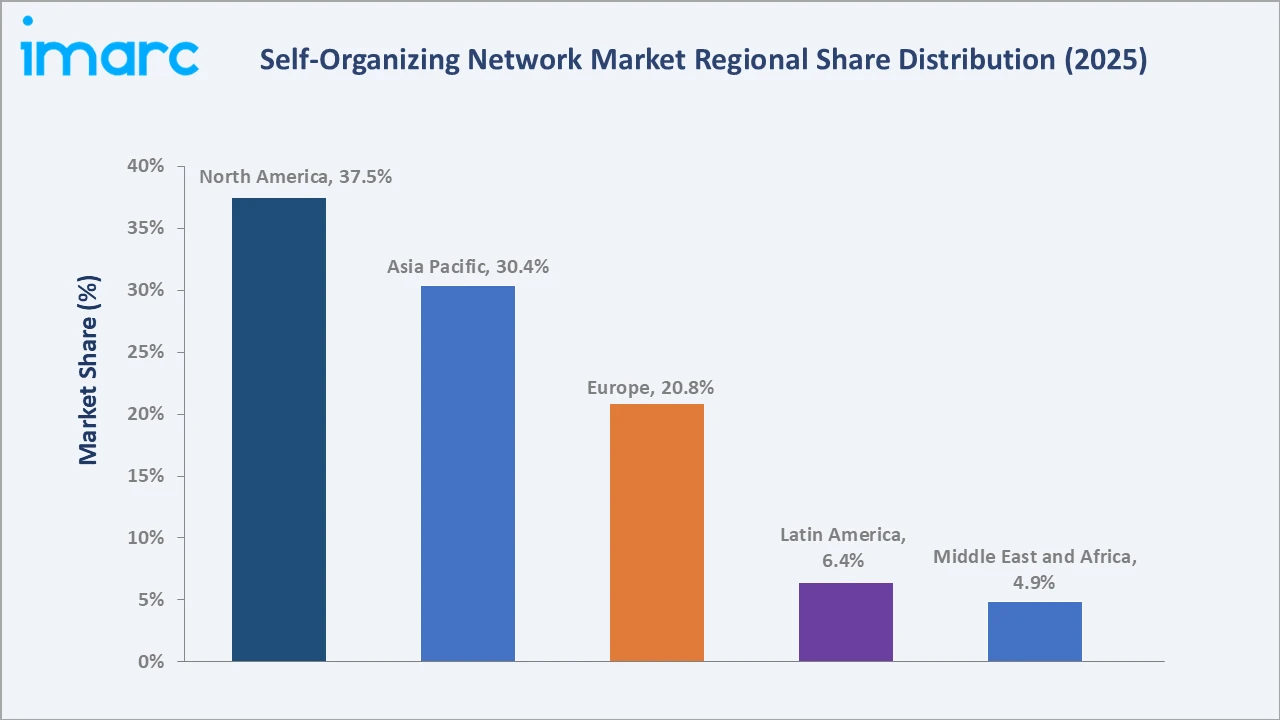
Europe's 20.8% reflects strong operator focus on network sharing and energy-efficient SON deployment to meet regulatory sustainability requirements. The Middle East and Africa at 4.9% is the most commercially dynamic growth region by CAGR, driven by ambitious 5G deployment programs in GCC nations and government-backed smart city investments.
Competitive Landscape
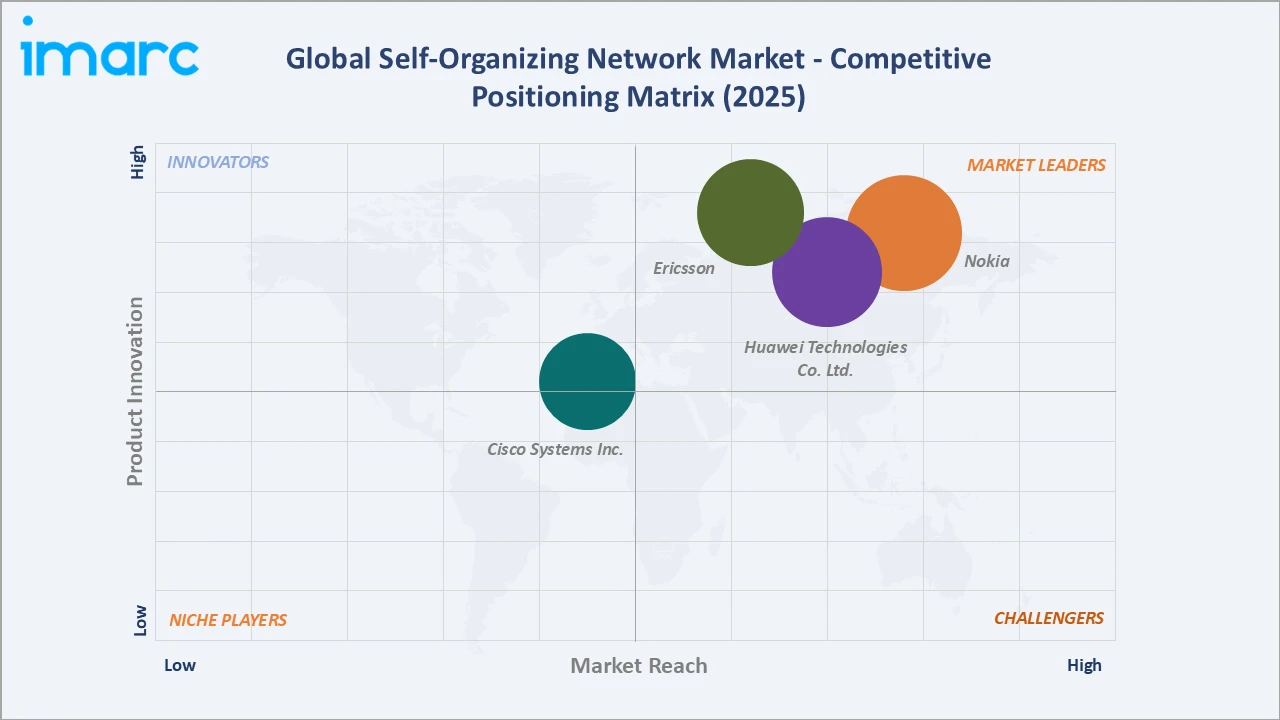
The global self-organizing network market competitive landscape encompasses distinct tiers: SON-integrated network equipment vendors, independent SON software specialists, OSS/BSS platform providers with SON capabilities, and emerging AI-native network automation startups.
|
Company Name |
Key Products |
Market Position |
Core Strength |
|
Ericsson |
Ericsson Network Manager, Telecom AI, RAN Intelligent Controller |
Market Leader |
Ericsson leads the SON market through deep integration of AI optimization within its RAN portfolio, providing end-to-end 5G network automation capabilities to global tier-1 operators. |
|
Nokia |
Nokia AVA, Network Operations Manager, SON Suite |
Market Leader |
Nokia provides comprehensive SON capabilities through its AVA AI platform, enabling operators to achieve network-wide optimization through predictive analytics and closed-loop automation. |
|
Huawei Technologies Co. Ltd. |
iMaster NCE-Autonomous Driving Network |
Market Leader |
Huawei delivers autonomous driving network solutions integrating self-organizing capabilities with AI-powered optimization, achieving significant deployment scale in Asia-Pacific markets. |
|
Cisco Systems Inc. |
Cisco Network Services Orchestrator |
Established Player |
Cisco integrates SON capabilities within its network orchestration platform, enabling automated network management across heterogeneous multi-vendor environments for enterprise and carrier customers. |
Integrated vendor concentration creates competitive advantages through hardware-software co-optimization that pure software SON vendors cannot replicate. Consolidation reflects telecom operator preference for integrated SON vendors that reduce multi-vendor coordination complexity. Market concentration is increasing at the AI platform tier through strategic acquisitions.
Key Company Profiles
Ericsson
Ericsson is a global leader in telecommunications equipment, software, and services, providing advanced self-organizing network solutions integrated within its comprehensive RAN and network management portfolio for mobile operators worldwide.
- Key Products: Ericsson Network Manager, AI-driven SON Suite, RAN Intelligent Controller (Near-RT RIC and Non-RT RIC), Ericsson Expert Analytics.
- Recent Developments: In August 2026, Ericsson introduced AI-powered RAN software to enhance mobile network performance, automation, and energy efficiency. The solution uses AI to optimize radio resources, spectrum utilization, and network operations, helping telecom operators improve 5G network capabilities without major hardware changes. The development supports growing demand for intelligent, high-performance mobile networks driven by AI applications and advanced digital services.
- Strategic Focus: Focuses on AI-native network automation, Open RAN ecosystem leadership, and autonomous driving network solutions for global 5G operators.
Nokia
Nokia is a leading network technology company providing comprehensive self-organizing network solutions through its AVA AI platform and Network Services Manager, enabling operators to achieve autonomous network operations across 4G and 5G environments.
- Key Products: Nokia AVA Cognitive Analytics, Network Services Manager, SON Suite, Self-Organizing Network Manager, MantaRay SON for energy efficiency.
- Strategic Focus: Centered on cognitive network automation, energy-efficient SON deployment, and open ecosystem RIC application development for global operator customers.
Huawei Technologies Co. Ltd.
Huawei Technologies Co. Ltd. delivers autonomous driving network solutions through its iMaster NCE platform, integrating self-organizing capabilities with AI-powered optimization across 5G, 4G, and converged network environments for operators globally.
- Key Products: iMaster NCE-Autonomous Driving Network, U2020 Network Management System, AI-native SON Suite, SmartRadio intelligent optimization.
- Strategic Focus: Focused on Level 4-5 autonomous network achievement, AI-driven energy optimization, and large-scale 5G SON deployment across emerging markets.
Market Concentration Analysis
The global self-organizing network market is moderately concentrated at the technology vendor tier, with the top three vendors collectively accounting for approximately 45-55% of the SON software and platform market. Independent SON software providers represent a growing segment but face complexity barriers limiting adoption against embedded vendor solutions.
The market is transitioning from vendor-proprietary to open ecosystem models as O-RAN RIC architecture gains commercial momentum. This transition is reducing barriers for specialized SON software vendors while increasing competitive intensity for incumbents. AI capabilities are becoming the primary competitive differentiator, driving consolidation as companies acquire AI talent and technology.
Investment & Growth Opportunities
Highest Growth Segments
Software segment (~9.1% CAGR), Centralized SON architecture (~8.9% CAGR), AI-native optimization platforms (~18% CAGR from growing base), energy-efficient SON solutions (~15% CAGR), Open RAN RIC applications (~25% CAGR from near-zero base), and private 5G SON (~20% CAGR) represent the highest-growth SON investment vectors through 2034.
Emerging Investment Opportunities
The Open RAN ecosystem represents the largest near-term investment opportunity for SON software specialists. O-RAN compliant RIC applications addressing interference management, energy optimization, and traffic steering enable software-only vendors to access the full operator market without hardware dependencies. Companies establishing xApp and rApp portfolios by 2026 are positioned for accelerated revenue growth.
Investment Themes
- AI-Native SON Platform Development Capturing Autonomous Network Market: AI-native SON platforms that achieve measurable network KPI improvement through reinforcement learning and predictive analytics command premium pricing and drive displacement of legacy rule-based systems. Companies investing in AI model development, training data infrastructure, and closed-loop automation capabilities are positioned for market share capture as operators pursue autonomous network goals.
- Energy-Efficient SON Solutions Addressing Telecom Sustainability Mandates: Telecom operators face regulatory and ESG pressure to reduce network energy consumption by 30-50% while expanding 5G capacity. SON solutions specifically targeting energy optimization through intelligent sleep scheduling, power management, and renewable energy integration represent high-value investment opportunity with clear ROI metrics that accelerate operator procurement decisions.
Future Market Outlook (2026-2034)
The global self-organizing network market is projected to grow from USD 7.0 Billion in 2025 to USD 14.6 Billion by 2034, delivering an 8.36% CAGR over the forecast period. The market's anchor value of USD 10.4 Billion in 2030 represents a SON industry at its most transformative commercial inflection since the initial 4G SON standardization.
Three structural forces define SON market growth through 2034 with exceptional confidence. 5G network expansion creates continuous demand for intelligent automation as operators deploy tens of thousands of small cells requiring automated configuration and optimization. AI technology cost reduction is making premium SON capabilities commercially accessible to a broader operator base including regional and emerging market operators. Open RAN ecosystem maturation is expanding the addressable market by enabling software-only SON deployment across previously proprietary network environments.
Research Methodology
Primary Research
Primary research comprised structured interviews with 55+ industry stakeholders (2025) including Chief Network Officers; SON Product Directors; Network Automation Architects; Telecom Operator Technology Heads; and regional SON market specialists across North America, Europe, and Asia-Pacific.
Secondary Research
Secondary research encompassed telecom industry publications; 3GPP and O-RAN Alliance technical specifications; operator annual reports; SON vendor financial disclosures; government telecom regulatory reports; industry analyst research; and network automation market statistics. Over 65 secondary sources reviewed.
Forecasting Models
Market revenue forecasts developed using a segment bottom-up model: (i) SON software component; (ii) professional services component; (iii) managed services component; validated against operator capital expenditure trends and vendor revenue guidance.
Report Coverage:
| Report Features | Details |
|---|---|
| Base Year of the Analysis | 2025 |
| Historical Period | 2020-2025 |
| Forecast Period | 2026-2034 |
| Units | Billion USD |
| Scope of the Report |
Exploration of Historical Trends and Market Outlook, Industry Catalysts and Challenges, Segment-Wise Historical and Future Market Assessment:
|
| Offerings Covered | Software, Services |
| Network Infrastructures Covered | Core Network, Radio Access Network, Backhaul, Wi-Fi |
| Architectures Covered | Centralized Self-Organizing Networks, Distributed Self-Organizing Networks, Hybrid Self-Organizing Networks |
| Network Technologies Covered | 2G/3G, 4G/LTE, 5G |
| Applications Covered | Speech Coding, Authentication and Network Security, Wireless Application Protocol, Application in 3G System, Intermachine Communication, Global Positioning System, Gaming, and Others |
| Region Covered | Asia Pacific, Europe, North America, Latin America, Middle East and Africa |
| Countries Covered | United States, Canada, Germany, France, United Kingdom, Italy, Spain, Russia, China, Japan, India, South Korea, Australia, Indonesia, Brazil, Mexico |
| Companies Covered | Ericsson, Nokia, Huawei Technologies Co. Ltd., Cisco Systems Inc., etc. |
| Customization Scope | 10% Free Customization |
| Post-Sale Analyst Support | 10-12 Weeks |
| Delivery Format | PDF and Excel through Email (We can also provide the editable version of the report in PPT/Word format on special request) |
Frequently Asked Questions About the Self-Organizing Network Market Report
The global self-organizing network market reached USD 7.0 Billion in 2025. The market is driven by the rapid expansion of 5G networks requiring intelligent automation, increasing network complexity, and rising operator demand for cost-efficient automated network management solutions. AI integration and Open RAN ecosystem development are further accelerating market growth.
The market grows at 8.36% CAGR during 2026-2034, reaching USD 14.6 Billion by 2034. Software segment grows fastest at ~9.1% CAGR through AI-native platform development. Open RAN RIC applications grow at approximately 25% CAGR from a near-zero base as the O-RAN ecosystem achieves commercial scale.
Software leads at 66.4% through the concentration of SON intelligence in cloud-native optimization platforms, AI analytics engines, and self-configuration algorithms. Software dominance reflects that the core value of SON solutions resides in intelligent algorithms and data analytics rather than hardware components.
Centralized Self-Organizing Networks lead at 46.8% through the superior network-wide visibility and coordinated optimization advantages of centralized intelligence platforms. These architectures enable unified radio resource management and interference coordination that distributed approaches cannot achieve for large-scale network optimization.
North America leads at 37.5% through aggressive 5G spectrum deployment, substantial telecom operator investment in network automation, and the strategic presence of leading SON technology vendors and innovation ecosystems driving continuous platform advancement.
Leading companies include Ericsson, Nokia, Huawei Technologies Co. Ltd., and Cisco Systems Inc., among others.
The market is projected to reach approximately USD 10.4 Billion by 2030, with AI-native SON achieving commercial mainstream adoption, Open RAN RIC ecosystem reaching commercial scale, and energy-efficient SON becoming standard operator deployment requirement driven by sustainability mandates.
The Open RAN RAN Intelligent Controller provides standardized interfaces enabling SON applications to operate across multi-vendor RAN environments. RIC eliminates hardware-software coupling in network optimization, creating a vendor-neutral application ecosystem that expands SON addressable market and enables new software-only SON vendors to access the full operator market.
Need more help?
- Speak to our experienced analysts for insights on the current market scenarios.
- Include additional segments and countries to customize the report as per your requirement.
- Gain an unparalleled competitive advantage in your domain by understanding how to utilize the report and positively impacting your operations and revenue.
- For further assistance, please connect with our analysts.
 Request Customization
 Speak to an Analyst
 Request Brochure
 Inquire Before Buying
Benefits of Customization
- Personalize this research
- Triangulate with your data
- Get data as per your format and definition
- Gain a deeper dive into a specific application, geography, customer, or competitor
- Any level of personalization
Get in Touch With Us
UNITED STATES
Phone: +1-201-971-6302
INDIA
Phone: +91-120-433-0800
UNITED KINGDOM
Phone: +44-753-714-6104
Email: sales@imarcgroup.com
Client Testimonials




.webp)




.webp)













Related Reports

Choose your plan
*Please note that the prices mentioned below are starting prices for each bundle type. Kindly contact our team for further details.*
Single User License
- 1 User License, Access on 2 Devices
- PDF Report + Excel Dataset (Password Protected)
- Lifetime Access
- No Printing Rights
- 10% Free Report Customization
- 10–12 Weeks of Analyst Support
Five User License
- Access for 5 Users, 2 Devices per User
- PDF Report + Excel Dataset (Password Protected)
- Lifetime Access
- Dedicated Account Manager
- 12–14 Weeks of Analyst Support
- No Printing Rights
- 15% Free Report Customization
- 25% Discount on Your Next Purchase
Corporate User License
- Unlimited User Access (Within Your Organization)
- PDF Report + Excel Dataset
- Lifetime Access
- Dedicated Account Manager
- 14–20 Weeks of Analyst Support
- No Printing Rights
- 20% Free Report Customization
- 30% Discount on Your Next Purchase
Essential Insights
What's included:
3 reports
- Lifetime Access
- PDF Reports
- Excel Datasets
- 2 Weeks of Free Analyst Support
- 2 User Licenses
- Access on 2 Devices
- Printing Rights
- Complimentary PowerPoint (PPT) Version
- Complimentary License Upgrade
Professional Access
What's included:
5 reports
- Lifetime Access
- PDF Reports
- Excel Datasets
- 8 Weeks of Free Analyst Support
- 2 User Licenses
- Access on 2 Devices
- Printing Rights
- Complimentary PowerPoint (PPT) Version
- Complimentary License Upgrade
Business Advantage
What's included:
8 reports
- Lifetime Access
- PDF Reports
- Excel Datasets
- 14 Weeks of Free Analyst Support
- 2 User Licenses
- Access on 2 Devices
- Printing Rights
- Complimentary PowerPoint (PPT) Version
- Complimentary License Upgrade
Enterprise Intelligence
What's included:
10 reports
- Lifetime Access
- PDF Reports
- Excel Datasets
- 20 Weeks of Free Analyst Support
- 2 User Licenses
- Access on 2 Devices
- Printing Rights
- Complimentary PowerPoint (PPT) Version
- Complimentary License Upgrade