
Silica Sand Prices, Trend, Chart, Demand, Market Analysis, News, Historical and Forecast Data Report 2025 Edition
Silica Sand Price Trend, Index and Forecast
Track real-time and historical silica sand prices across global regions. Updated monthly with market insights, drivers, and forecasts.
Silica Sand Prices October 2025
| Region | Price (USD/MT) | Latest Movement |
|---|---|---|
| Africa | 49.97 | 2.1% ↑ Up |
| Northeast Asia | 63.01 | 0.9% ↑ Up |
| Europe | 71.34 | 1.7% ↑ Up |
| India | 36.9 | -0.2% ↓ Down |
| North America | 48.1 | -1.2% ↓ Down |
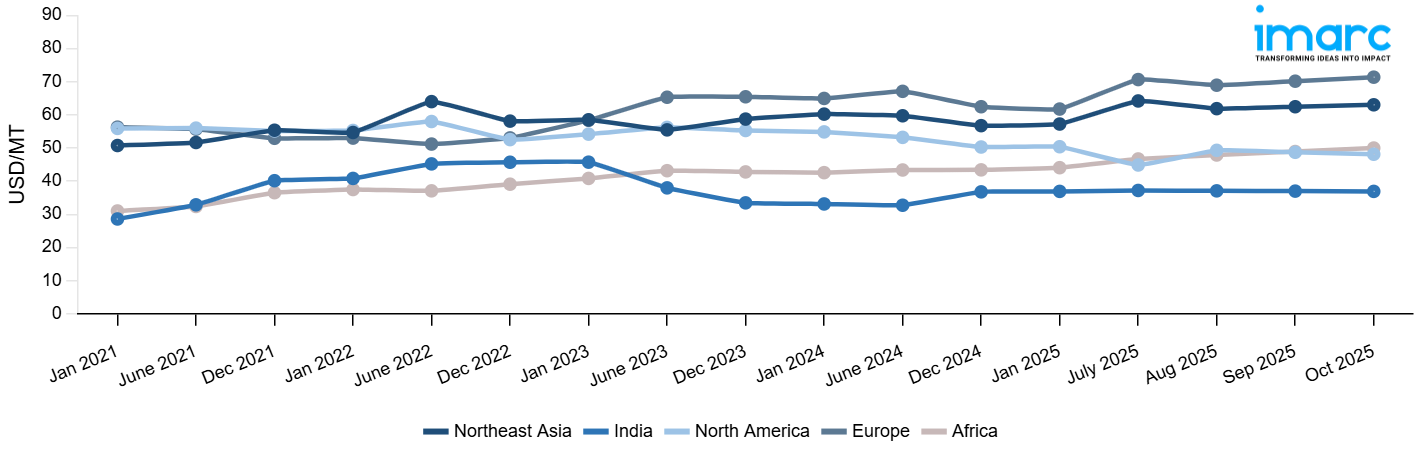
Silica Sand Price Index (USD/MT):
The chart below highlights monthly silica sand prices across different regions.
Get Access to Monthly/Quaterly/Yearly Prices, Request Sample
Market Overview Q3 Ending September 2025
Africa: The surge can be attributed to a rise in demand from the construction sector, especially in countries like South Africa, Nigeria, and Egypt. Local supply challenges due to logistical disruptions and fuel price hikes were also key factors impacting the overall cost structure. Africa's reliance on imports from global suppliers, along with ongoing supply chain constraints, led to higher transportation costs, especially with the fluctuations in shipping and port handling fees. Despite some regional instability, demand for silica sand remained robust, particularly from the construction industry and glass manufacturing. Currency fluctuations also contributed to the increased pricing, as the weaker African currencies heightened the cost of imports.
Northeast Asia: The price rise was driven primarily by steady demand from the construction, glass, and ceramics industries. Significant infrastructure projects in China and Japan helped stabilize the demand for silica sand. Additionally, disruptions in global logistics and rising freight costs created supply-side pressures, further impacting prices. The appreciation of the Japanese yen against the US dollar also contributed to higher costs for imported silica sand. Furthermore, strict environmental regulations in China, aiming to curb pollution in mining operations, increased operational costs for domestic producers, which were passed on to consumers. While domestic supply remained steady, the tightening supply of high-quality silica sand from key producers affected pricing trends.
Europe: Silica sand pricing in Europe experienced a modest increase. This upward movement was driven by a tightening of the supply chain, particularly in major producing countries like Germany, France, and Spain. Demand in sectors such as glass manufacturing, ceramics, and foundries has remained high. Furthermore, Europe has been working towards improving the sustainability of mining operations, adding compliance costs for environmental and regulatory requirements, which have added to overall production costs. The geopolitical uncertainties surrounding global trade routes and energy prices also contributed to price hikes, as higher fuel costs increased transportation expenses. These factors, combined with the strengthening of the euro against other currencies, influenced silica sand prices in the region.
India: The price decline was largely influenced by a mix of demand-side and supply-side factors. The construction sector, a major consumer of silica sand, saw a slowdown in activity due to continued inflationary pressures and financial constraints, which reduced demand for raw materials. Additionally, competition from domestic and international suppliers intensified, leading to price pressure. The weakening of the Indian Rupee against the US Dollar also contributed to increased costs for imported silica sand, further influencing price dynamics. Despite these counterbalancing factors, the overall price trend showed a minor decline, reflecting the ongoing market adjustments in response to the economic environment and demand shifts across key sectors.
North America: North America saw a decrease in silica sand prices. This decline was primarily driven by increased domestic production in the United States, as mining operations ramped up to meet the steady demand from the oil and gas industry, as well as the construction sector. Supply chain improvements and a stronger domestic production base helped reduce the dependency on imported silica sand, easing price pressure. However, market uncertainty, combined with volatile energy prices and inflationary pressures, contributed to some price instability.
Silica Sand Price Trend, Market Analysis, and News
IMARC's latest publication, “Silica Sand Prices, Trend, Chart, Demand, Market Analysis, News, Historical and Forecast Data Report 2025 Edition,” presents a detailed examination of the silica sand market, providing insights into both global and regional trends that are shaping prices. This report delves into the spot price of silica sand at major ports and analyzes the composition of prices, including FOB and CIF terms. It also presents detailed silica sand prices trend analysis by region, covering North America, Europe, Asia Pacific, Latin America, and Middle East and Africa. The factors affecting silica sand pricing, such as the dynamics of supply and demand, geopolitical influences, and sector-specific developments, are thoroughly explored. This comprehensive report helps stakeholders stay informed with the latest market news, regulatory updates, and technological progress, facilitating informed strategic decision-making and forecasting.
Silica Sand Industry Analysis
The global silica sand industry size reached USD 25.4 Billion in 2024. By 2033, IMARC Group expects the market to reach USD 38.3 Billion, at a projected CAGR of 4.70% during 2025-2033. The market is driven by the increasing demand from the glass industry, expanding construction activities globally, and the rise of the oil and gas sectors.
Latest developments in the Silica Sand industry:
- September 2025: Minerals Development Oman (MDO), in collaboration with the Earth Sciences Consultancy Centre, launched production at the Silica Sand Project located in the Wilayat of Mahout, within exploration block F51.
- February 2024: Canadian Premium Sand (CPS) received formal approval from the Manitoba government to initiate silica sand mining operations at Hollow Water First Nation and to establish a state-of-the-art solar glass manufacturing facility in the city of Selkirk.
Product Description
Silica sand, also known as industrial sand, is a naturally occurring granular material composed primarily of silicon dioxide (SiO₂), commonly in the form of quartz. It is one of the most abundant minerals on Earth and is valued for its high purity and consistent grain size. Silica sand is typically derived from weathered sandstone deposits and is processed to remove impurities such as clay, iron, and other minerals. Its unique physical and chemical properties—such as hardness, high melting point, and chemical inertness make it an essential raw material across a wide range of industries. It plays a crucial role in various industrial applications due to its high purity and granular size. Its importance is underscored in the production of glass, ceramics, and in foundries where its properties enhance product durability and strength. Silica sand is also used in hydraulic fracturing and in the production of silicon chips for electronics.
Report Coverage
| Key Attributes | Details |
|---|---|
| Product Name | Silica Sand |
| Report Features | Exploration of Historical Trends and Market Outlook, Industry Demand, Industry Supply, Gap Analysis, Challenges, Ammonia Price Analysis, and Segment-Wise Assessment. |
| Currency/Units | US$ (Data can also be provided in local currency) or Metric Tons |
| Region/Countries Covered | The current coverage includes analysis at the global and regional levels only. Based on your requirements, we can also customize the report and provide specific information for the following countries: Asia Pacific: China, India, Indonesia, Pakistan, Bangladesh, Japan, Philippines, Vietnam, Thailand, South Korea, Malaysia, Nepal, Taiwan, Sri Lanka, Hongkong, Singapore, Australia, and New Zealand* Europe: Germany, France, United Kingdom, Italy, Spain, Russia, Turkey, Netherlands, Poland, Sweden, Belgium, Austria, Ireland, Switzerland, Norway, Denmark, Romania, Finland, Czech Republic, Portugal and Greece* North America: United States and Canada Middle East & Africa: Saudi Arabia, UAE, Israel, Iran, South Africa, Nigeria, Oman, Kuwait, Qatar, Iraq, Egypt, Algeria, and Morocco* Latin America: Brazil, Mexico, Argentina, Columbia, Chile, Ecuador, Peru* *The list of countries presented is not exhaustive. Information on additional countries can be provided if required by the client. |
| Information Covered for Key Suppliers |
|
| Customization Scope | The report can be customized as per the requirements of the customer |
| Report Price and Purchase Option |
Plan A: Monthly Updates - Annual Subscription
Plan B: Quarterly Updates - Annual Subscription
Plan C: Biannually Updates - Annual Subscription
|
| Post-Sale Analyst Support | 360-degree analyst support after report delivery |
| Delivery Format | PDF and Excel through email (We can also provide the editable version of the report in PPT/Word format on special request) |
Key Benefits for Stakeholders:
- IMARC’s report presents a detailed analysis of silica sand pricing, covering global and regional trends, spot prices at key ports, and a breakdown of FOB and CIF prices.
- The study examines factors affecting silica sand price trend, including input costs, supply-demand shifts, and geopolitical impacts, offering insights for informed decision-making.
- The competitive landscape review equips stakeholders with crucial insights into the latest market news, regulatory changes, and technological advancements, ensuring a well-rounded, strategic overview for forecasting and planning.
- IMARC offers various subscription options, including monthly, quarterly, and biannual updates, allowing clients to stay informed with the latest market trends, ongoing developments, and comprehensive market insights. The silica sand price charts ensure our clients remain at the forefront of the industry.
Frequently Asked Questions About the Silica Sand Price Trend Report
The silica sand prices in October 2025 were 49.97 USD/MT in Africa, 63.01 USD/MT in Northeast Asia, 71.34 USD/MT in Europe, 36.9 USD/MT in India, and 48.1 USD/MT in North America.
The silica sand pricing data is updated on a monthly basis.
We provide the pricing data primarily in the form of an Excel sheet and a PDF.
Yes, our report includes a forecast for silica sand prices.
The regions covered include North America, Europe, Asia Pacific, Middle East, and Latin America. Countries can be customized based on the request (additional charges may be applicable).
Yes, we provide both FOB and CIF prices in our report.
Need more help?
- Speak to our experienced analysts for insights on the current market scenarios.
- Include additional segments and countries to customize the report as per your requirement.
- Gain an unparalleled competitive advantage in your domain by understanding how to utilize the report and positively impacting your operations and revenue.
- For further assistance, please connect with our analysts.
 Request Customization
 Inquire Before Buying
 Speak to an Analyst
 Request Brochure
Benefits of Customization
- Personalize this research
- Triangulate with your data
- Get data as per your format and definition
- Gain a deeper dive into a specific application, geography, customer, or competitor
- Any level of personalization
Get in Touch With Us
UNITED STATES
Phone: +1-201-971-6302
INDIA
Phone: +91-120-433-0800
UNITED KINGDOM
Phone: +44-753-714-6104
Email: [email protected]
Client Testimonials


.webp)


Why Choose Us
IMARC offers trustworthy, data-centric insights into commodity pricing and evolving market trends, enabling businesses to make well-informed decisions in areas such as procurement, strategic planning, and investments. With in-depth knowledge spanning more than 1000 commodities and a vast global presence in over 150 countries, we provide tailored, actionable intelligence designed to meet the specific needs of diverse industries and markets.
1000
+Commodities
150
+Countries Covered
3000
+Clients
20
+Industry
Robust Methodologies & Extensive Resources
IMARC delivers precise commodity pricing insights using proven methodologies and a wealth of data to support strategic decision-making.
Subscription-Based Databases
Our extensive databases provide detailed commodity pricing, import-export trade statistics, and shipment-level tracking for comprehensive market analysis.
Primary Research-Driven Insights
Through direct supplier surveys and expert interviews, we gather real-time market data to enhance pricing accuracy and trend forecasting.
Extensive Secondary Research
We analyze industry reports, trade publications, and market studies to offer tailored intelligence and actionable commodity market insights.
Trusted by 3000+ industry leaders worldwide to drive data-backed decisions. From global manufacturers to government agencies, our clients rely on us for accurate pricing, deep market intelligence, and forward-looking insights.