
Smart Building Market Report by Component (Hardware, Software, Service), Technology (Building Infrastructure Management (BIM), Security and Emergency Management, Energy Management, Network & Communication Management, Workforce Management, and Others), End User (Commercial, Residential, Government & Public Infrastructure, Healthcare, Education, Transport, Manufacturing & Industrial, and Others), and Region 2026-2034
Smart Building Market Size:
The global smart building market size reached USD 415.1 Billion in 2025. Looking forward, IMARC Group expects the market to reach USD 908.7 Billion by 2034, exhibiting a growth rate (CAGR) of 8.82% during 2026-2034. The market is growing rapidly driven by advancements in the Internet of Things (IoT) and artificial intelligence (AI) technologies, rising focus on energy efficiency and sustainable design, and increasing demand for integrated security systems, aligned with supportive government regulations and a growing emphasis on occupant comfort.
|
Report Attribute
|
Key Statistics
|
|---|---|
|
Base Year
|
2025
|
|
Forecast Years
|
2026-2034
|
|
Historical Years
|
2020-2025
|
|
Market Size in 2025
|
USD 415.1 Billion |
|
Market Forecast in 2034
|
USD 908.7 Billion |
| Market Growth Rate 2026-2034 | 8.82% |
Smart Building Market Analysis:
- Market Growth and Size: The market is witnessing stable growth, driven by increasing focus on energy efficiency, sustainability, and technological innovations. Furthermore, it is supported by rapid urbanization, rising number of smart cities, and the growing awareness of the benefits of smart technologies in building management.
- Major Market Drivers: Key drivers influencing the market growth include emphasis on energy efficiency and sustainability, technological advancements like the Internet of Things (IoT) and artificial intelligence (AI), rising demand for integrated security systems, and government regulations and initiatives promoting green building practices.
- Technological Advancements: The integration of IoT, AI, and machine learning (ML) enabling more efficient and intelligent buildings is supporting the market growth. Furthermore, continuous innovations in sensor technology, energy management systems, and network communication are supporting the market growth.
- Industry Applications: The market is experiencing high demand for smart buildings in commercial spaces, residential areas, healthcare, education, government infrastructure, and transportation hubs.
- Key Market Trends: The key market trends involve the increasing trend towards integrating renewable energy sources and developing building-as-a-service (BaaS) models. Additionally, the growing focus on creating human-centric designs that prioritize occupant comfort and productivity, is bolstering the market growth.
- Geographical Trends: North America leads the market due to its advanced technological infrastructure, supportive government policies, and a strong focus on sustainability. Other regions are also showing significant growth, fueled by urbanization, smart city initiatives, and environmental concerns.
- Competitive Landscape: The market is characterized by a mix of established technology companies and emerging startups, all contributing to a dynamic and competitive landscape. Furthermore, key players are focusing on strategic partnerships, research and development (R&D), and expanding their product portfolios to include innovative and customizable smart building solutions.
- Challenges and Opportunities: The market faces various challenges, such as high initial costs of implementing smart building technologies and concerns regarding data privacy and security. However, recent innovation in cost-effective solutions and advanced security measures is creating new opportunities for the market growth.
To get more information on this market Request Sample
Smart Building Market Trends:
The increasing emphasis on energy efficiency and sustainability
The growing emphasis on energy efficiency and sustainability is a paramount factor fueling the market growth. In line with this, smart buildings utilize advanced systems for managing lighting, heating, ventilation, and air conditioning (HVAC), effectively reducing energy consumption and minimizing carbon emissions. They not only contribute to environmental conservation but also offer economic benefits by lowering energy costs. This dual advantage has made energy efficiency an essential criterion in building design and renovation, further propelled by an increasing societal focus on sustainable living. Furthermore, the integration of renewable energy sources, like solar panels, in smart buildings to enhance their green credentials, making them a model for future developments in urban spaces, is bolstering the market growth.
Recent technological advancements
Recent technological advancements in the Internet of Things (IoT), which has enabled a new level of connectivity in buildings, where various components and systems can communicate and operate synergistically, are boosting the market growth. Furthermore, the integration of artificial intelligence (AI) and machine learning (ML) algorithms, enabling predictive maintenance and adaptive control systems, is catalyzing the market growth. Besides this, they analyze vast amounts of data from sensors and devices within the building, facilitating the automation of various processes, such as energy management, security, and environmental control. It not only improves the performance and efficiency of the buildings but also elevates the user experience by customizing environments according to real-time needs and preferences.
Rising focus on occupant comfort and productivity
Smart buildings leverage technology to create environments that are not only efficient but also conducive to the health and well-being of their occupants. They utilize sensors and automation systems to maintain optimal conditions, including air quality, temperature, lighting, and noise levels. It is particularly important in office buildings and commercial spaces, where the well-being of employees directly influences their performance and job satisfaction. Furthermore, the introduction of a human-centric approach in building design and operation, reflecting a broader shift towards more empathetic and responsive urban spaces, is positively influencing the market growth. In addition, the ability of smart buildings to adapt to the needs and preferences of their occupants not only enhances user experience but also serves as a competitive advantage in the real estate market.
The imposition of government regulations and initiatives
Governments are implementing policies and regulations aimed at promoting energy efficiency, sustainability, and technological innovation in the building sector. They mandate certain standards for new constructions and renovations, pushing the adoption of smart technologies. Additionally, governments are providing incentives and financial support for smart building projects, including tax rebates, grants, and subsidized loans, making it economically viable for developers and owners to invest in smart technologies. Additionally, these initiatives are aiding countries to meet environmental targets, reduce carbon emissions, and foster sustainable urban development. Moreover, government-led smart city projects are not only propelling the market forward but also ensuring that the growth of smart buildings aligns with broader societal and environmental objectives.
Growing demand for integrated security and safety solutions
The increasing demand for integrated security and safety solutions in buildings is a significant factor contributing to the market growth. Smart buildings offer advanced and comprehensive security systems, including integrated surveillance cameras, access control, motion detectors, and alarm systems, which allow for real-time monitoring and quick response to any security breaches or emergencies. Furthermore, the integration of advanced technologies like biometric authentication, facial recognition, and AI-powered surveillance, which enhance the effectiveness of security systems, is driving the market growth. In addition, smart buildings also focus on safety features, including advanced fire detection and response systems, structural health monitoring, and emergency evacuation protocols that are particularly appealing in sectors, such as commercial real estate, hospitality, and healthcare, where security and safety are of utmost importance.
Smart Building Industry Segmentation:
IMARC Group provides an analysis of the key trends in each segment of the market, along with forecasts at the global, regional, and country levels for 2026-2034. Our report has categorized the market based on component, technology, and end-user.
Breakup by Component:
To get detailed segment analysis of this market Request Sample
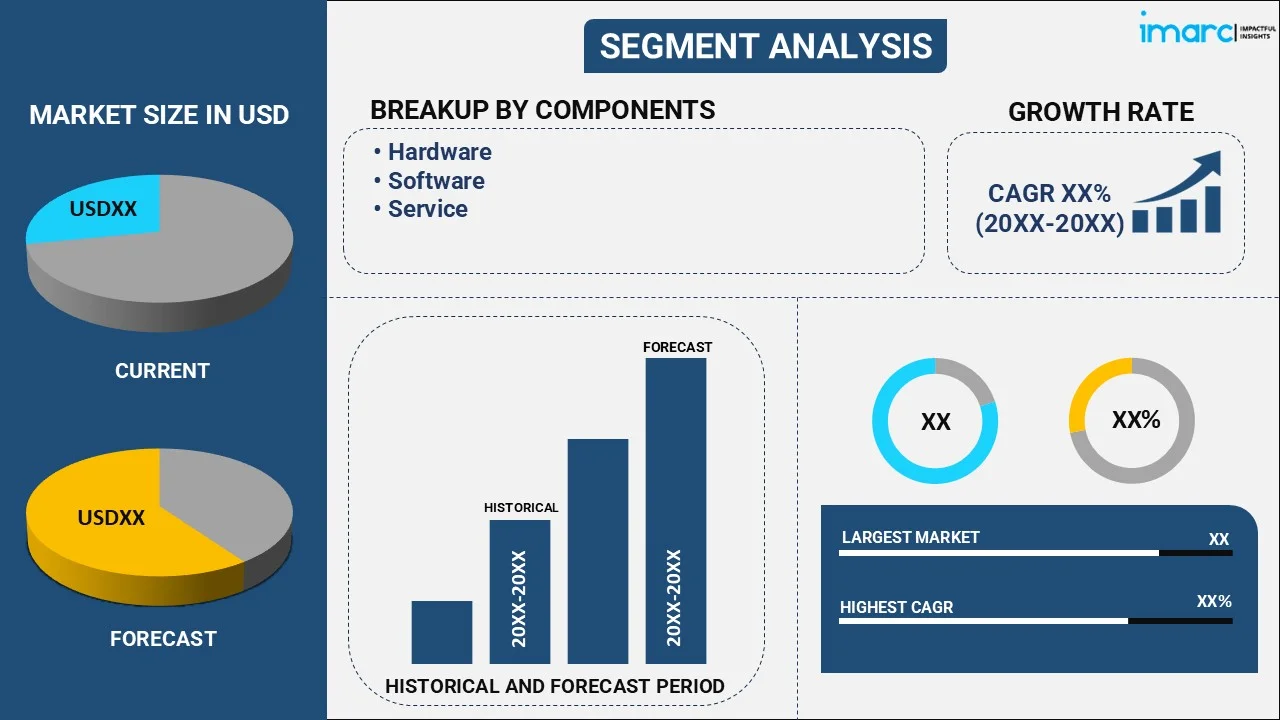
- Hardware
- Software
- Service
- Professional Service
- Managed Service
Hardware accounts for the majority of the market share
The report has provided a detailed breakup and analysis of the market based on the component. This includes hardware, software, and service (professional and managed services). According to the report, hardware represented the largest segment.
The hardware segment is dominating the market due to its essential role in the functionality of smart buildings. It includes sensors, controllers, actuators, and other physical devices that are integral to monitoring and managing various building systems, such as HVAC, lighting, and security. Furthermore, hardware components are the backbone of smart buildings, providing the necessary data collection and control capabilities that enable automation and efficiency. In addition, the growing demand for advanced and reliable hardware, driven by the need for accurate data collection and real-time response in building management, is supporting the market growth.
The software segment comprises platforms and applications that process and analyze data collected by hardware components. It includes building management systems (BMS), energy management systems (EMS), security management systems, and other software tools that enable centralized control and management of building operations. Furthermore, the software provides the intelligence that transforms a building into a 'smart' building, allowing for efficient resource management, predictive maintenance, and enhanced occupant experiences.
The service segment encompasses a range of services, including installation, maintenance, consulting, and system integration. It ensures that hardware and software components are optimally installed and configured to work seamlessly together. Furthermore, services are critical to ensure the longevity of smart building systems and help clients choose the right technologies and strategies to meet their specific needs.
Breakup by Technology:
- Building Infrastructure Management (BIM)
- Parking Management System
- Smart Water Management System
- Elevators and Escalators Management System
- Security and Emergency Management
- Access Control System
- Video Surveillance System
- Safety System
- Energy Management
- HVAC Control System
- Lighting System
- Network & Communication Management
- Workforce Management
- Others
Security and emergency management holds the largest share in the industry
A detailed breakup and analysis of the market based on the technology have also been provided in the report. This includes building infrastructure management (BIM) (parking management system, smart water management system, and elevators and escalators management system), security and emergency management (access control system, video surveillance system, and safety system), and energy management (HVAC control system and lighting system), network & communication management, workforce management, and others. According to the report, security and emergency management accounted for the largest market share.
The security and emergency management segment is dominating the market as it reflects the increasing emphasis on safety and security in building management. It encompasses advanced security systems, such as surveillance cameras, access control systems, alarm systems, and emergency response solutions. Furthermore, the integration of the Internet of Things (IoT) and artificial intelligence (AI) technologies, which enhance the capabilities of these systems, enabling real-time monitoring, predictive analysis of potential threats, and swift responses to emergencies, is positively influencing the market growth. Moreover, the growing need for robust security measures in response to heightened security concerns across the globe is acting as another growth-inducing factor.
Building infrastructure management (BIM) focuses on the integration and management of the physical infrastructure of buildings. It involves the use of digital representations of the physical and functional characteristics of building facilities. BIM enables architects, engineers, and construction professionals to collaboratively plan, design, construct, and manage buildings and infrastructure more efficiently.
The energy management segment focuses on optimizing energy consumption and enhancing overall building efficiency. It includes technologies and systems designed to monitor and control the energy usage of various building systems like HVAC, lighting, and appliances. Furthermore, the integration of sensors, smart meters, and energy management software, which enables real-time energy monitoring, predictive maintenance, and efficient resource allocation, is favoring the market growth.
Network and communication management focuses on the infrastructure that enables connectivity and communication between various systems and devices within a building. It includes wired and wireless communication networks, IoT platforms, and cloud-based solutions that facilitate the exchange of data and ensure seamless operation of smart building technologies.
Workforce management focuses on optimizing the performance and efficiency of the building staff and service providers. It includes solutions and systems that assist in scheduling, task allocation, performance monitoring, and real-time coordination of the workforce. Furthermore, the integration of mobile technology, AI, and IoT in workforce management tools, which enables better communication, enhanced productivity, and more effective management of human resources is supporting the market growth.
Breakup by End User:
- Commercial
- Residential
- Government & Public Infrastructure
- Healthcare
- Education
- Transport
- Manufacturing & Industrial
- Others
Commercial represents the leading market segment
The report has provided a detailed breakup and analysis of the market based on the end user. This includes commercial, residential, government & public infrastructure, healthcare, education, transport, manufacturing & industrial, and others. According to the report, commercial represented the largest segment.
The commercial segment is dominating the market as it encompasses office buildings, retail spaces, hotels, and other business-related properties. It heavily invests in smart building technologies to enhance operational efficiency, reduce energy consumption, and improve occupant comfort and safety. Furthermore, commercial buildings are at the forefront of adopting advanced systems for energy management, integrated security, and automation, driven by the need to minimize operational costs and attract tenants with modern, sustainable, and secure workspaces. Additionally, commercial smart buildings often serve as showcases for cutting-edge technology and design, reflecting broader trends in workplace innovation and environmental responsibility.
In the residential segment, smart home technologies, such as automated lighting, temperature control, and security systems, are increasingly becoming popular as homeowners seek enhanced comfort and reduced utility bills. Furthermore, the integration of IoT devices and AI-enabled platforms, which allows residents to monitor and control various aspects of their home environment remotely, is favoring the market growth.
The government and public infrastructure segment involves the application of smart building technologies in government buildings, public service facilities, and infrastructure projects. It focuses on improving energy efficiency, security, and operational effectiveness in public spaces. Furthermore, governments are investing in smart technologies as part of broader initiatives to modernize infrastructure, reduce public spending on utilities, and enhance public safety and services.
In the healthcare segment, smart building technologies are used to improve the efficiency and quality of healthcare facilities, including hospitals, clinics, and research centers. It prioritizes the optimization of energy use, enhancement of patient comfort, and integration of advanced security systems.
The education segment includes schools, universities, and other educational institutions, which are adopting smart building technologies to create more sustainable, efficient, and interactive learning environments. Furthermore, smart schools and universities leverage technology for energy management, enhanced security, and improved learning experiences through connected classrooms and facilities.
In the transport segment, smart building technologies are applied in transportation hubs, such as airports, train stations, and bus terminals. It focuses on enhancing passenger experience, operational efficiency, and security. Furthermore, the integration of IoT and AI, which assists in managing the high footfall and complex operations typical of transportation hubs, is supporting the market growth.
The manufacturing and industrial segment includes factories, warehouses, and other industrial facilities. Smart building technologies in this sector are geared towards optimizing production processes, enhancing worker safety, and reducing energy consumption. It also involves the integration of automation systems, industrial IoT devices, and energy management tools.
Breakup by Region:
To get more information on the regional analysis of this market Request Sample
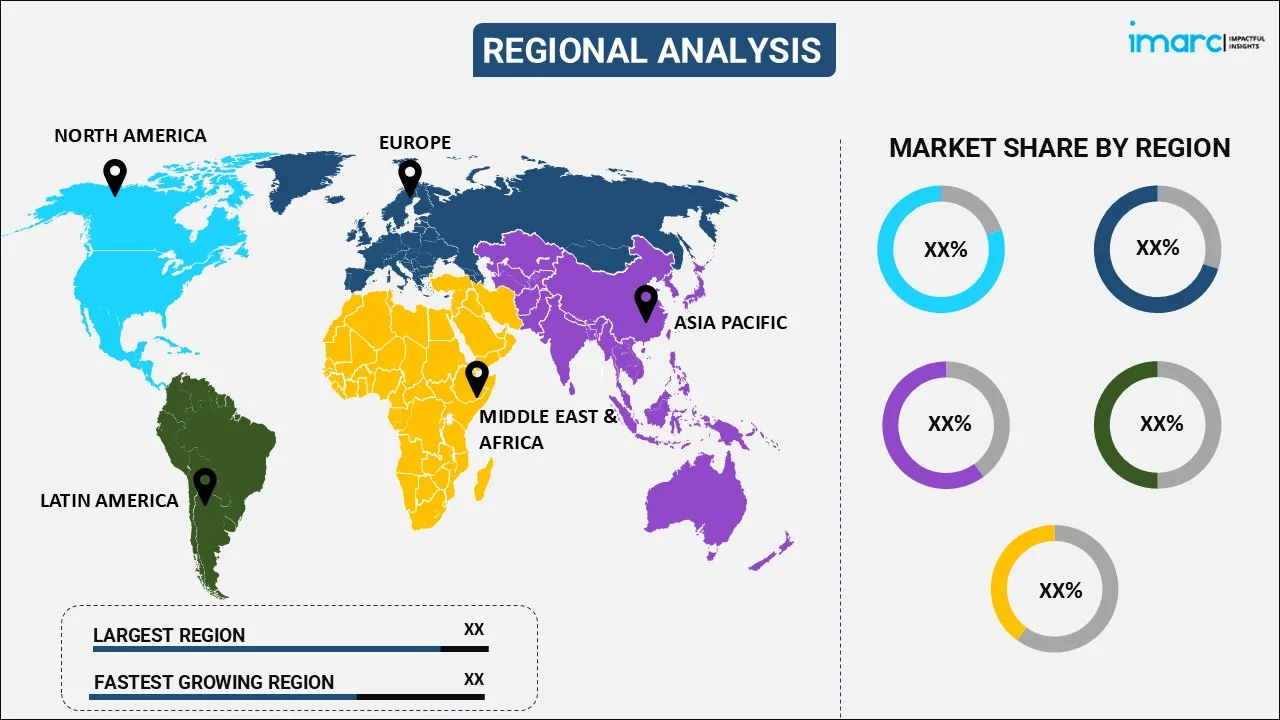
- North America
- United States
- Canada
- Asia Pacific
- China
- Japan
- India
- South Korea
- Australia
- Indonesia
- Others
- Europe
- Germany
- France
- United Kingdom
- Italy
- Spain
- Russia
- Others
- Latin America
- Brazil
- Mexico
- Others
- Middle East and Africa
- Turkey
- Saudi Arabia
- UAE
- Others
North America leads the market, accounting for the largest smart building market share
The market research report has also provided a comprehensive analysis of all the major regional markets, which include North America (the United States and Canada); Asia Pacific (China, Japan, India, South Korea, Australia, Indonesia, and others); Europe (Germany, France, the United Kingdom, Italy, Spain, and others); Latin America (Brazil, Mexico, and others); and the Middle East and Africa (Turkey, Saudi Arabia, UAE, and others). According to the report, North America accounted for the largest market share.
North America has been at the forefront of technological innovation, including the development and adoption of Internet of Things (IoT) solutions, artificial intelligence (AI), and big data analytics, which are integral to smart building capabilities. Furthermore, the presence of leading technology firms and startups in North America, which continuously drives innovation in the smart building sector, is driving the market growth. In addition, the region’s emphasis on sustainability and energy efficiency, which aligns well with the core objectives of smart buildings, is strengthening the market growth. Apart from this, the imposition of supportive policies and incentives that encourage the adoption of smart building technologies is bolstering the market growth. Additionally, the expanding commercial real estate sector in North America, which is highly developed and competitive, is acting as another growth-inducing factor.
The Asia-Pacific region is undergoing rapid urbanization, with a significant portion of the population migrating to urban areas which is supporting the market growth. There is a growing awareness among businesses and consumers in the Asia-Pacific region about the benefits of smart buildings, such as improved energy efficiency, enhanced security, and better occupant comfort.
Europe is implementing directives on energy efficiency and the adoption of green building practices, which is propelling the market growth. Additionally, the region is also benefiting from the integration of advanced technologies such as IoT, AI, and machine learning in building management systems, enhancing operational efficiency and occupant comfort while reducing energy consumption.
Latin America is influenced by increasing urbanization, digitalization, and growing awareness of sustainable building practices, which are contributing to the market growth. Furthermore, the adoption of smart building technologies in the region is driven by the need for energy efficiency, cost reduction, and improved building management systems.
The Middle East and Africa (MEA) region is widely adopting smart buildings, owing to its efforts to diversify economies away from oil dependency and towards smart, sustainable urban development. Furthermore, the region is also witnessing significant investments in smart city projects, which include the development of intelligent, connected buildings.
Leading Key Players in the Smart Building Industry:
Key players are engaging in innovative strategies to strengthen their market position and meet the growing demand for intelligent building solutions. They are heavily investing in research and development (R&D) to integrate cutting-edge technologies like the Internet of Things (IoT), artificial intelligence (AI), and machine learning into their offerings, enabling more efficient, sustainable, and user-friendly building management systems. Furthermore, key companies are forming strategic partnerships and collaborations with technology firms, construction companies, and government entities to expand their reach and enhance their product portfolios. Apart from this, they are emphasizing sustainability, creating solutions that not only reduce energy consumption and operational costs but also contribute to environmental conservation. Moreover, leading players are also exploring new business models, such as Building-as-a-Service (BaaS), offering clients comprehensive solutions that cover installation, maintenance, and data analysis.
The market research report has provided a comprehensive analysis of the competitive landscape. Detailed profiles of all major companies have also been provided. Some of the key players in the market include:
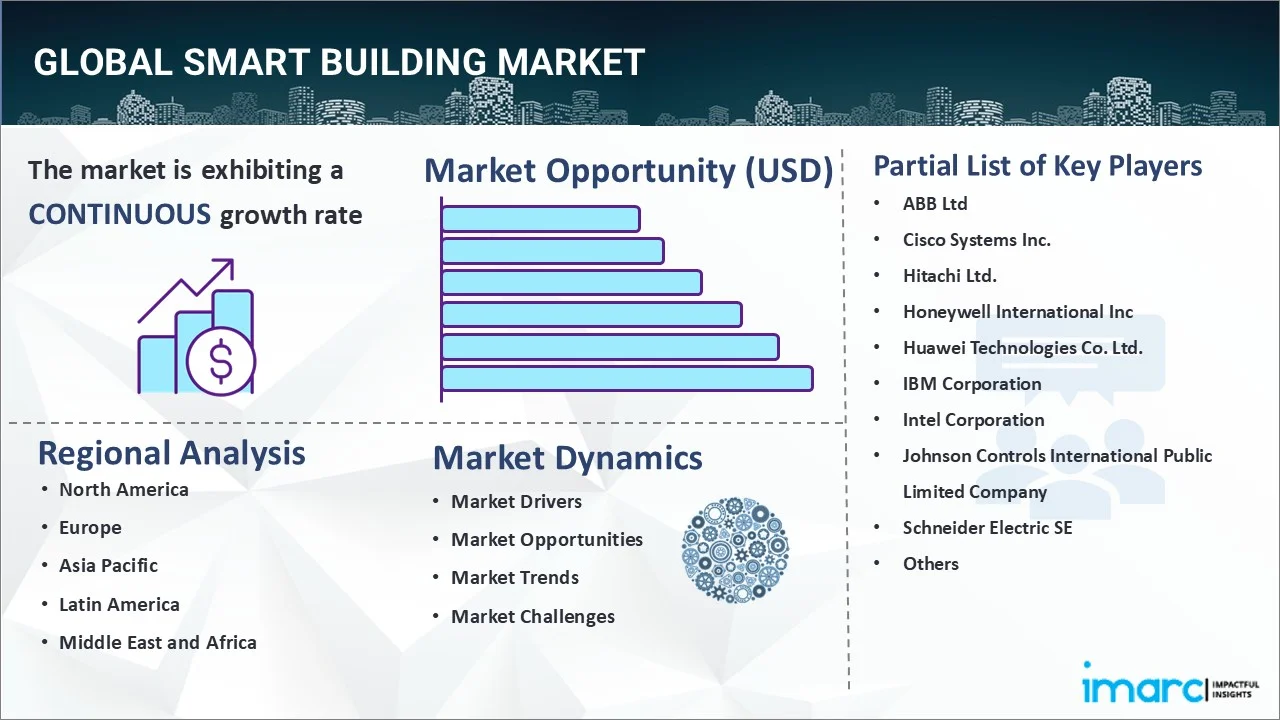
- ABB Ltd
- Cisco Systems Inc.
- Hitachi Ltd.
- Honeywell International Inc
- Huawei Technologies Co. Ltd.
- IBM Corporation
- Intel Corporation
- Johnson Controls International Public Limited Company
- Schneider Electric SE
- Siemens AG
(Please note that this is only a partial list of the key players, and the complete list is provided in the report.)
Latest News:
- In August 2022, Johson Controls signed a partnership agreement with Microsoft Beijing Campus to retrofit and optimize building operations for saving energy and ensuring key equipment uptime.
- In January 2023, Siemens AG partnered with Telefonica to transform rooms into smart buildings at Mobile World Congress (MWC).
- In January 2023, ABB launched its ABB Cyclon smart building management system at Light Middle East 2023.
Smart Building Market Report Scope:
| Report Features | Details |
|---|---|
| Base Year of the Analysis | 2025 |
| Historical Period | 2020-2025 |
| Forecast Period | 2026-2034 |
| Units | Billion USD |
| Scope of the Report | Exploration of Historical Trends and Market Outlook, Industry Catalysts and Challenges, Segment-Wise Historical and Future Market Assessment:
|
| Components Covered |
|
| Technologies Covered |
|
| End-Users Covered | Commercial, Residential, Government & Public Infrastructure, Healthcare, Education, Transport, Manufacturing & Industrial, Others |
| Regions Covered | Asia Pacific, Europe, North America, Latin America, Middle East and Africa |
| Countries Covered | United States, Canada, Germany, France, United Kingdom, Italy, Spain, Russia, China, Japan, India, South Korea, Australia, Indonesia, Brazil, Mexico, Turkey, Saudi Arabia, UAE |
| Companies Covered | ABB Ltd, Cisco Systems Inc., Hitachi Ltd., Honeywell International Inc, Huawei Technologies Co. Ltd., IBM Corporation, Intel Corporation, Johnson Controls International Public Limited Company, Schneider Electric SE, Siemens AG, etc. |
| Customization Scope | 10% Free Customization |
| Post-Sale Analyst Support | 10-12 Weeks |
| Delivery Format | PDF and Excel through Email (We can also provide the editable version of the report in PPT/Word format on special request) |
Key Questions Answered in This Report:
- How has the global smart building market performed so far, and how will it perform in the coming years?
- What are the drivers, restraints, and opportunities in the global smart building market?
- What is the impact of each driver, restraint, and opportunity on the global smart building market?
- What are the key regional markets?
- Which countries represent the most attractive smart building market?
- What is the breakup of the market based on the component?
- Which is the most attractive component in the smart building market?
- What is the breakup of the market based on technology?
- Which is the most attractive technology in the smart building market?
- What is the breakup of the market based on the end user?
- Which is the most attractive end user in the smart building market?
- What is the competitive structure of the market?
- Who are the key players/companies in the global smart building market?
Key Benefits for Stakeholders:
- IMARC’s industry report offers a comprehensive quantitative analysis of various market segments, historical and current market trends, market forecasts, and dynamics of the smart building market from 2020-2034.
- The research report provides the latest information on the market drivers, challenges, and opportunities in the global smart building market.
- The study maps the leading, as well as the fastest-growing, regional markets. It further enables stakeholders to identify the key country-level markets within each region.
- Porter's five forces analysis assists stakeholders in assessing the impact of new entrants, competitive rivalry, supplier power, buyer power, and the threat of substitution. It helps stakeholders to analyze the level of competition within the smart building industry and its attractiveness.
- The competitive landscape allows stakeholders to understand their competitive environment and provides insight into the current positions of key players in the market.
Need more help?
- Speak to our experienced analysts for insights on the current market scenarios.
- Include additional segments and countries to customize the report as per your requirement.
- Gain an unparalleled competitive advantage in your domain by understanding how to utilize the report and positively impacting your operations and revenue.
- For further assistance, please connect with our analysts.
 Request Customization
 Speak to an Analyst
 Request Brochure
 Inquire Before Buying
Benefits of Customization
- Personalize this research
- Triangulate with your data
- Get data as per your format and definition
- Gain a deeper dive into a specific application, geography, customer, or competitor
- Any level of personalization
Get in Touch With Us
UNITED STATES
Phone: +1-201-971-6302
INDIA
Phone: +91-120-433-0800
UNITED KINGDOM
Phone: +44-753-714-6104
Email: [email protected]
Client Testimonials


.webp)


