
Smart Spaces Market Size, Share, Trends and Forecast by Component, Space Type, Application, End User, and Region, 2026-2034
Global Smart Spaces Market Size, Share, Trends & Forecast (2026-2034)
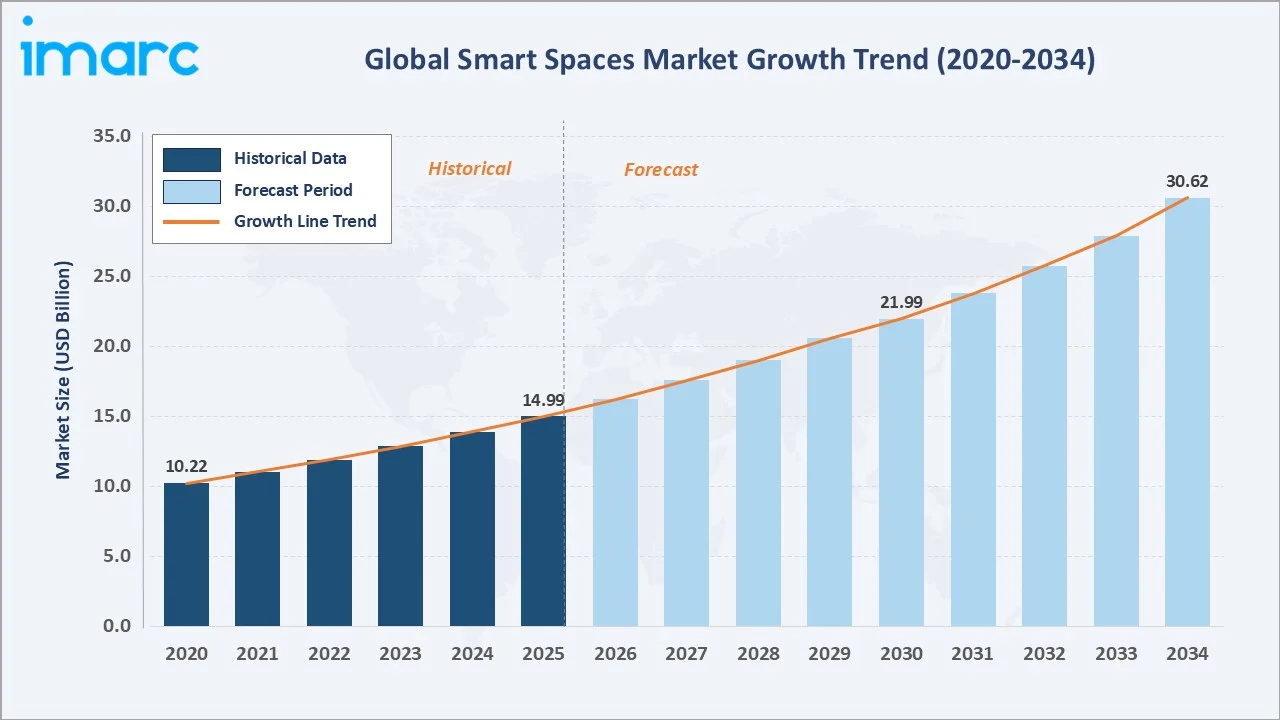
The global smart spaces market size reached USD 14.99 Billion in 2025 and is projected to reach USD 30.62 Billion by 2034, at a CAGR of 7.97% during 2026-2034. Government smart city investments, the 100 Cities completed 7,188 projects (90% of total projects) amounting to ₹ 1,44,237 crore as part of the India’s Smart Cities Mission (as of 3rd July 2024), AI-driven automation cutting energy costs, and the post-pandemic remote work boom are the primary demand catalysts. Hardware commands 60.6% of component share, commercial end-use leads at 64.0%, and North America holds 32.1% regional dominance in 2025.
Market Snapshot
|
Metric |
Value |
|
Market Size (2025) |
USD 14.99 Billion |
|
Forecast Market Size (2034) |
USD 30.62 Billion |
|
CAGR (2026-2034) |
7.97% |
|
Base Year |
2025 |
|
Historical Period |
2020-2025 |
|
Forecast Period |
2026-2034 |
|
Largest Region |
North America (32.1%, 2025) |
|
Fastest Growing Region |
Asia-Pacific (~9.8% CAGR, 2026-2034) |
|
Leading Component |
Hardware (60.6%, 2025) |
|
Leading End-User |
Commercial (64.0%, 2025) |
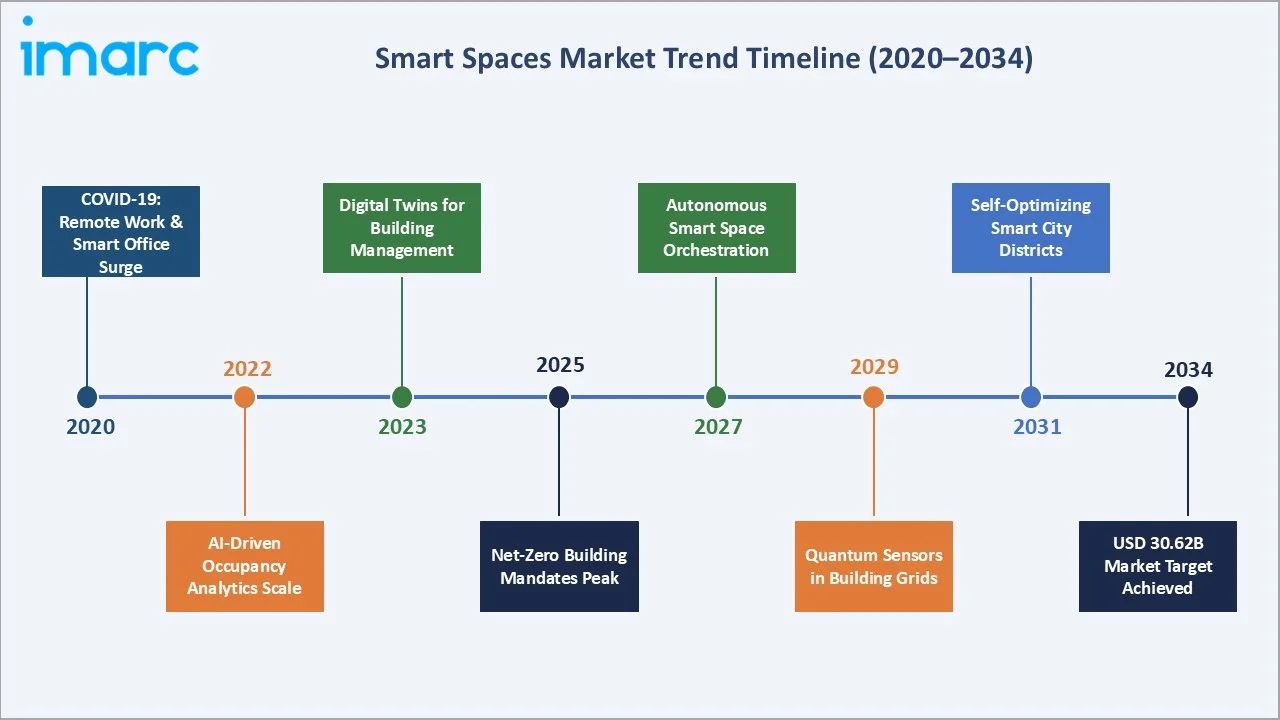
The smart spaces market trajectory from 2020 through 2034, the market grew from USD 10.22 Billion in 2020 to USD 14.99 Billion in 2025, passing through USD 21.99 Billion in 2030 before reaching the USD 30.62 Billion forecast target in 2034, representing a 3.0x growth from the 2020 base.
To get more information on this market, Request Sample
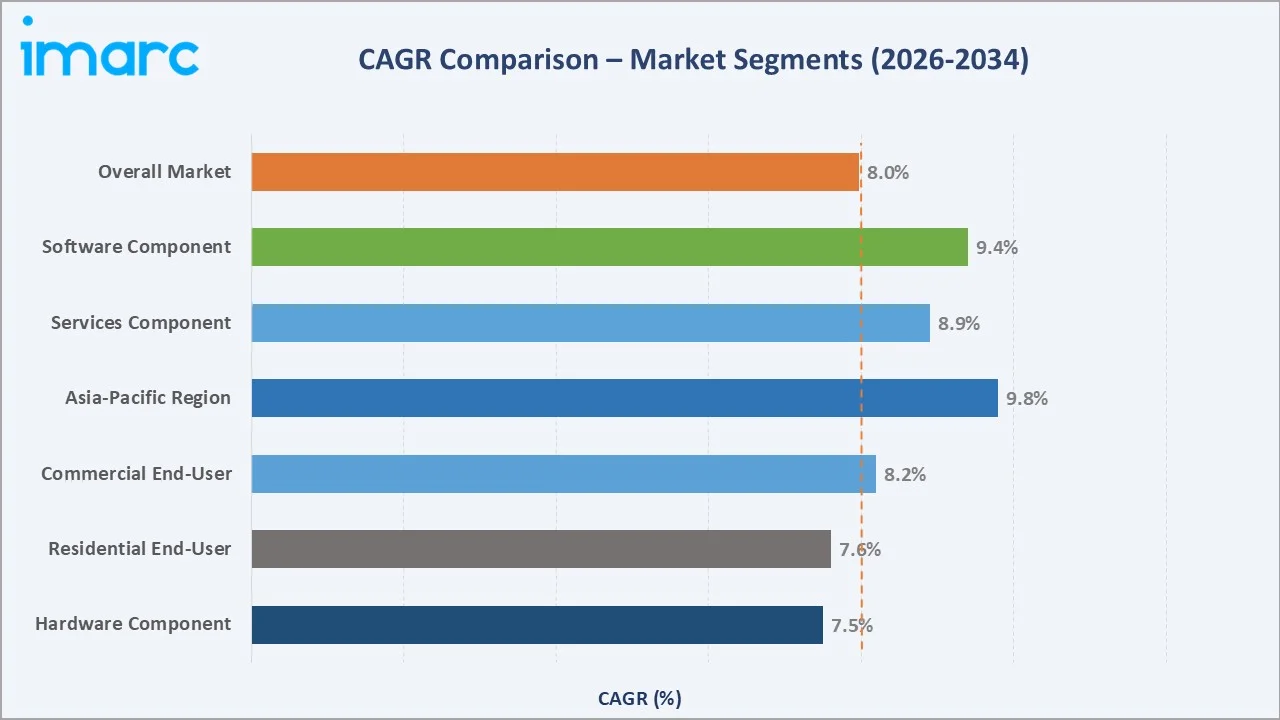
The CAGR across key segments, Asia-Pacific at ~9.8% and the software component at ~9.4% lead above the overall market rate of 7.97%, reflecting cloud-based building management system adoption and rapid Asia-Pacific smart city investment through 2034.
Executive Summary
The global smart spaces market is expanding at a 7.97% CAGR from USD 14.99 Billion in 2025 to USD 30.62 Billion by 2034. Smart spaces are physical or virtual environments where technology, data, and people interact in real time to create enhanced user experiences. They integrate IoT sensors, building management systems (BMS), AI-driven analytics, and cloud connectivity to optimize energy consumption, security, occupancy management, and environmental comfort across commercial, industrial, and residential settings.
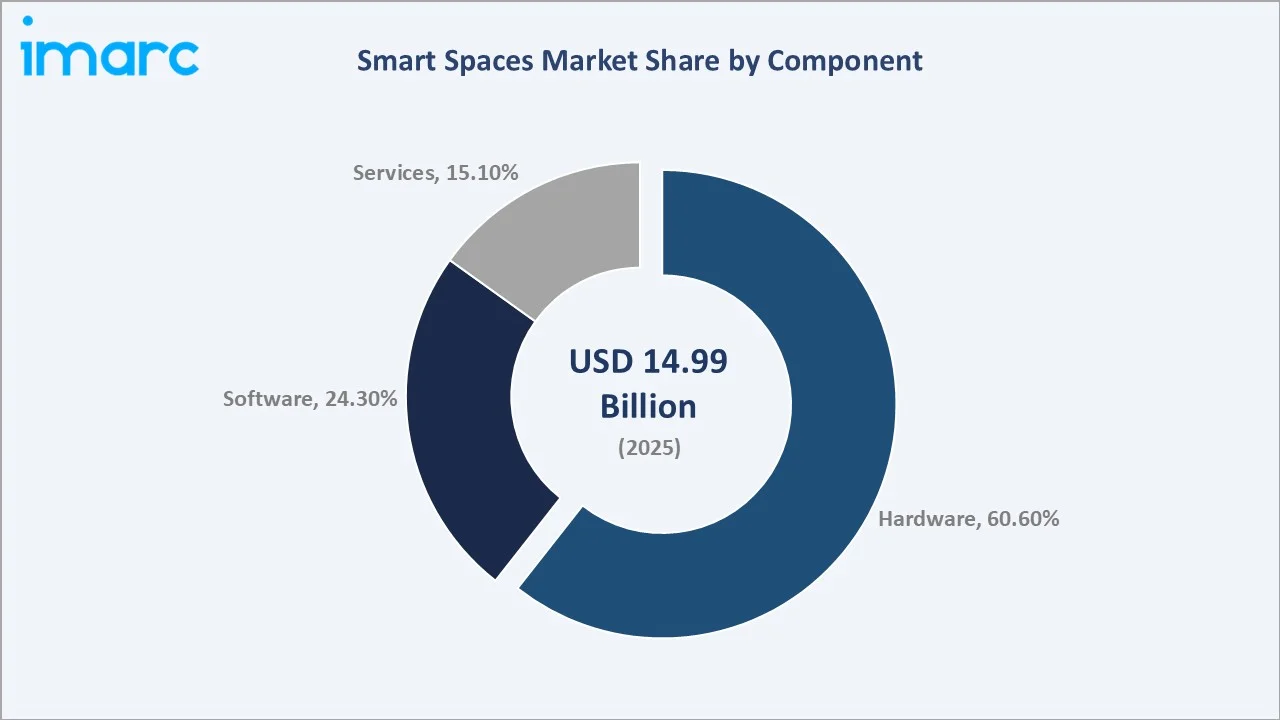
Hardware commands the largest component share at 60.6% in 2025, driven by rapid deployment of IoT devices, smart HVAC controllers, occupancy sensors, and smart lighting systems. Commercial end-use dominates at 64.0%, anchored by corporate offices, retail complexes, healthcare facilities, and educational institutions deploying smart building solutions. Automation systems in commercial buildings optimize resources, saving up to 30% in energy costs by adjusting lighting and HVAC based on occupancy patterns.
North America leads regionally at 32.1% in 2025. The US alone benefits from a dense concentration of technology firms, progressive building codes, and strong enterprise digital transformation spending. Asia-Pacific at 27.6% is growing fastest, driven by China’s smart city infrastructure rollouts and India’s Smart Cities Mission.
Key Market Insights
|
Insight |
Data / Finding |
|
Largest Component |
Hardware – 60.6% (2025) |
|
Leading End-User |
Commercial – 64.0% (2025) |
|
Leading Region |
North America – 32.1% (2025) |
|
Fastest Region |
Asia-Pacific – ~9.8% CAGR |
Key Analytical Observations Supporting the Above Data:
- Hardware at 60.6% in 2025 is the dominant component, encompassing sensors, actuators, smart thermostats, occupancy detectors, smart cameras, and IoT gateways that form the physical intelligence layer of any smart space deployment.
- Commercial end-use at 64.0% in 2025 is driven by enterprise cost management priorities and increasingly stringent building energy codes. Commercial buildings generate approximately 40% of global CO2 emissions, making smart spaces investment a regulatory compliance imperative in addition to an operational efficiency choice.
- North America’s 32.1% share in 2025 is anchored by the US smart cities market growth. The Honeywell smart city accelerator program launched in 2022 in collaboration with Accelerator for America targeted Cleveland, Louisville, Ky., Kansas City, Mo., San Diego, and Waterloo, Iowa for climate resiliency, public safety, and operational efficiency improvements.
- Asia-Pacific at 27.6% in 2025, benefits from simultaneous smart city investment across China, India, South Korea, Japan, and Southeast Asia.
Global Smart Spaces Market Overview
Smart spaces are intelligent physical environments that integrate interconnected sensors, IoT devices, software analytics platforms, and AI-driven automation to optimize operations, reduce energy consumption, enhance occupant safety, and deliver responsive user experiences. Application categories span energy management and optimization, layout and space management, emergency and disaster management, security management, and integrated facility management. Space types include smart indoor environments (offices, hospitals, retail, residential) and smart outdoor environments (campuses, parking, public infrastructure, smart city districts).
The ecosystem integrates hardware manufacturers, software analytics platforms, system integrators, cloud and connectivity providers, and end-users across commercial and residential sectors. Key macroeconomic drivers include the global buildings sector, representing 40% of global CO2 emissions, government smart city investments, and net-zero building mandates accelerating in the EU and North America.
Market Dynamics
To evaluate market opportunities, Request Sample
Market Drivers
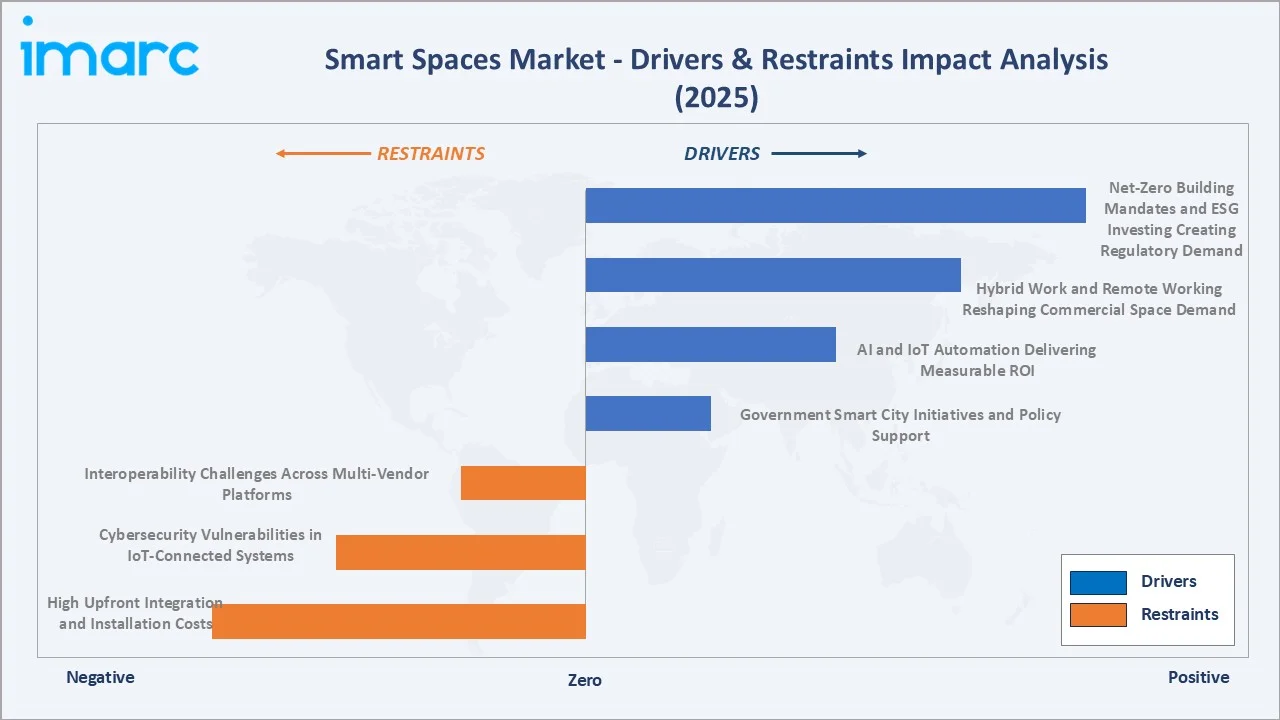
- Government Smart City Initiatives and Policy Support: Government-led smart city programs represent the single largest structural demand driver. India’s Smart Cities Mission, launched in 2015 to develop 100 smart cities, completed 7,188 projects (90% of total projects) amounting to ₹ 1,44,237 crore.
- AI and IoT Automation Delivering Measurable ROI: AI-powered energy optimization is transforming operational models by shifting from reactive responses to past utility bills toward continuous, real-time monitoring of HVAC systems, lighting zones, BMS settings, and occupancy patterns. This approach enables organizations to reduce energy costs by 20–40% without requiring major capital upgrades.
- Hybrid Work and Remote Working Reshaping Commercial Space Demand: 74% of US companies plan permanent hybrid work policies, creating fundamental demand for occupancy-adaptive smart building systems.
- Net-Zero Building Mandates and ESG Investing Creating Regulatory Demand: Buildings generate 40% of global CO2 emissions. EU member states must achieve zero-emission new buildings from 2028 and zero-emission existing buildings from 2050 under the revised Energy Performance of Buildings Directive.
Market Restraints
- High Upfront Integration and Installation Costs: Hardware procurement, system integration, network infrastructure, and software licensing collectively create CapEx barriers that defer adoption, particularly for small and medium-sized building owners.
- Cybersecurity Vulnerabilities in Connected IoT Systems: Smart building systems create expanded attack surfaces, with connected HVAC, lighting, and access control systems representing potential entry points for cyber intrusions.
Market Opportunities
- Digital Twin Technology for Building Lifecycle Management: Digital twins are becoming the primary value-creation platform in smart buildings. Microsoft Azure Digital Twins are enabling building owners to simulate renovation scenarios, model energy performance improvements, and test emergency response protocols without physical intervention.
- Healthcare and Data Center Smart Spaces: Hospital smart spaces, integrating patient room environmental automation, real-time equipment location tracking, and predictive HVAC for infection control, represent one of the highest-value smart space applications.
Market Challenges
- Talent Shortage in Smart Building Technologies: The intersection of IT, OT (operational technology), and building engineering required for smart space deployment creates a specialized talent profile that is acutely scarce.
- Data Privacy Concerns in Occupancy Monitoring: Occupancy sensors, thermal imaging cameras, and Wi-Fi probing used for space utilization analytics generate behavioral data about building occupants. GDPR (EU), CCPA (California), and PIPL (China) impose data minimization and consent requirements that complicate granular occupancy monitoring in employee workplaces.
Emerging Market Trends
1. Digital Twin Integration Enabling Predictive Building Management
Digital twins are becoming the central intelligence layer in advanced smart building deployments. Microsoft Azure Digital Twins processed building data, demonstrating enterprise-scale deployment viability.
2. Cloud-Native and SaaS Smart Building Platforms Displacing On-Premise BMS
Traditional on-premise building management systems are being displaced by cloud-native SaaS platforms that reduce upfront infrastructure costs. SaaS smart building platforms generate recurring subscription revenue and create higher customer retention through workflow integration and data network effects.
3. 5G and Edge Computing Enabling Real-Time Smart Space Response
5G’s sub-millisecond latency and edge computing capabilities are enabling smart space applications that were previously impossible with Wi-Fi and 4G infrastructure. Real-time emergency response coordination across large venues, autonomous robot navigation in smart warehouses, and simultaneous multi-sensor anomaly detection in industrial facilities require edge-processed data streams that 5G enables.
4. Net-Zero Building Certifications Driving Premium Smart Space Investment
LEED v4, BREEAM, and WELL Building Standard certifications are increasingly required by corporate tenants, institutional investors, and government occupants. In the US, LEED-certified office buildings demonstrated up to 6% rental premiums and up to 16% sale price premiums.
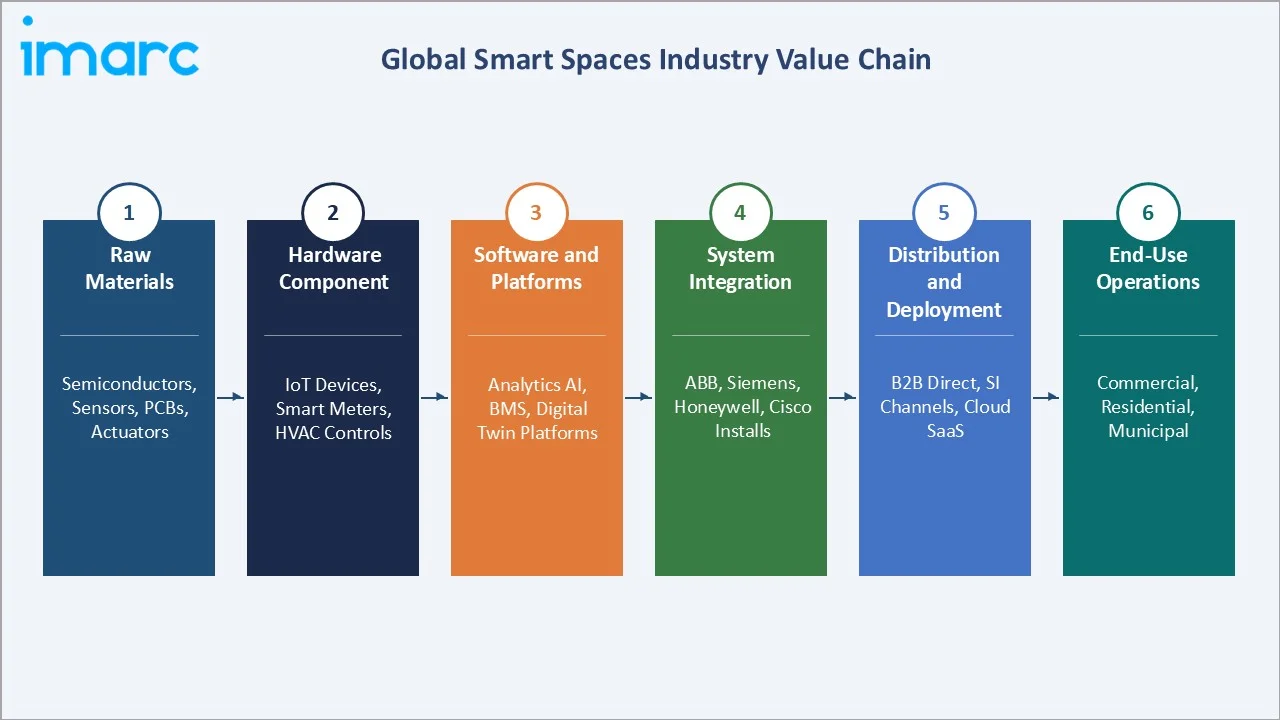
Industry Value Chain Analysis
The smart spaces value chain creates greatest margin at the software analytics and professional services stages, where AI-powered platforms command 60–70% gross margins versus 20–30% for hardware component supply.
|
Stage |
Key Players & Examples |
|
Raw Materials |
Semiconductor silicon, printed circuit boards, copper wiring, polysilicon for sensors |
|
Hardware Components |
IoT sensors, smart HVAC, smart lighting, gateways |
|
Software & Platforms |
Siemens Building X, Honeywell Forge, IBM Maximo, ABB Ability |
|
Distribution & Deployment |
Direct enterprise sales, value-added resellers, cloud marketplaces, MRO distributors |
|
End Users |
Commercial buildings (offices, retail, hospitals, campuses), residential complexes, government buildings, smart cities, industrial facilities |
System integration captures 25–35% of total smart space project value, reflecting the complexity of multi-vendor integration across hardware, software, connectivity, and building management protocol layers. Siemens and Honeywell compete aggressively for large-scale system integration contracts in hospitals, airports, and corporate campuses, because integration revenue creates multi-year service and maintenance contract relationships that generate predictable recurring revenue streams.
Technology Landscape in the Smart Spaces Industry
AI and Machine Learning for Building Intelligence
Computer vision AI applied to occupancy camera feeds, enables anonymous people counting and flow analysis that informs space utilization optimization without storing identifiable biometric data. Natural language processing enables voice-activated building control interfaces that increase end-user adoption of smart space systems by lowering the interface complexity barrier.
5G and Wireless Protocols for Smart Building Connectivity
The smart building connectivity stack is evolving from proprietary wired protocols toward wireless standards. In February 2025, Legrand, Schneider Electric, and Siemens formed an interest group to advance the NR+ connectivity standard, collaborating with wireless technology experts to establish new benchmarks for large-scale building digitization.
Digital Twin and Simulation Platforms
Physics-based digital twin platforms that model building thermal dynamics, energy flows, and occupant behavior enable simulation-driven optimization before physical changes are implemented. Buildings using digital twins for energy management report lower energy consumption versus equivalent buildings without simulation-informed control strategies.
Market Segmentation Analysis
The report covers the following segments:
|
Segment Category |
Leading Segment |
Market Share |
Year |
|
Component |
Hardware |
60.6% |
2025 |
|
Space Type |
Smart Indoor Space |
62.5% |
2025 |
|
Application |
Emergency and Disaster Management |
39.5% |
2025 |
|
End User |
Commercial |
64.0% |
2025 |
|
Region |
North America |
32.1% |
2025 |

By Component
Hardware commands 60.6% in 2025, driven by rapid deployment of IoT devices, sensors, actuators, and smart HVAC controllers. Innovations in hardware technologies, smart cameras with ML-based object detection, occupancy sensors with sub-0.5W power consumption, and smart thermostats with embedded AI have revolutionized physical space intelligence.
To access detailed market analysis, Request Sample
Software at 24.3% in 2025, growing at ~9.4% CAGR, is the highest-margin and fastest-growing segment. AI-powered maintenance prediction, reducing operational costs directly, justifies software subscription investments. Services at 15.1% encompass initial system design, integration, commissioning, training, and ongoing managed services contracts that generate the highest customer lifetime value in the smart spaces ecosystem.
By End User
Commercial end-use at 64.0% in 2025 reflects the highest ROI density of smart space investment. Commercial buildings generating 40% of global CO2 emissions face regulatory compliance imperatives that make smart energy management non-discretionary spending. Office buildings, retail complexes, hospitals, airports, and universities collectively represent the addressable commercial smart space market.
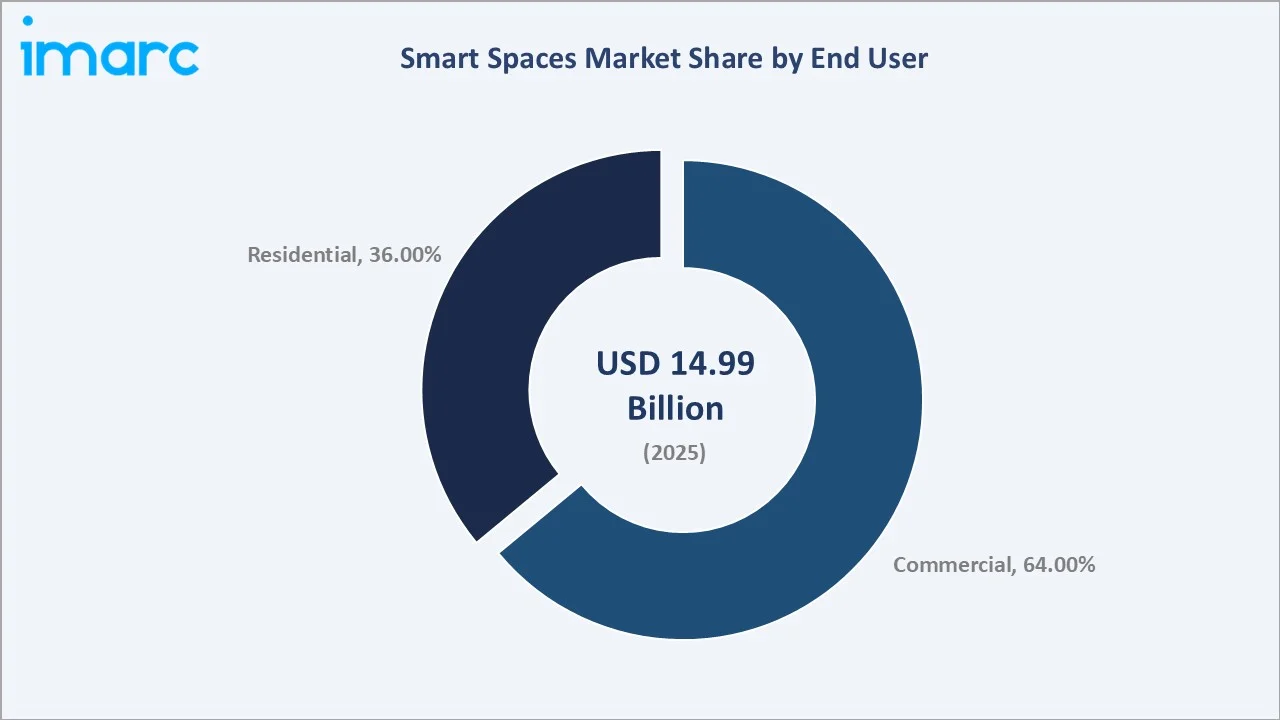
Residential end-use at 36.0% in 2025 is growing steadily. 3.4 million American families saved $8.4 billion on clean energy and energy efficiency investments in 2023, and are subsidizing smart HVAC, smart thermostats, and home energy management system installations.
Regional Market Insights
|
Region |
Share (2025) |
Key Drivers & Data |
|
North America |
32.1% |
US smart cities growth, IRA clean energy rebates |
|
Asia-Pacific |
27.6% |
India Smart Cities Mission, China urbanization plan, Thailand 105 smart cities by 2027 |
|
Europe |
21.4% |
EU EPBD net-zero by 2028/2050, LEED/BREEAM certifications driving adoption |
|
Latin America |
9.8% |
Brazil smart building investment growth, Mexico City smart infrastructure, Colombia digital transformation plans |
|
Middle East & Africa |
9.1% |
Saudi Vision 2030 NEOM smart city, UAE Abu Dhabi smart government, Dubai Smart City initiative, Africa smart infrastructure growth |
North America’s 32.1% regional dominance in 2025 reflects both public sector investment and enterprise adoption. Honeywell’s smart city accelerator program, launched in 2022 in collaboration with Accelerator for America, targeted major US cities for climate resiliency, public safety, and operational efficiency improvements. The U.S. Department of Energy’s Better Buildings Initiative, working alongside nearly 1,000 partners from businesses and government, achieved energy cost savings of $13.5 billion and reduced carbon emissions by over 130 million metric tons, comparable to the annual emissions of 28.2 million vehicles. These gains in building efficiency play a crucial role in advancing the target of achieving net-zero carbon emissions by 2050, demonstrating the scale of government-private sector collaboration driving commercial smart building adoption.
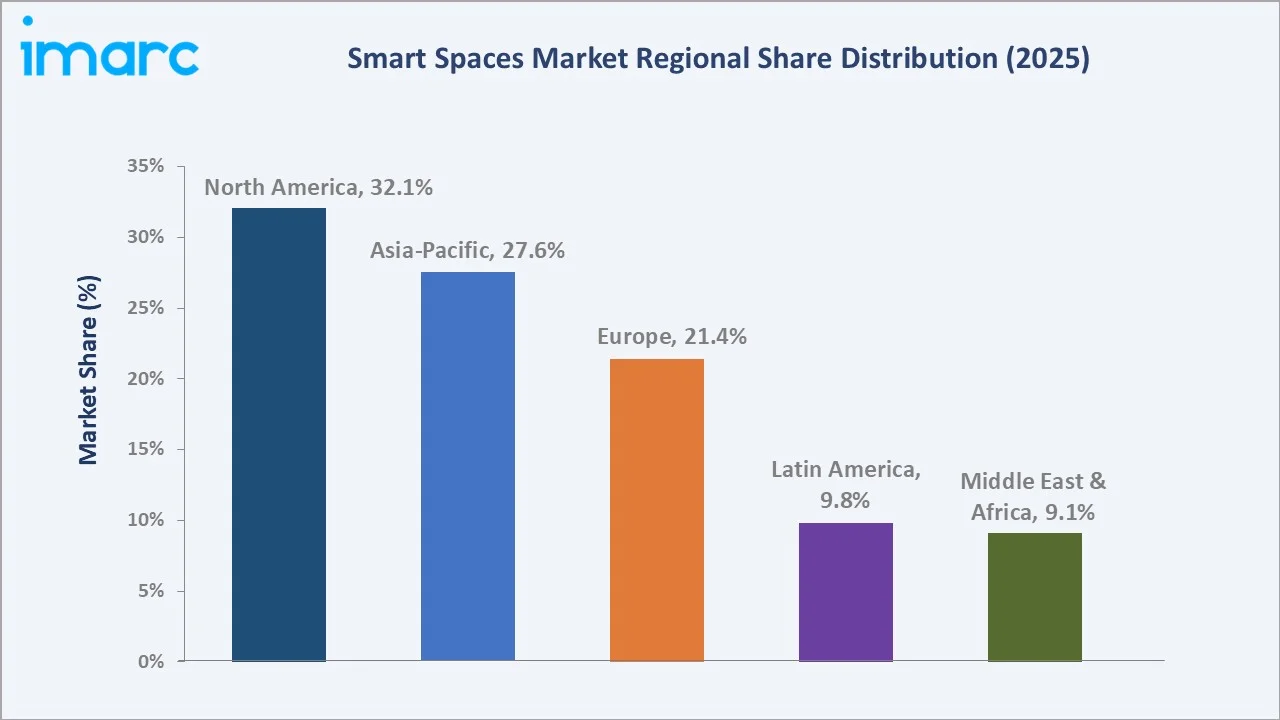
Asia-Pacific at 27.6% in 2025, growing at ~9.8% CAGR, is the market’s most dynamic growth region. India’s Smart Cities Mission completed 7,202 of 8,018 tendered projects as of July 2024, deploying INR 1,44,530 crore across 100 designated smart cities. China’s new-type urbanization plan commits to smart infrastructure creating one of the world’s most comprehensive residential smart space deployments.
Competitive Landscape
The global smart spaces market is moderately concentrated. The top 5 players, Siemens, Honeywell, ABB, Cisco, and IBM, collectively account for an estimated 45–55% of total market revenue in 2025.
|
Company Name |
Key Brand |
Market Position |
Core Strength |
|
Siemens AG |
Building X / Desigo CC |
Leader |
Digital twin BMS, lighting-security-HVAC integration under unified UI |
|
Honeywell International |
Honeywell Forge / Niagara |
Leader |
Forge cloud analytics, large number of buildings connected globally |
|
ABB Ltd. |
ABB Ability BuildingPro |
Leader |
Electrification + automation integration, net-zero retrofit leadership |
|
Cisco Systems Inc. |
Cisco Spaces / Meraki MV |
Leader |
Network-centric smart building; Modcam video analytics acquisition (2020) |
|
IBM Corporation |
IBM Maximo |
Leader |
AI-predictive maintenance, enterprise asset management leadership |
|
Hitachi Digital Services |
Hitachi Lumada |
Challenger |
Social innovation IoT, digital twin analytics, data-driven facility management platform |
|
Smarten Spaces |
Jumpree Platform |
Emerging |
Workplace experience AI, occupancy optimization, Asia-Pacific hybrid office specialist |
The market bifurcates between diversified technology conglomerates with integrated hardware-software-services portfolios and specialist software platforms serving niche applications.
Key Company Profiles
Siemens AG
Siemens AG, headquartered in Munich, Germany, is a global technology conglomerate. Siemens’ Smart Infrastructure division is the company’s primary smart spaces business unit, producing building automation, energy distribution, and smart grid solutions for commercial buildings, campuses, and urban infrastructure.
- Product Portfolio: Siemens Building X, Desigo CC
- Recent Developments: In November 2021, Smart Spaces, a smart building operating system, entered a strategic partnership with Siemens to support its expansion into the Middle East and the higher education sector.
- Strategic Focus: Siemens’ smart spaces strategy centers on Building X as the cloud-native platform that integrates all previously siloed Siemens building technology products into a single ecosystem, creating data-driven cross-system optimization that individual point solutions cannot achieve.
Honeywell International
Honeywell International is headquartered in Charlotte, North Carolina, United States. Honeywell’s Building Automation division is a leading provider of building automation, HVAC controls, fire safety, and security systems. Honeywell’s Forge platform positions the company as one of the world’s largest IoT-connected building management operators by number of buildings served.
- Product Portfolio: Honeywell Forge, Niagara Framework
- Recent Developments: In March 2026, Honeywell collaborated with Rhombus to enhance its portfolio of cloud-connected security and access systems with new AI-driven video technologies. This move builds on Honeywell’s efforts to modernize building security, following its 2024 acquisition of LenelS2.
- Strategic Focus: Honeywell’s smart spaces strategy leverages the Niagara Framework’s market-standard position to upsell connected Forge cloud services to existing Niagara customers, creating an upgrade revenue pipeline. The company’s ESG advisory services division targets Fortune 500 corporate real estate teams seeking LEED/BREEAM certification paths, positioning Honeywell as a strategic sustainability partner rather than merely a hardware vendor.
ABB Ltd.
ABB Ltd. Is headquartered in Zurich, Switzerland. ABB’s Smart Buildings division provides electrical installation, HVAC automation, smart lighting control, and integrated building management systems globally.
- Product Portfolio: ABB Ability (cloud IoT platform for building and industrial automation)
- Recent Developments: In November 2025, ABB launched ABB Ability BuildingPro, a cybersecure integration platform designed to connect, manage, and optimize building operations.
- Strategic Focus: ABB’s smart spaces strategy focuses on the electrification-automation convergence, positioning smart buildings as active participants in smart grid demand response rather than passive energy consumers.
Cisco Systems Inc.
Cisco Systems is headquartered in San Jose, California. Cisco’s Smart Buildings and Connected Workplace solutions leverage the company’s core networking infrastructure as the connectivity backbone for smart space deployments.
- Product Portfolio: Cisco Spaces (cloud-based location intelligence and workplace analytics platform), Cisco Meraki MV smart cameras (ML-based video analytics for occupancy and security)
- Recent Developments: In November 2024, Cisco unveiled a new range of intelligent, secure, and reliable wireless innovations, including smart Wi-Fi 7 access points and unified subscription licensing designed to support smart spaces right from deployment.
- Strategic Focus: Cisco’s smart spaces strategy positions the company’s ubiquitous enterprise network infrastructure as the smart building connectivity foundation, creating natural expansion opportunities for Cisco Spaces analytics and Meraki camera deployments in buildings where Cisco networking hardware is already installed.
Market Concentration Analysis
The smart spaces market exhibits moderate concentration at the platform technology tier. The top 5 players hold an estimated 40–57% of total market revenue in 2025, with a higher concentration in the commercial building automation sub-segment. The software and analytics segment is more fragmented, with 100+ niche vendors serving specific application categories.
Consolidation is accelerating through M&A. Private equity firms are increasingly targeting smart building software companies, with sub-USD 100 Million niche players in occupancy analytics, visitor management, and energy monitoring, at 4–8x revenue multiples reflecting the SaaS economics of recurring subscription businesses with high retention rates.
Investment & Growth Opportunities
Fastest-Growing Segments
Software at ~9.4% CAGR is the highest-return investment segment, generating 60–70% gross margins versus 20–30% for hardware. AI-powered building management platforms that guarantee contractual energy performance outcomes, as pioneered by Siemens’ net-zero buildings consulting practice, represent the highest-value commercial model, commanding 3–5x pricing premiums over conventional software licenses. Asia-Pacific at ~9.8% CAGR is the highest-volume growth region investment opportunity, with India’s USD 17.3 Billion Smart Cities Mission creating procurement pipelines that are growing at 12% annually for smart building technology vendors with relevant government sales capabilities.
Emerging Markets
Saudi Arabia’s NEOM smart city project represents the single largest greenfield smart spaces procurement opportunity globally. UAE’s Dubai Smart City initiative and Abu Dhabi’s smart government programs collectively form MEA smart spaces procurement. Southeast Asia’s combined smart infrastructure pipeline across Indonesia, Vietnam, Malaysia, Thailand, and the Philippines favors vendors with ASEAN government relationships and mid-price-point offerings competitive with Chinese alternatives.
Venture and Investment Trends
Key investment themes include AI-native workplace experience platforms, net-zero building analytics, and healthy building monitoring. Honeywell, Siemens, and ABB all maintain corporate venture arms actively investing in smart building startups at seed and Series A to track emerging technology that can be acquired or partnered with as capabilities mature. Strategic M&A multiples for smart building SaaS companies with proven enterprise revenue and high retention range, reflecting investor confidence in the sector’s structural growth.
Future Market Outlook (2026-2034)
The global smart spaces market is positioned for sustained, technology-driven expansion through 2034, anchored by mandatory net-zero building regulations, the structural shift to hybrid work, and the transformative impact of AI and digital twin integration on building management economics. From USD 14.99 Billion in 2025, the market is forecast to reach USD 21.99 Billion by 2030 and USD 30.62 Billion by 2034, representing USD 15.63 Billion in absolute incremental value over the nine-year forecast horizon.
Technological disruptions, including autonomous AI building management systems that require zero human intervention for routine operations by 2029–2031, quantum sensing networks enabling nanometer-precision structural monitoring, and self-healing smart building systems that automatically reconfigure after component failures, are expected to materially reshape the smart spaces competitive landscape. These efficiency gains will accelerate smart building investment decisions by owners who previously hesitated at the CapEx threshold.
Research Methodology
Primary Research
Primary research encompassed over 60 structured interviews with smart spaces market participants including VP-level Smart Building product managers, facility management directors, city technology officers, ESG consultants specializing in LEED and BREEAM building certification, and system integrators specializing in building automation projects.
Secondary Research
Key secondary sources include India Smart Cities Mission Progress Report, IEA Buildings Report, ASHRAE 90.1 Building Energy Standard documentation, EU EPBD Directive 2024 revised text, JLL Global Commercial Real Estate Market Report, Honeywell Annual Report, and trade publications including Facilities Management Journal, Buildings Magazine, and Smart Energy International.
Forecasting Models
IMARC’s Bottom-Up and Top-Down estimation models were applied in parallel and cross-validated. Bottom-Up aggregates smart spaces demand by component category across end-user segments and regional markets. Top-Down applies global building construction market growth rates, commercial real estate energy management spending benchmarks, and smart city investment commitments as cross-validation parameters.
Smart Spaces Market Report Scope:
| Report Features | Details |
|---|---|
| Base Year of the Analysis | 2025 |
| Historical Period | 2020-2025 |
| Forecast Period | 2026-2034 |
| Units | Billion USD |
| Scope of the Report | Exploration of Historical Trends and Market Outlook, Industry Catalysts and Challenges, Segment-Wise Historical and Future Market Assessment:
|
| Components Covered | Hardware, Software, Services |
| Space Types Covered | Smart Indoor Space, Smart Outdoor Space |
| Applications Covered | Energy Management and Optimization, Layout and Space Management, Emergency and Disaster Management, Security Management, Others |
| End Users Covered |
|
| Regions Covered | Asia Pacific, Europe, North America, Latin America, Middle East and Africa |
| Countries Covered | United States, Canada, Germany, France, United Kingdom, Italy, Spain, Russia, China, Japan, India, South Korea, Australia, Indonesia, Brazil, Mexico |
| Companies Covered | Siemens AG, Honeywell International, ABB Ltd., Cisco Systems Inc., IBM Corporation, Hitachi Digital Services, Smarten Spaces, etc. |
| Customization Scope | 10% Free Customization |
| Post-Sale Analyst Support | 10-12 Weeks |
| Delivery Format | PDF and Excel through Email (We can also provide the editable version of the report in PPT/Word format on special request) |
Key Benefits for Stakeholders:
- IMARC’s industry report offers a comprehensive quantitative analysis of various market segments, historical and current market trends, market forecasts, and dynamics of the smart spaces market from 2020-2034.
- The research report provides the latest information on the market drivers, challenges, and opportunities in the global smart spaces market.
- The study maps the leading, as well as the fastest-growing, regional markets. It further enables stakeholders to identify the key country-level markets within each region.
- Porter's five forces analysis assists stakeholders in assessing the impact of new entrants, competitive rivalry, supplier power, buyer power, and the threat of substitution. It helps stakeholders to analyze the level of competition within the smart spaces industry and its attractiveness.
- Competitive landscape allows stakeholders to understand their competitive environment and provides an insight into the current positions of key players in the market.
Frequently Asked Questions About the Smart Spaces Market Report
The global smart spaces market reached USD 14.99 Billion in 2025, growing from USD 10.22 Billion in 2020. Growth is driven by government smart city programs, AI-driven automation saving 30% energy costs, and hybrid work office digitalization.
The market is projected to reach USD 30.62 Billion by 2034 at a CAGR of 7.97%, passing through USD 21.99 Billion in 2030. Net-zero building mandates, digital twin adoption, and Asia-Pacific smart city expansion are key growth drivers.
Smart spaces are physical environments integrating IoT sensors, AI analytics, and automation to optimize energy use, security, and occupancy management. They include smart offices, smart homes, smart hospitals, and smart city infrastructure components.
Hardware leads at 60.6% in 2025, including IoT sensors, smart HVAC controllers, occupancy sensors, and smart cameras. Software is growing fastest at ~9.4% CAGR, driven by AI-powered analytics platforms and digital twin building management systems.
Commercial end-use dominates at 64.0% in 2025. Commercial buildings generate 40% of global CO2 emissions, making smart energy management a regulatory compliance imperative. Smart automation saves up to 30% in building energy costs.
North America leads at 32.1% in 2025, with the US contributing 91.8% of the regional share. The US smart cities market growth and the Honeywell smart city accelerator program targeting major US cities in 2022.
Asia-Pacific at 27.6% (2025) is the fastest-growing region at ~9.8% CAGR. India’s Smart Cities Mission completed 7,202 of 8,018 projects by July 2024, and Singapore’s Smart Nation commits to smart infrastructure.
Key players include Siemens AG, Honeywell International, ABB Ltd., Cisco Systems Inc., IBM Corporation, Hitachi Digital Services., and Smarten Spaces.
Key drivers include government smart city investments, AI automation saving building energy costs, hybrid work creating occupancy-adaptive office demand, and EU net-zero building mandates requiring compliance.
AI-enhanced analytics predict maintenance needs and reduce operational costs. Occupancy AI dynamically adjusts lighting and HVAC, saving up to 30% energy. IBM Watson IoT and Siemens Building X are leading AI-powered smart space platforms.
Key challenges include high upfront integration costs, cybersecurity vulnerabilities in IoT networks, multi-vendor interoperability gaps and proprietary protocols, and a talent shortfall in smart building engineering.
Need more help?
- Speak to our experienced analysts for insights on the current market scenarios.
- Include additional segments and countries to customize the report as per your requirement.
- Gain an unparalleled competitive advantage in your domain by understanding how to utilize the report and positively impacting your operations and revenue.
- For further assistance, please connect with our analysts.
 Request Customization
 Speak to an Analyst
 Request Brochure
 Inquire Before Buying
Benefits of Customization
- Personalize this research
- Triangulate with your data
- Get data as per your format and definition
- Gain a deeper dive into a specific application, geography, customer, or competitor
- Any level of personalization
Get in Touch With Us
UNITED STATES
Phone: +1-201-971-6302
INDIA
Phone: +91-120-433-0800
UNITED KINGDOM
Phone: +44-753-714-6104
Email: [email protected]
Client Testimonials


.webp)


