
Sodium Silicate Prices, Trend, Chart, Demand, Market Analysis, News, Historical and Forecast Data Report 2026 Edition
Sodium Silicate Prices – Latest Update (February 2026)
In February 2026, sodium silicate prices were USD 0.55/Kg in Northeast Asia, USD 0.63/Kg in Europe, USD 0.62/Kg in India, and USD 0.46/Kg in North America. Prices generally fluctuate due to variations in raw material costs, particularly silica sand and soda ash, along with changes in energy prices required for high-temperature production processes. Demand from end-use industries such as detergents, construction, paper, and water treatment, as well as regional supply conditions and freight rates, also significantly influence pricing trends. IMARC Group updates sodium silicate price data monthly across all major markets.
Global sodium silicate prices are averaging around USD 0.48 - 0.63 per Kg in feburuary 2026. The main sources of silica sand, soda ash (sodium carbonate), and sodium silicate as feedstocks remained significant cost factors. Price fluctuations for these inputs had a direct effect on manufacturers' production costs, which in turn affected prices around the world. Pricing was still heavily influenced by industrial demand from the water treatment, detergent, and building industries. Early in 2026, demand for detergents and industrial cleaning chemicals remained steady while construction activity in some areas remained muted, resulting in contradictory demand signals.
Furthermore, delivered costs were still impacted by logistics, specifically freight prices, import availability, and port congestion. Improved import flexibility and container availability helped balance local supply and avoid steep price spikes in areas like North America. Global trade patterns, particularly imports into North American and European markets from Asia, contributed to supply stabilization and pushed spot prices lower. Asian-origin sodium silicate became more competitive due to a stronger US dollar, which allowed traders to exert more pressure on regional producers.
Latest Key Prices Snapshot February 2026
| Metric | Latest Value |
|---|---|
| Global Benchmark Price | USD 0.58/Kg |
| Northeast Asia | USD 0.55/Kg |
| Europe | USD 0.63/Kg |
| India | USD 0.62/Kg |
| North America | USD 0.46/Kg |
| Monthly Change % | +0.5% to +1.1% |
| YoY Change % | 5.2% (Slightly higher) |
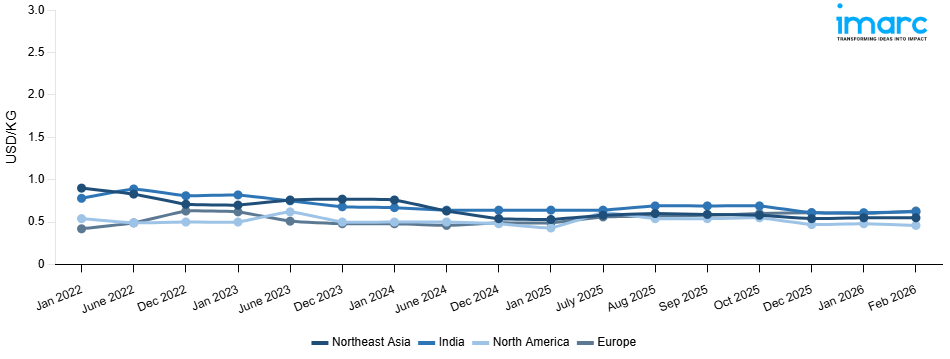
Sodium Silicate Price Index (USD/KG):
The chart below highlights monthly sodium silicate prices across different regions.
Get Access to Monthly/Quarterly/Yearly Prices, Request Sample
Prices rose in Northeast Asia from USD 0.53/Kg in January 2025 to USD 0.55/Kg in January 2026, reflecting a modest increase. Stable export activity and stronger demand from the silica, detergent, and construction industries were the main drivers of the increasing trend. Prices in India showed a slight dip, going from USD 0.64/Kg to USD 0.61/Kg. Improved inventory levels, tempered demand from downstream industries, and balanced domestic supply were the primary causes of the correction. In North America, prices also rose from USD 0.43/Kg to USD 0.48/Kg due to greater shipping and operating expenses as well as increased demand from the water treatment and automobile industries. Additionally, Europe saw the most price increase of any region, rising from USD 0.49 to USD 0.60 per kilogram. The increased trend was largely driven by stable industrial demand, tighter regional supply, and higher energy costs.
Key Factors Influencing Sodium Silicate Prices:
Several factors influence sodium silicate price movements globally
- Raw Material Costs: Sodium silicate production depends primarily on soda ash and silica sand. Fluctuations in the prices and availability of these feedstocks directly affect manufacturing costs and pricing strategies.
- Energy Prices: The production process is energy-intensive, requiring high-temperature furnace operations. Variations in natural gas and electricity costs significantly influence overall production expenses and regional price trends.
- Demand from End-Use Industries: Consumption patterns in detergents, construction, water treatment, pulp and paper, and adhesives sectors strongly impact pricing. Changes in industrial output and infrastructure activity alter procurement volumes and market sentiment.
- Supply-Demand Balance: Production capacity utilization rates, inventory levels, and regional supply availability determine market tightness or oversupply conditions, shaping price direction.
- Trade Policies and Logistics: Import-export regulations, freight costs, port congestion, and currency fluctuations affect cross-border trade flows and landed costs, influencing regional sodium silicate price movements.
Sodium Silicate Price Trend Overview by Region – February 2026
Northest Asia: The sodium silicate prices in Northeast Asia reached 0.55 USD/KG in February 2026. The prices were unchanged from the previous month. The level movement indicated consistent demand from the water treatment, construction, and detergent industries as well as balanced supply conditions. Variability was avoided by sufficient feedstock supply and uniform producer operating rates, and regional market equilibrium was preserved by steady export flows.
Europe: The sodium silicate prices in Europe reached 0.63 USD/KG in February 2026. The upward pricing movement registered between January and February 2026 was 5.0%. Prices increased, supported by higher energy and production costs, along with firm demand from construction chemicals and industrial applications. Controlled supply conditions and steady procurement activity allowed producers to maintain stronger pricing levels.
India: The sodium silicate prices in India reached 0.62 USD/KG in February 2026. The upward pricing movement registered between January and February 2026 was 1.6%. The bullish movements were attributed to improved domestic demand and stable raw material costs. Steady industrial activity and balanced inventories supported the positive pricing trend.
North America: The sodium silicate prices in North America reached 0.46 USD/KG in February 2026. The downward pricing movement registered between January and February 2026 was 4.2%. Prices declined, reflecting moderate demand conditions and sufficient supply availability. Competitive pricing strategies and stable feedstock costs contributed to the softer market environment.
Sodium Silicate Price Forecast
Short-Term Trend (Next 3 Months)
Prices for sodium silicate are predicted to stay mostly steady over the next three months, with a faintly solid undertone. Based on stable production rates and sufficient inventory levels across major suppliers, market fundamentals show balanced supply circumstances. It is anticipated that demand from important downstream industries such detergents, pulp and paper, water treatment, and construction-related applications will stay steady, creating a stable base of consumption. Strong cost-driven volatility is expected to be limited by the expected stability of raw material costs, especially those of soda ash and silica sand. If operational costs rise, energy costs might provide some modest upward pressure on prices, which might enable producers to look for small price adjustments. However, major price increases are probably going to be limited by competitive supplier dynamics and conservative procurement tactics.
Mid-Term Trend (2026–2027)
Prices for sodium silicate are anticipated to follow a moderately firm trajectory in 2026–2027, bolstered by a slow increase in downstream demand and changing industrial needs. A stable consumption base from the expansion of construction chemicals, detergents, water treatment, and catalyst applications is anticipated to support consistent procurement activity. Initiatives to build infrastructure and a greater focus on environmental treatment options could strengthen the demand momentum even more. The direction of price will continue to be heavily influenced by changes in raw materials, especially silica sand and soda ash. Variations in the energy market and laws pertaining to sustainability and emissions may eventually result in mild cost pressures.
Sodium Silicate Price History (2022–2026)
| Year | Market Movement | Key Event |
|---|---|---|
| 2021-2022 | Mixed Correction | Industrial recovery and raw material cost escalation |
| 2023-2024 | Downward Correction | Demand slowdown and inventory adjustments |
| 2025 | Mild Recovery | Improved infrastructure activity and balanced supply |
| 2026 | Stabilization | Steady feedstock costs and consistent downstream demand |
This historical trend shows recurring cycles tied to macroeconomic and agricultural supply factors.
Sodium Silicate Industry Analysis
The global sodium silicate industry size reached USD 8.54 Billion in 2025. By 2034, IMARC Group expects the market to reach USD 11.90 Billion, at a projected CAGR of 3.75% during 2026-2034. The rapid industrialization activities, implementation of stringent environmental regulations, increasing urbanization and infrastructural development, widespread product utilization in water treatment, and increasing product adoption as an adhesive in automotive manufacturing are some of the major factors propelling the market.
Sodium Silicate Industry Outlook
The global sodium silicate market is positioned for growth through 2026 and into the mid-term horizon, driven by consistent industrial demand, evolving end-use applications, and balanced supply conditions. After experiencing volatility during the pandemic years, the market has entered a more predictable phase where pricing, production, and consumption are guided by structural fundamentals rather than short-lived disruptions.
Latest Developments in the Sodium Silicate Industry
- October 2025: In a research study, the potential of sodium-ion batteries was put to test by synthesizing sodium iron silicate cathodes using aliphatic diols.
About Sodium Silicate
Sodium silicate is an inorganic combination of sodium and silica oxide that is colorless and flake-like. It is made up of a counterion of silicate. Sand's silicon dioxide and soda ash's sodium oxide are combined to create it. Sodium silicate is widely utilized in refractory cement, drilling fluid adhesives, mineral processing soaps, detergents, and zeolites. It is frequently found in crystalline and anhydrous forms. Apart from this, it has a lot of other qualities, like increased stability in alkaline solutions, resistance to water and acid, high temperature, and a powerful adhesive. Consequently, sodium silicate is used extensively in a wide range of industrial sectors.
Key Supplier List
The key suppliers of sodium silicate are PQ Corporation,
- BASF SE
- Evonik Industries AG
- Occidental Petroleum Corporation (via OxyChem)
- Tokuyama Corporation
- Nippon Chemical Industrial CO., LTD
Report Coverage
| Key Attributes | Details |
|---|---|
| Product Name | Sodium Silicate |
| Report Features | Exploration of Historical Trends and Market Outlook, Industry Demand, Industry Supply, Gap Analysis, Challenges, Sodium Silicate Price Analysis, and Segment-Wise Assessment. |
| Currency/Units | US$ (Data can also be provided in local currency) or Metric Tons |
| Region/Countries Covered | The current coverage includes analysis at the global and regional levels only. Based on your requirements, we can also customize the report and provide specific information for the following countries: Asia Pacific: China, India, Indonesia, Pakistan, Bangladesh, Japan, Philippines, Vietnam, Thailand, South Korea, Malaysia, Nepal, Taiwan, Sri Lanka, Hongkong, Singapore, Australia, and New Zealand Europe: Germany, France, United Kingdom, Italy, Spain, Russia, Turkey, Netherlands, Poland, Sweden, Belgium, Austria, Ireland, Switzerland, Norway, Denmark, Romania, Finland, Czech Republic, Portugal and Greece North America: United States and Canada Latin America: Brazil, Mexico, Argentina, Columbia, Chile, Ecuador, and Peru Middle East & Africa: Saudi Arabia, UAE, Israel, Iran, South Africa, Nigeria, Oman, Kuwait, Qatar, Iraq, Egypt, Algeria, and Morocco The list of countries presented is not exhaustive. Information on additional countries can be provided if required by the client. |
| Information Covered for Key Suppliers |
|
| Customization Scope | The report can be customized as per the requirements of the customer |
| Report Price and Purchase Option |
Plan A: Monthly Updates - Annual Subscription
Plan B: Quarterly Updates - Annual Subscription
Plan C: Biannually Updates - Annual Subscription
|
| Post-Sale Analyst Support | 360-degree analyst support after report delivery |
| Delivery Format | PDF and Excel through email (We can also provide the editable version of the report in PPT/Word format on special request) |
Key Benefits for Stakeholders:
- IMARC’s report presents a detailed analysis of sodium silicate pricing, covering global and regional trends, spot prices at key ports, and a breakdown of FOB and CIF prices.
- The study examines factors affecting sodium silicate price trend, including input costs, supply-demand shifts, and geopolitical impacts, offering insights for informed decision-making.
- The competitive landscape review equips stakeholders with crucial insights into the latest market news, regulatory changes, and technological advancements, ensuring a well-rounded, strategic overview for forecasting and planning.
- IMARC offers various subscription options, including monthly, quarterly, and biannual updates, allowing clients to stay informed with the latest market trends, ongoing developments, and comprehensive market insights. The sodium silicate price charts ensure our clients remain at the forefront of the industry.
Frequently Asked Questions About the Sodium Silicate Prices Report
As of February 2026, sodium silicate prices were USD 0.55/Kg in Northeast Asia, USD 0.63/Kg in Europe, USD 0.62/Kg in India, and USD 0.46/Kg in North America. IMARC Group updates sodium silicate price data monthly across all major markets.
The sodium silicate price trend in 2026 is generally stable with mild regional variations, influenced by balanced supply–demand fundamentals, steady feedstock costs, and moderate end-use activity.
The sodium silicate price index aggregates pricing data from major producing and consuming regions, reflecting changes in supply, demand, trade flows, and benchmark futures pricing.
Sodium silicate prices are primarily influenced by: (1) feedstock costs, mainly silica sand and soda ash, along with energy expenses required for high-temperature furnace operations; (2) supply and demand dynamics, including operating rates of key manufacturing plants and demand from detergent, construction, paper, and water treatment industries; (3) seasonal and regional factors, as construction activity cycles and shifts in regional freight rates impact trade flows; (4) economic factors, including energy price volatility, infrastructure spending trends, and geopolitical developments.
The sodium silicate price forecast suggests annual growth of approx. 3-4% through 2030 supported by demand growth from detergents, water treatment chemicals, and silica gel applications.
Sodium silicate price history data can be accessed through IMARC detailed quarterly and annual pricing reports, including regional benchmarks and historical trend analysis.
Need more help?
- Speak to our experienced analysts for insights on the current market scenarios.
- Include additional segments and countries to customize the report as per your requirement.
- Gain an unparalleled competitive advantage in your domain by understanding how to utilize the report and positively impacting your operations and revenue.
- For further assistance, please connect with our analysts.
 Request Customization
 Inquire Before Buying
 Speak to an Analyst
 Request Brochure
Benefits of Customization
- Personalize this research
- Triangulate with your data
- Get data as per your format and definition
- Gain a deeper dive into a specific application, geography, customer, or competitor
- Any level of personalization
Get in Touch With Us
UNITED STATES
Phone: +1-201-971-6302
INDIA
Phone: +91-120-433-0800
UNITED KINGDOM
Phone: +44-753-714-6104
Email: [email protected]
Client Testimonials


.webp)


Why Choose Us
IMARC offers trustworthy, data-centric insights into commodity pricing and evolving market trends, enabling businesses to make well-informed decisions in areas such as procurement, strategic planning, and investments. With in-depth knowledge spanning more than 1000 commodities and a vast global presence in over 150 countries, we provide tailored, actionable intelligence designed to meet the specific needs of diverse industries and markets.
1000
+Commodities
150
+Countries Covered
3000
+Clients
20
+Industry
Robust Methodologies & Extensive Resources
IMARC delivers precise commodity pricing insights using proven methodologies and a wealth of data to support strategic decision-making.
Subscription-Based Databases
Our extensive databases provide detailed commodity pricing, import-export trade statistics, and shipment-level tracking for comprehensive market analysis.
Primary Research-Driven Insights
Through direct supplier surveys and expert interviews, we gather real-time market data to enhance pricing accuracy and trend forecasting.
Extensive Secondary Research
We analyze industry reports, trade publications, and market studies to offer tailored intelligence and actionable commodity market insights.
Trusted by 3000+ industry leaders worldwide to drive data-backed decisions. From global manufacturers to government agencies, our clients rely on us for accurate pricing, deep market intelligence, and forward-looking insights.