
Solvent Market Size, Share, Trends and Forecast by Product, Source, Application, and Region, 2026-2034
Solvent Market Size and Share:
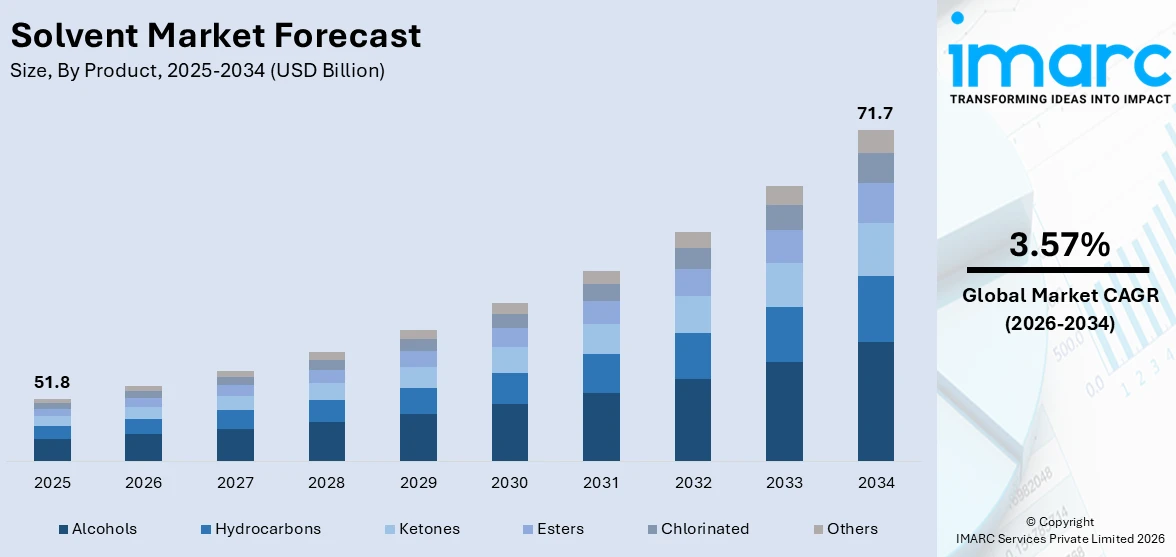
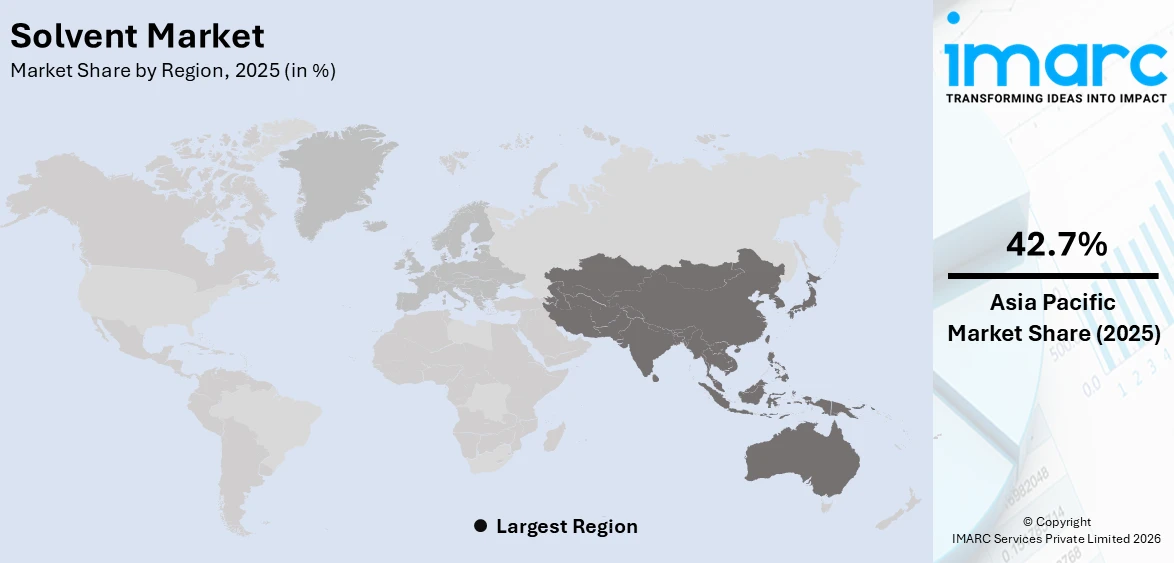
The global solvent market size was valued at USD 51.8 Billion in 2025. Looking forward, IMARC Group estimates the market to reach USD 71.7 Billion by 2034, exhibiting a CAGR of 3.57% from 2026-2034. Asia Pacific currently dominates the market, holding a market share of over 42.7% in 2025. The escalating demand for solvents from numerous industries, the widespread product utilization to produce cosmetics and personal care products, and advancements in manufacturing techniques across the globe are some of the major factors contributing to a positive solvent market outlook.
|
Report Attribute
|
Key Statistics |
|---|---|
|
Base Year
|
2025
|
|
Forecast Years
|
2026-2034
|
|
Historical Years
|
2020-2025
|
|
Market Size in 2025
|
USD 51.8 Billion |
|
Market Forecast in 2034
|
USD 71.7 Billion |
| Market Growth Rate (2026-2034) | 3.57% |
Solvents are influenced by the growth in the demand for various end-user industries like pharmaceuticals, paints and coatings, adhesives, and personal care. Growth in the construction and automotive segments drives the need for solvents in surface coatings and cleaning. Increasing adoption of eco-friendly and bio-based solvents is also driven by the push from environmental regulations and sustainability goals. For instance, Syensqo Ventures invested USD 2.1 Million in Bioeutectics on January 23, 2024. This company supports the innovation in its Natural Deep Eutectic Solvents technology, which is renewable and biodegradable solvents. Such technologies replace petrochemical alternatives with green solutions. Technological growth includes low-VOC and non-toxic alternatives and increasing industrial activities in emerging economies, leading to solvent market growth.
To get more information on this market Request Sample
The United States is a significant regional market, and is largely growing due to the continual advancements in end-use sectors like manufacturing in pharmaceuticals, automotive, and paints and coating. Notably, Dow announced on March 25, 2024, its intent to construct a carbonate solvents facility on the U.S. Gulf Coast for lithium-ion battery production, to support decarbonization and strengthen domestic supply chains for solvents and pharmaceuticals. Fast-growing drug formulation by pharmaceutical industries create a tremendous demand for high-purity solvents. Growing demand from the rising numbers of electric vehicles and advancing automotive technologies leads to more utilization of specialty solvents in the form of adhesives, lubricants, and manufacturing battery packs. More pressure to decrease VOCs gives impetus to more ecological, bio-based solvents, whereas newer innovations in recycling and solvent recovery augment this trend to strengthen the sustainability in growth market.
Solvent Market Trends:
Rapid technological advancements
Technological advancements are opening up valuable opportunities for growth in the solvent market. Both developed and developing regions benefit from a wealth of experience and expertise in this market. Advanced technologies and the application of new systems are catalyzing the demand for improved products. In particular, developing economies are characterizing this trend, where growth of the solvent market is distinctly more marked, attributed to the strong demand for high-quality products backed by modern technologies and implementation of innovative systems. As such, in 2023, a global cleantech company Clariter and TotalEnergies Fluids have introduced the world's first sustainable ultra-pure solvent derived from plastic waste. Clariter makes use of its proprietary innovative upcycling technology to convert plastic waste into sustainable, high-quality solvents, waxes, and oils. TotalEnergies Fluids then further converts the upcycled materials through its Hydro-De-Aromatization (HDA) technology into very high purity solvents that meet the quality levels required for the most stringent applications.
Increasing demand for eco-friendly solvents
There is a growing demand for eco-friendly solvent products with little environmental effect. These dissolving agents are intended to be lesser hazardous and produce lesser emissions. Industries that previously relied on harsh chemicals are now looking for alternatives that provide the same efficacy without jeopardizing health or the environment. Bio-based dissolving agents made from renewable resources such as sugarcane, maize, or cellulose are gaining popularity. They have a lower carbon footprint and are becoming more cost-effective as manufacturing techniques advance. The aim is to develop bio-solvents that can match or outperform conventional ones in a variety of industrial applications, which can augment the solvent market revenue. For instance, in 2022, Solvay announced the production of the new generation solvent Rhodiasolv® IRIS, with excellent eco-friendly properties.
Rising product demand in the paints and coatings industry
Solvent is a popular choice in the paints and coatings industry due to its temperature resistance, durability, and low cost. The substance is widely used in paints to prevent clumps or globs and offer the desired consistency in a variety of applications. In addition to this, increased demand for paints due to rapid growth in the building industry and soaring infrastructure development in nations such as China, India, and the United States is expected to propel solvent adoption. According to India Brand Equity Foundation (IBEF), in 2023, Akzo Nobel stated in its annual report that the paints and coatings industry is currently valued at about USD 7.57 Billion. All this is anticipated to increase the demand for solvents from the paints and coatings sector, thereby helping expand the market further.
Solvent Industry Segmentation:
IMARC Group provides an analysis of the key trends in each segment of the global solvent market, along with forecast at the global, regional, and country levels from 2026-2034. The market has been categorized based on product, source, and application.

Analysis by Product:
- Alcohols
- Hydrocarbons
- Ketones
- Esters
- Chlorinated
- Others
Alcohols stand as the largest component in 2025, holding around 30.2% of the market. Alcohol is predicted to continue to dominate the global market and offer numerous solvent market recent opportunities. They are more polar than hydrocarbons or ketones, which accounts for their growth. Growth is also driven by rising demand for ethanol, methanol, n-butanol, and isopropanol for a variety of uses. Ethanol is widely used as a solvent since it is safe to use and can dissolve many organic compounds that are not soluble in water, making it a popular ingredient in cosmetics and perfumes. It is also used in perfumes, vegetable essences, and pharmaceuticals, while methanol is widely used in inks and adhesives. As a result, increased acceptance of these products will bolster the solvent market overview.
Analysis by Source:
- Petrochemical-based
- Bio and Green
According to the report, petrochemical-based accounted for the largest market share, and is expected to maintain its dominance in the anticipated period in the market report. The majority of solvents are derived from synthetic chemicals and petroleum. These derived sources are properly prepared to broaden solvent applications into newer sectors. Hydrocarbon fractions generated from petroleum are employed in industrial and commercial formulations to suspend, dissolve, or transport other components. The expansion of refinery operations aimed primarily at converting low-octane feedstocks to high-octane fuels, as well as environmental constraints and concerns, is leading to a considerable increase in the diversity of petroleum solvents in recent years. This, in turn, is contributing to many solvent market recent developments.
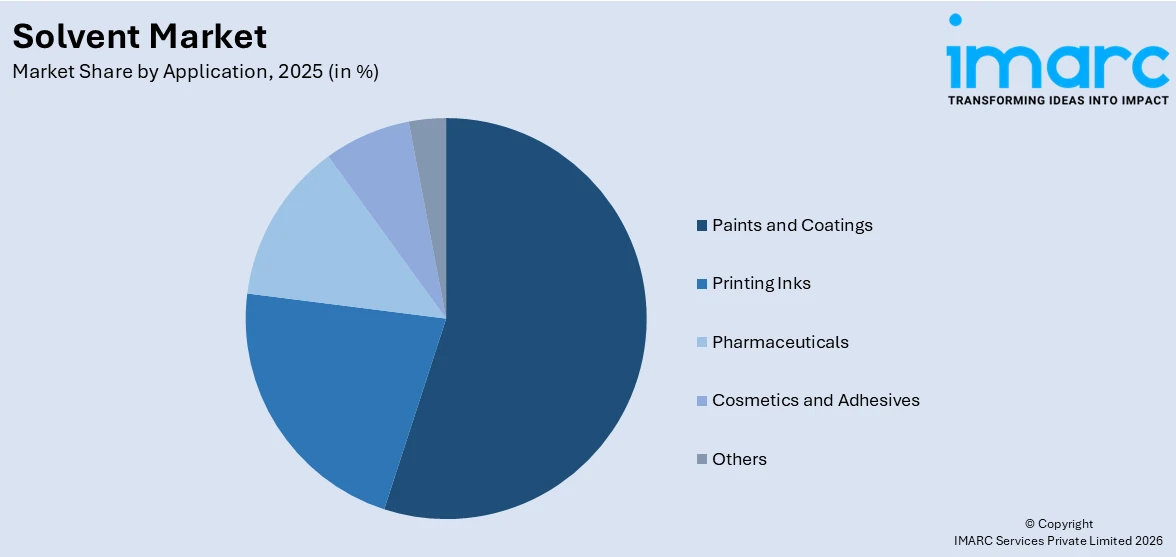
Analysis by Application:
Access the comprehensive market breakdown Request Sample
- Paints and Coatings
- Printing Inks
- Pharmaceuticals
- Cosmetics and Adhesives
- Others
Paints and coatings lead the market with around 55.8% of market share in 2025. This is due to its widespread use in the construction industry. The rapid rise, combined with advances in paint technology rendering them more sustainable, is driving the growth of this application segment. Construction activity is increasing in economies such as the United States, India, China, and Brazil, thereby propelling market growth. The rising construction industry is driving the demand for paints and coatings, a key solvent application market. This product is a top choice in the paints and coatings industry due to its temperature resistance, durability, and cost.
Regional Analysis:
To get more information on the regional analysis of this market Request Sample
- North America
- United States
- Canada
- Asia Pacific
- China
- Japan
- India
- South Korea
- Australia
- Indonesia
- Others
- Europe
- Germany
- France
- United Kingdom
- Italy
- Spain
- Russia
- Others
- Latin America
- Brazil
- Mexico
- Others
- Middle East and Africa
In 2025, Asia-Pacific accounted for the largest market share of over 42.7%. This is mainly due to the increasing solvent demand in the home care, personal care, and cosmetic industries in the region. Urbanization and changed lifestyles are two major factors driving demand for solvents across the region. Market growth in the region will be supported by increasing construction investment in countries like China and India, as well as increased industrialization. The sectors of emerging countries, such as paints, coatings, and adhesives are expanding, and this is expected to augment product demand in the future.
Key Regional Takeaways:
United States Solvent Market Analysis
Advances in key industries like automobile, construction, and pharmaceuticals in the United States have been driving demands in the usage of solvents as specialized application substances. The use of solvents in the production of coatings and adhesives is also seeing major development in the automobile industries that are continuously pursuing new applications for lightweight and electrical vehicles. At the same time, the construction industry is using solvents in paints, coatings, and sealants to meet the growing demand for residential and commercial buildings due to urbanization and remodeling trends. According to CIA, in 2023, 83.3% of the total population in the United States comprises urban population. The pharmaceutical industry is using solvents in drug formulations and production processes to improve efficacy and solubility, driven by the increasing focus on innovative therapies. Green and bio-based solvents are also becoming increasingly popular as manufacturers seek to render their products more sustainable in response to stricter environmental regulations and consumer demand for eco-friendly products. The food and beverage industry are also actively employing solvents in flavour and fragrance extraction in line with the increasing demand for processed and packaged foods. Furthermore, technological innovations in solvent recycling and recovery are meeting the cost-effectiveness requirements and waste minimization, thus promoting the adoption of the product. These sector-specific applications and regulatory changes are collectively molding the solvent market in the United States to ensure its dynamic growth.
Europe Solvent Market Analysis
The European solvent market is currently experiencing growth, driven by several specific factors unique to the region. Manufacturers are increasingly focusing on bio-based and green solvents as industries prioritize sustainability to meet stringent environmental regulations. The demand for solvents in the automotive sector is expanding due to their use in advanced coatings and adhesives that enhance vehicle performance and aesthetics. Additionally, pharmaceutical companies are actively utilizing high-purity solvents in drug formulation and production to cater to the growing healthcare needs across Europe. The paints and coatings industry are leveraging solvents for innovations in waterborne and solvent-borne formulations, increased by ongoing construction and infrastructure development projects. In the personal care sector, the use of solvents in formulations for skincare and cosmetics is witnessing a steady rise, driven by consumer preferences for premium and functional products. According to the CBI, in 2020, the European market for natural and organic cosmetics was valued at USD 4.106 Billion, up from USD 3.85 Billion in 2018. Moreover, industries are increasingly adopting specialty solvents for industrial cleaning applications, as efficiency and precision become critical in maintaining equipment and operational standards. These trends are further complemented by advancements in solvent recycling technologies, enabling companies to reduce waste and lower costs while complying with regulatory norms. The market is also seeing increased collaboration between chemical manufacturers and end-use industries to develop tailored solvent solutions addressing specific application needs.
Asia Pacific Solvent Market Analysis
The Asia-Pacific solvents market is currently witnessing robust growth driven by multiple shifting factors specific to the region. Increasing urbanization and infrastructure development are expanding the demand for paints and coatings, which is fuelling the usage of solvents in their formulation. According to UN Habitat, the average urbanization rate of China reached 59.6% in 2018, with Zhejiang Province passing 68% and Guizhou Province 46%. Manufacturers are actively developing eco-friendly and bio-based solvents to comply with stringent environmental regulations and address rising consumer awareness about sustainability. In the pharmaceutical sector, companies are ramping up production of drugs and medicines, leading to a growth in the consumption of solvents for synthesis and formulation processes. Additionally, the region's rapidly growing automotive industry is amplifying the demand for solvents used in cleaning, degreasing, and automotive coating applications. The packaging industry is embracing solvent-based adhesives and printing inks, as it adapts to the rising demand for flexible and sustainable packaging solutions. Producers of personal care and cosmetics are increasingly incorporating solvents for formulating innovative and high-performance products, catering to shifting consumer preferences. Furthermore, the increasing investments in the chemical sector, particularly in China and India, are contributing to heightened production and consumption of solvents in industrial applications. Collectively, these factors are shaping a dynamic market landscape, encouraging innovations and expansions across the Asia-Pacific solvents industry.
Latin America Solvent Market Analysis
The Latin American solvent market is currently experiencing growth, driven by several region-specific factors. Industries such as automotive, construction, and paints and coatings are actively expanding, fuelling demand for solvents in surface coatings and adhesives. The pharmaceutical sector is increasingly relying on high-quality solvents for drug formulation, particularly with a rise in healthcare infrastructure investments across countries like Brazil and Mexico. Meanwhile, the agrochemical industry is leveraging solvents for pesticide and herbicide formulations to support the growing agricultural sector. Regulatory bodies are promoting the adoption of eco-friendly solvents, encouraging manufacturers to innovate and supply green alternatives. Solvent use in personal care and cosmetics is also gaining traction as consumer preferences shift toward sophisticated and natural product formulations. According to International Trade Administration, the Mexican consumer spends on average close to USD 90 annually in cosmetics and personal care products. Additionally, industrial cleaning applications are steadily expanding, especially in the manufacturing and oil and gas sectors, where solvents are crucial for maintenance and operations. The region is also witnessing an uptrend in exports of solvent-based products, further enhancing demand. Lastly, the increasing penetration of multinational companies in Latin America is supporting advancements in solvent technology and distribution networks, enabling better access for end-users. This dynamic environment is continuously shaping the solvent market, with industries adapting to changing demands and regulatory landscapes.
Middle East and Africa Solvent Market Analysis
The solvent market in the Middle East and Africa is experiencing growth as industries across the region are continuously adopting advanced production processes that demand specialized chemical solutions. In the construction sector, solvents are being increasingly utilized in the formulation of paints, coatings, and adhesives, driven by the ongoing development of large-scale infrastructure projects, urbanization efforts, and rising housing demand. According to the UN Habitat, the Republic of South Africa is one of the most urbanized countries in Africa with around 67% of its population living in urban areas. In the oil and gas sector, companies are actively employing solvents in enhanced oil recovery processes and cleaning operations, especially as they are seeking to maximize output from existing fields. Simultaneously, the automotive and aerospace industries are witnessing an expanding use of solvents for surface treatments and maintenance, as regional manufacturers focus on improving efficiency and durability of materials. Additionally, the pharmaceutical sector is growing steadily, with solvents playing a crucial role in drug formulation and production as governments are strengthening healthcare infrastructure. Rising environmental regulations are also encouraging industries to switch to eco-friendly solvents, leading to heightened innovation and demand for bio-based and green alternatives. This shift is further being supported by international collaborations and the influx of advanced manufacturing technologies into the region, facilitating the adoption of high-performance solvents tailored to specific industrial applications.
Competitive Landscape:
The global solvent market is highly competitive, with major solvent companies focusing on capacity expansion, product innovation, acquisitions, mergers, and partnerships on a global scale. In 2019, for example, BASF SE increased the capacity of its integrated ethylene oxide and derivatives complex at its Verbund plant in Antwerp. The corporation specializes in the production and distribution of chemicals. Its operations span 80 countries in North America, Europe, Asia Pacific, the Middle East, and Africa. Some of the key players are also focusing on developing sustainable products. For instance, Solvay launched a new Renewable Materials and Biotechnology platform in 2022, with the goal of producing innovative and sustainable solutions for a variety of markets via the use of renewable feedstock and biotechnology.
The report provides a comprehensive analysis of the competitive landscape in the solvent market with detailed profiles of all major companies, including:
- Ashland Inc.
- BASF SE
- Bharat Petroleum Corporation Limited
- BP p.l.c.
- Celanese Corporation
- Dow Inc.
- Eastman Chemical Company
- Exxon Mobil Corporation
- Huntsman International LLC
- LyondellBasell Industries Holdings B.V.
- Mitsubishi Chemical Group Corporation
- Sasol Limited
- Shell plc
- Solvay S.A.
Latest News and Developments:
- July 2018: BASF SE increased the capacity of its integrated ethylene oxide and derivatives complex at its Verbund plant in Antwerp. The corporation specializes in the production and distribution of chemicals. Its operation spans 80 countries in North America, Europe, Asia-Pacific, and the Middle East and Africa.
- October 2021: Ashland Inc. launched Sensidin Pure Skin Multifunctional. It preserves the unique microbiome while offering strong and quick performance against odor-causing bacteria at extremely low usage amounts.
- May 2022: Solvay launched a new Renewable Materials and Biotechnology platform, dedicated to developing innovative and sustainable solutions for a range of markets, using renewable feedstocks and biotechnology. Moreover, the company is already a market leader in some bio-based products, including guar, bio-sourced solvents and natural vanillin, the latter of which is enabled by biotechnology.
- February 2023: BASF SE announced that it has entered into a long-term collaboration agreement with Tenova Advanced Technologies (TAT) of Yokneam, Israel, for its battery recycling prototype plant in Schwarzheide, Germany.
- March 2023: Archer-Daniels-Midland Company announced the launch of the Knwble Grwn™ brand to provide consumers wholesome, plant-based food ingredients that are sustainably sourced. Knwble Grwn products are produced by small or underrepresented farmers using regenerative agricultural practices that help to protect the environment.
Solvent Market Report Scope:
| Report Features | Details |
|---|---|
| Base Year of the Analysis | 2025 |
| Historical Period | 2020-2025 |
| Forecast Period | 2026-2034 |
| Units | Billion USD |
| Scope of the Report | Exploration of Historical Trends and Market Outlook, Industry Catalysts and Challenges, Segment-Wise Historical and Future Market Assessment:
|
| Products Covered | Alcohols, Hydrocarbons, Ketones, Esters, Chlorinated, Others |
| Sources Covered | Petrochemical-Based, Bio and Green |
| Applications Covered | Paints And Coatings, Printing Inks, Pharmaceuticals, Cosmetics and Adhesives, Others |
| Regions Covered | Asia Pacific, Europe, North America, Latin America, Middle East and Africa |
| Countries Covered | United States, Canada, Germany, France, United Kingdom, Italy, Spain, Russia, China, Japan, India, South Korea, Australia, Indonesia, Brazil, Mexico |
| Companies Covered | Ashland Inc., BASF SE, Bharat Petroleum Corporation Limited, BP p.l.c., Celanese Corporation, Dow Inc., Eastman Chemical Company, Exxon Mobil Corporation, Huntsman International LLC, LyondellBasell Industries Holdings B.V., Mitsubishi Chemical Group Corporation, Sasol Limited, Shell plc, Solvay S.A., etc. |
| Customization Scope | 10% Free Customization |
| Post-Sale Analyst Support | 10-12 Weeks |
| Delivery Format | PDF and Excel through Email (We can also provide the editable version of the report in PPT/Word format on special request) |
Key Benefits for Stakeholders:
- IMARC’s report offers a comprehensive quantitative analysis of various market segments, historical and current market trends, market forecasts, and dynamics of the solvent market from 2020-2034.
- The research study provides the latest information on the market drivers, challenges, and opportunities in the global solvent market.
- The study maps the leading, as well as the fastest-growing, regional markets. It further enables stakeholders to identify the key country-level markets within each region.
- Porter's Five Forces analysis assists stakeholders in assessing the impact of new entrants, competitive rivalry, supplier power, buyer power, and the threat of substitution. It helps stakeholders to analyze the level of competition within the solvent industry and its attractiveness.
- Competitive landscape allows stakeholders to understand their competitive environment and provides an insight into the current positions of key players in the market.
Frequently Asked Questions About the Solvent Market Report
A solvent is a substance, typically a liquid, capable of dissolving other substances (solutes) to form a solution. Solvents are widely used in industries, laboratories, and everyday applications for processes like cleaning, chemical synthesis, and extraction. Common examples include water, alcohol, acetone, and hydrocarbons like benzene or toluene.
The solvent market was valued at USD 51.8 Billion in 2025.
IMARC estimates the global solvent market to exhibit a CAGR of 3.57% during 2026-2034.
The market is primarily driven by escalating demand across pharmaceuticals, paints and coatings, adhesives, and personal care industries. Growth in construction, automotive, and eco-friendly solvent adoption, coupled with advancements in manufacturing techniques and rising industrial activities in emerging economies, also fuels market expansion.
In 2025, alcohols represented the largest segment by product, driven by heir versatility in dissolving organic compounds and diverse industrial applications.
Petrochemical-based solvents leads the market by source attributed to their wide availability and suitability for various industrial applications.
The paints and coatings industry are the leading segment by application, driven by its extensive use in construction and infrastructure projects worldwide.
On a regional level, the market has been classified into North America, Asia Pacific, Europe, Latin America, and Middle East and Africa, wherein Asia Pacific currently dominates the global market.
Some of the major players in the global solvent market include Ashland Inc., BASF SE, Bharat Petroleum Corporation Limited, BP p.l.c., Celanese Corporation, Dow Inc., Eastman Chemical Company, Exxon Mobil Corporation, Huntsman International LLC, LyondellBasell Industries Holdings B.V., Mitsubishi Chemical Group Corporation, Sasol Limited, Shell plc, and Solvay S.A., among others.
Need more help?
- Speak to our experienced analysts for insights on the current market scenarios.
- Include additional segments and countries to customize the report as per your requirement.
- Gain an unparalleled competitive advantage in your domain by understanding how to utilize the report and positively impacting your operations and revenue.
- For further assistance, please connect with our analysts.
 Request Customization
 Speak to an Analyst
 Request Brochure
 Inquire Before Buying
Benefits of Customization
- Personalize this research
- Triangulate with your data
- Get data as per your format and definition
- Gain a deeper dive into a specific application, geography, customer, or competitor
- Any level of personalization
Get in Touch With Us
UNITED STATES
Phone: +1-201-971-6302
INDIA
Phone: +91-120-433-0800
UNITED KINGDOM
Phone: +44-753-714-6104
Email: [email protected]
Client Testimonials


.webp)


