
Specialty Gases Market Size, Share, Trends and Forecast by Type, Element, Application, Packaging Type, Sales Type, and Region, 2026-2034
Specialty Gases Market Size and Share:
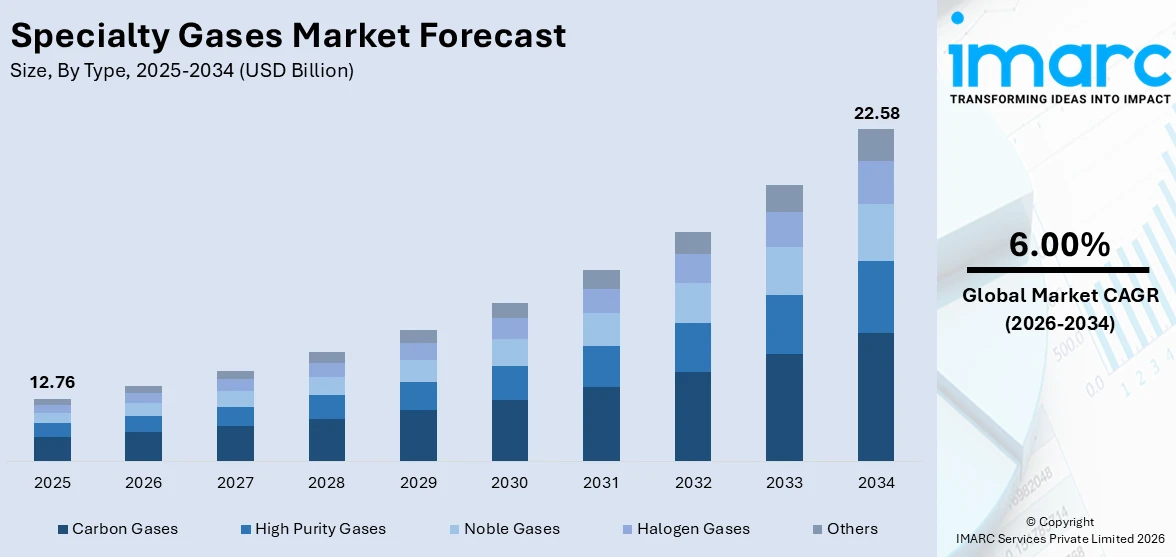
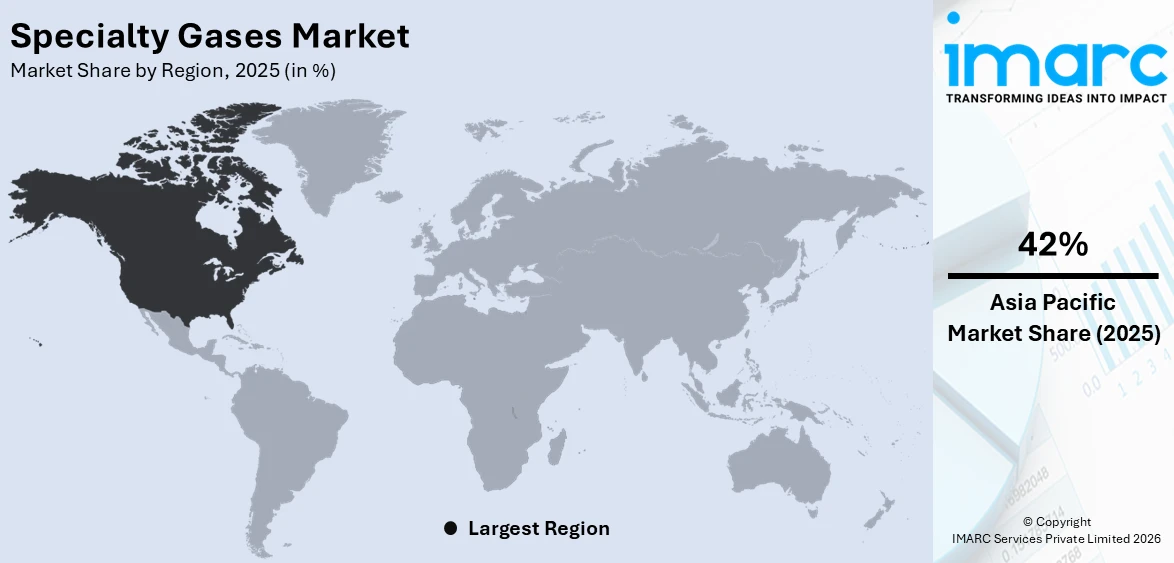
The global specialty gases market size was valued at USD 12.76 Billion in 2025. Looking forward, IMARC Group estimates the market to reach USD 22.58 Billion by 2034, exhibiting a CAGR of 6.00% from 2026-2034. Asia Pacific currently dominates the market, holding a market share of 42% in 2025. The region benefits from rapid industrialization across key economies, expanding semiconductor fabrication capabilities, rising healthcare infrastructure investments, and growing demand for high purity gases in electronics manufacturing, all contributing to the specialty gases market share.
The rising demand for specialty gases across diverse industrial applications is a primary factor propelling the market forward. The expanding electronics and semiconductor industry, which requires ultra-high purity gases for wafer fabrication, etching, and deposition processes, is significantly boosting consumption levels globally. The increasing emphasis on environmental monitoring and emission control is further accelerating the adoption of calibration gas mixtures and reference standards. The expanding research and development activities in academic institutions and industrial laboratories worldwide, combined with the ongoing shift toward cleaner energy solutions and hydrogen-based technologies, are positively influencing the specialty gases market growth across multiple end-use sectors.
The United States has emerged as a major region in the specialty gases market owing to many factors. The country maintains a robust semiconductor manufacturing base that relies heavily on ultra-high purity process gases for advanced chip fabrication. In June 2024, Air Liquide announced an investment of over 250 million dollars to build a new industrial gas production facility in Idaho to supply ultra-pure nitrogen and other gases to Micron’s semiconductor manufacturing operations in the United States. The well-established healthcare system supports consistent demand for medical-grade gases used in respiratory therapy, anesthesia, and diagnostic imaging applications. The presence of leading research universities and national laboratories drives the consumption of analytical and calibration gas standards.
To get more information on this market Request Sample
Specialty Gases Market Trends:
Growing Semiconductor Industry Demand
The expanding semiconductor industry is creating substantial demand for specialty gases, serving as a key driver of the market expansion. Ultra-high purity gases, including nitrogen trifluoride, silane, and various fluorinated compounds, are essential in semiconductor fabrication processes such as chemical vapor deposition, plasma etching, and chamber cleaning. In March 2024, the U.S. government announced up to $8.5 billion in funding for Intel under the CHIPS and Science Act to expand semiconductor manufacturing facilities in Arizona, Ohio, New Mexico, and Oregon, strengthening domestic chip production capacity. As chip manufacturers transition to smaller node sizes and more complex architectures, the purity requirements for process gases continue to intensify, necessitating advanced purification and delivery systems. The proliferation of artificial intelligence, Internet of Things (IoT) devices, and autonomous vehicles is further accelerating semiconductor production volumes globally.
Rising Healthcare Sector Applications
The healthcare sector is witnessing increasing adoption of specialty gases across therapeutic, diagnostic, and analytical applications, contributing to the specialty gases market outlook. Medical-grade gases, including nitrous oxide, carbon dioxide, helium, and various gas mixtures, play critical roles in anesthesia delivery, respiratory support, cryotherapy, and minimally invasive surgical procedures. In October 2024, Linde India commissioned a new air separation unit in Ludhiana to increase supplies of medical oxygen and other gases for hospitals and healthcare facilities across northern India. The growing prevalence of chronic respiratory diseases and the expanding elderly population are driving higher consumption of medical oxygen and therapeutic gas blends in both hospital and homecare settings.
Advancing Environmental Monitoring Standards
The tightening of environmental regulations and emission monitoring standards globally is driving increased consumption of calibration and reference specialty gases, positively influencing the specialty gases market forecast. Governments and regulatory agencies across multiple regions are implementing stricter air quality monitoring requirements and industrial emission limits, which necessitate the use of certified reference gas mixtures for instrument calibration and compliance verification. In February 2024, the United States Environmental Protection Agency funded community air-quality monitoring projects in New York as part of a nationwide initiative supporting 132 monitoring projects aimed at improving pollution measurement and environmental data collection. The growing emphasis on greenhouse gas monitoring and carbon accounting is further expanding the range of specialty gas standards required by environmental testing laboratories.
Specialty Gases Industry Segmentation:
IMARC Group provides an analysis of the key trends in each segment of the global specialty gases market, along with forecast at the global, regional, and country levels from 2026-2034. The market has been categorized based on type, element, application, packaging type, and sales type.
Analysis by Type:
- High Purity Gases
- Noble Gases
- Carbon Gases
- Halogen Gases
- Others
Carbon gases hold 35% of the market share, encompassing carbon dioxide, carbon monoxide, and various carbon-based compounds, are extensively utilized across industrial manufacturing, food and beverage processing, healthcare, and chemical synthesis applications. The widespread use of carbon dioxide in welding, fire suppression, and carbonated beverage production supports consistent demand across multiple sectors. As per sources, Linde plc began supplying captured carbon dioxide from its Clear Lake facility in Texas to Celanese for use as a feedstock in lower-carbon methanol production. Carbon monoxide serves as a critical feedstock in chemical manufacturing processes, including the production of acetic acid, phosgene, and various organic intermediates. The growing demand for specialty carbon gas blends in environmental monitoring and analytical testing further reinforces segment dominance. Additionally, the expanding use of high purity carbon dioxide in enhanced oil recovery operations and supercritical extraction processes is creating new demand avenues.

Analysis by Element:
- Argon
- Nitrogen
- Helium
- Carbon Monoxide
- Methane
- Oxygen
- Hydrogen
- Others
Carbon monoxide leads the market with a share of 22%, being a vital industrial gas utilized primarily as a chemical intermediate in the production of various organic compounds, including methanol, acetic acid, and phosgene. Its role as a reducing agent in metallurgical processes, particularly in iron and steel manufacturing, supports substantial industrial consumption. In July 2025, Air Liquide announced plans to invest up to $200 million in Louisiana to modernize gas production infrastructure and expand pipeline networks supporting long-term industrial gas supply agreements with major chemical manufacturers. The growing application of carbon monoxide in fischer-tropsch synthesis for producing synthetic fuels and hydrocarbons is expanding its industrial relevance. Additionally, high purity carbon monoxide finds increasing use in pharmaceutical manufacturing and specialty chemical production, where precise gas specifications are required for reaction control and product quality. The expanding chemical manufacturing sector globally, combined with technological advancements in gas purification and delivery systems, is driving consistent demand for specialty-grade carbon monoxide across diverse industrial and research applications worldwide.
Analysis by Application:
Access the comprehensive market breakdown Request Sample
- Manufacturing
- Electronics
- Healthcare
- Academics
- Others
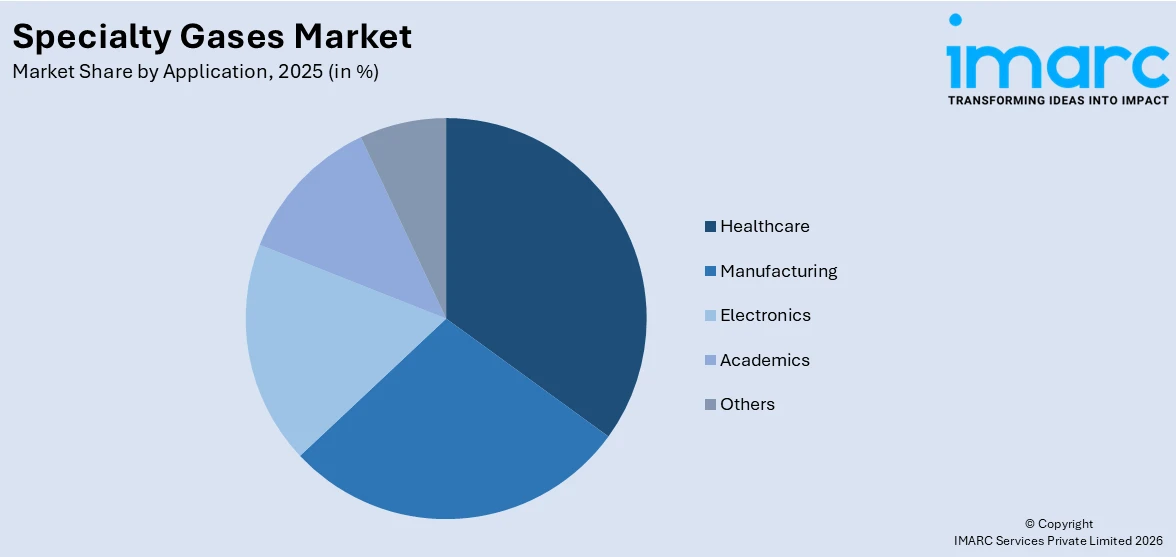
Healthcare dominates the market, with a share of 28%, representing a significant consumer of specialty gases, driven by the essential role these gases play in patient care, diagnostics, and medical research. Medical-grade oxygen remains the most widely consumed specialty gas in healthcare settings, supporting respiratory therapy, surgical anesthesia, and emergency medical services. Nitrous oxide and various anesthetic gas mixtures are indispensable in surgical and dental procedures, while helium supports magnetic resonance imaging equipment operations. The growing prevalence of respiratory conditions, cardiovascular diseases, and the aging global population are driving increased consumption of therapeutic and diagnostic specialty gases. Furthermore, the expanding use of specialty gases in pharmaceutical manufacturing, bioanalytical testing, and clinical laboratory applications is broadening the healthcare segments addressable market, reinforcing the positive specialty gases market trends observed across the global healthcare infrastructure.
Analysis by Packaging Type:
- Packaged
- Bulk and On-site
Bulk and on-site represents the leading segment, with a market share of 52%, being preferred by large-scale industrial consumers who require continuous and high-volume gas supply for their manufacturing, processing, and operational needs. On-site gas generation systems, including cryogenic air separation units and pressure swing adsorption plants, provide reliable and cost-effective gas supply directly at the point of consumption. According to reports, Air Products announced it would build two world-scale carbon monoxide production facilities in Texas connected to its Gulf Coast pipeline network to support long-term supply agreements with major chemical manufacturers. Bulk delivery through tanker trucks and tube trailers serves facilities with substantial but intermittent gas requirements, offering economies of scale compared to packaged cylinder options. The expanding semiconductor fabrication, petrochemical, and steel manufacturing industries drive consistent demand for bulk supply arrangements.
Analysis by Sales Type:
- Merchant
- Captive
Captive holds 55% of the market share, involving the on-site generation of specialty gases by the consuming organization itself, typically through dedicated air separation units, electrolysis systems, or chemical synthesis facilities integrated within the production complex. This model is predominantly adopted by large-scale industrial consumers in the petrochemical, steel, and electronics manufacturing sectors, where continuous and high-volume gas supply is critical to operational processes. Captive production offers significant advantages in terms of supply security, cost predictability, and the ability to customize gas specifications to precise process requirements. The growing capital investments in semiconductor fabrication facilities and large-scale chemical plants are expanding the captive production base. Furthermore, vertically integrated manufacturers increasingly prefer captive arrangements to maintain quality control over gas purity levels and to minimize dependence on external supply chains.
Regional Analysis:
To get more information on the regional analysis of this market Request Sample
- North America
- United States
- Canada
- Asia Pacific
- China
- Japan
- India
- South Korea
- Australia
- Indonesia
- Others
- Europe
- Germany
- France
- United Kingdom
- Italy
- Spain
- Russia
- Others
- Latin America
- Brazil
- Mexico
- Others
- Middle East and Africa
Asia Pacific, accounting for 42% of the share, maintaining the leading position in the market. The region benefits from the rapid expansion of semiconductor manufacturing facilities, particularly in countries with established electronics industries, which drives substantial demand for ultra-high purity process gases. The growing industrialization across developing economies is fueling increased consumption of specialty gases in manufacturing, welding, and chemical processing applications. The healthcare sector expansion, supported by rising population and improving medical infrastructure, is generating sustained demand for medical-grade specialty gases. Additionally, the increasing investments in research and development across academic institutions and corporate laboratories are broadening the consumption base for analytical and calibration gas standards. The regions strong chemical manufacturing base, combined with favorable government policies supporting industrial growth and domestic production capabilities, positions Asia Pacific as the dominant consumer of specialty gases globally.
Key Regional Takeaways:
North America Specialty Gases Market Analysis
North America represents a significant market for specialty gases, supported by the regions advanced industrial infrastructure, well-established semiconductor manufacturing base, and robust healthcare system. The presence of leading technology companies, pharmaceutical manufacturers, and research institutions drives consistent demand for ultra-high purity and analytical-grade specialty gases. The growing investments in renewable energy technologies and hydrogen fuel cell development are creating additional demand avenues for specialty hydrogen and associated gas products. Environmental regulations, including stringent air quality monitoring and emission reporting requirements, sustain ongoing consumption of certified reference gas mixtures across industrial and governmental sectors. The expanding aerospace and defense industries require specialty gas mixtures for testing, qualification, and propulsion system applications. Furthermore, the increasing adoption of advanced manufacturing technologies, including laser processing and additive manufacturing, is generating incremental demand for precision specialty gas blends. The regions mature distribution infrastructure and established supply chain networks support efficient delivery of specialty gases across diverse end-use applications.
United States Specialty Gases Market Analysis
The United States maintains a dominant position within the North American specialty gases market, driven by its advanced manufacturing sector, extensive healthcare network, and leading research capabilities. The countrys semiconductor industry, which is undergoing significant expansion through government-supported initiatives, is generating substantial demand for process-grade specialty gases used in wafer fabrication and chip packaging operations. The well-established healthcare infrastructure supports consistent consumption of medical-grade oxygen, anesthetic gases, and diagnostic gas mixtures across hospital and outpatient care settings. The thriving pharmaceutical and biotechnology industries require specialty gases for drug development, quality control testing, and production processes. The environmental services sector maintains steady demand for calibration and reference gas standards to support regulatory compliance and air quality monitoring programs. Additionally, the expanding clean energy sector, including hydrogen production and fuel cell technology development, is creating new growth avenues for specialty gas suppliers operating within the country.
Europe Specialty Gases Market Analysis
Europe represents a mature and technologically advanced market for specialty gases, driven by the regions strong automotive manufacturing sector, well-developed healthcare systems, and extensive research infrastructure. The presence of leading chemical and pharmaceutical companies across the region sustains consistent demand for high purity and analytical-grade specialty gases. According to reports, the European Commission approved the “IPCEI Hy2Infra” initiative, allowing up to €6.9 billion in public funding from seven EU countries to develop hydrogen infrastructure, including electrolysers, pipelines, and storage facilities across Europe. The semiconductor industry, although smaller than in other regions, maintains steady requirements for process gases used in chip fabrication and photovoltaic cell manufacturing. Environmental regulations within the European Union, including comprehensive emission monitoring directives and air quality standards, drive ongoing consumption of certified calibration gas mixtures. The growing focus on green hydrogen production and carbon capture technologies is expanding the addressable market for specialty hydrogen and carbon dioxide products. Additionally, the regions strong academic and research sector, encompassing numerous universities and public research institutions, supports sustained demand for analytical and reference gas standards across scientific disciplines.
Asia Pacific Specialty Gases Market Analysis
Asia Pacific dominates the global specialty gases market, supported by the regions rapidly expanding semiconductor manufacturing capacity, growing industrial base, and increasing healthcare investments. The proliferation of electronics fabrication facilities, particularly in countries with established technology ecosystems, drives substantial demand for ultra-high purity process gases. The expanding chemical manufacturing and steel production industries consume significant volumes of specialty gases for processing, welding, and quality control applications. The healthcare sector growth, underpinned by rising populations and improving medical infrastructure, is generating increased demand for medical-grade specialty gases. Additionally, government initiatives supporting industrial modernization, clean energy development, and environmental monitoring are broadening the consumption base for diverse specialty gas products across the region.
Latin America Specialty Gases Market Analysis
Latin America presents a growing market for specialty gases, driven by the regions expanding industrial base, developing healthcare sector, and increasing investments in manufacturing infrastructure. The oil and gas industry represents a significant demand center, requiring specialty gases for refining processes, analytical testing, and safety monitoring. The growing food and beverage processing sector utilizes specialty gases for modified atmosphere packaging and carbonation applications. The healthcare infrastructure expansion across the region is supporting increased consumption of medical-grade specialty gases for therapeutic and diagnostic purposes.
Middle East and Africa Specialty Gases Market Analysis
The Middle East and Africa region represents an emerging market for specialty gases, supported by the ongoing diversification of economies beyond hydrocarbon dependence and growing industrial development. The expanding petrochemical and refining industries across the region drive demand for process and analytical specialty gases. Healthcare sector investments, including the construction of new hospital facilities and medical centers, are generating increased demand for medical-grade specialty gases. The growing emphasis on environmental monitoring and industrial safety standards further supports the adoption of calibration and reference gas products.
Competitive Landscape:
The competitive landscape of the specialty gases market is characterized by the presence of several established multinational corporations and regional players that compete on the basis of product purity, supply reliability, geographic coverage, and technical service capabilities. Leading market participants maintain extensive distribution networks, including on-site generation facilities, bulk supply infrastructure, and packaged gas operations, to serve diverse end-use sectors. Strategic initiatives such as capacity expansions, technology partnerships, and long-term supply agreements with semiconductor and healthcare customers are common competitive strategies. Companies are also investing in advanced purification technologies, digital supply chain management solutions, and sustainable production methods to differentiate their offerings and strengthen customer relationships across key industrial segments.
The report provides a comprehensive analysis of the competitive landscape in the specialty gases market with detailed profiles of all major companies, including:
- Advanced Gas Technologies Inc.
- Advanced Specialty Gases Inc.
- Air Products and Chemicals Inc.
- Airgas Inc.
- DuPont de Nemours Inc.
- Honeywell International Inc.
- Kanto Denka Kogyo Co. Ltd.
- Messer Group
- Mitsui Chemicals
- Norco
- Nova Gas Technologies Inc.
- Praxair
- Showa Denko K.K.
- Taiyo Nippon Sanso Corporation
- The Linde Group
- Welsco Inc.
Latest News and Developments:
- In October 2025, INOX Air Products began building a Rs 500 crore electronic specialty gas hub in Dholera, Gujarat. The facility will produce ultra-high-purity gases such as nitrogen, oxygen, argon, and hydrogen to support India’s growing semiconductor manufacturing ecosystem and reduce dependence on imported specialty gases.
- In July 2025, Linde plc announced major U.S. investments to support the commercial space industry. The company will expand its industrial gas facility in Mims, Florida, and build a new air separation unit in Brownsville, Texas to supply liquid oxygen, nitrogen, and argon for rocket launches and operations.
Specialty Gases Market Report Scope:
| Report Features | Details |
|---|---|
| Base Year of the Analysis | 2025 |
| Historical Period | 2020-2025 |
| Forecast Period | 2026-2034 |
| Units | Billion USD |
| Scope of the Report | Exploration of Historical and Forecast Trends, Industry Catalysts and Challenges, Segment-Wise Historical and Predictive Market Assessment:
|
| Types Covered | High Purity Gases, Noble Gases, Carbon Gases, Halogen Gases, Others |
| Elements Covered | Argon, Nitrogen, Helium, Carbon Monoxide, Methane, Oxygen, Hydrogen, Others |
| Applications Covered | Manufacturing, Electronics, Healthcare, Academics, Others |
| Packaging Types Covered | Packaged, Bulk and on-site |
| Sales Types Covered | Captive, Merchant |
| Regions Covered | North America, Asia Pacific, Europe, Latin America, Middle East and Africa |
| Countries Covered | United States, Canada, China, Japan, India, South Korea, Australia, Indonesia, Germany, France, United Kingdom, Italy, Spain, Russia, Brazil, Mexico |
| Companies Covered | Advanced Gas Technologies Inc., Advanced Specialty Gases Inc., Air Products and Chemicals Inc., Airgas, DuPont de Nemours Inc., Honeywell International Inc., Kanto Denka Kogyo Co. Ltd., Messer Group, Mitsui Chemicals, Norco, Nova Gas Technologies Inc., Praxair, Showa Denko K.K., Taiyo Nippon Sanso Corporation, The Linde Group and Welsco Inc. |
| Customization Scope | 10% Free Customization |
| Post-Sale Analyst Support | 10-12 Weeks |
| Delivery Format | PDF and Excel through Email (We can also provide the editable version of the report in PPT/Word format on special request) |
Key Benefits for Stakeholders:
- IMARC’s report offers a comprehensive quantitative analysis of various market segments, historical and current market trends, market forecasts, and dynamics of the specialty gases market from 2020-2034.
- The research study provides the latest information on the market drivers, challenges, and opportunities in the global specialty gases market.
- The study maps the leading, as well as the fastest-growing, regional markets. It further enables stakeholders to identify the key country-level markets within each region.
- Porter's Five Forces analysis assists stakeholders in assessing the impact of new entrants, competitive rivalry, supplier power, buyer power, and the threat of substitution. It helps stakeholders to analyze the level of competition within the specialty gases industry and its attractiveness.
- Competitive landscape allows stakeholders to understand their competitive environment and provides an insight into the current positions of key players in the market.
Frequently Asked Questions About the Specialty Gases Market Report
The specialty gases market was valued at USD 12.76 Billion in 2025.
The specialty gases market is projected to exhibit a CAGR of 6.00% during 2026-2034, reaching a value of USD 22.58 Billion by 2034.
The specialty gases market is primarily driven by the expanding semiconductor and electronics manufacturing sector, increasing healthcare applications requiring medical-grade gases, rising environmental monitoring standards, growing chemical production activities, and the adoption of advanced manufacturing technologies including laser processing and additive manufacturing across global industries
Asia Pacific currently dominates the specialty gases market, accounting for a share of 42%. The region benefits from rapid industrialization, expanding semiconductor fabrication capacity, growing healthcare infrastructure, and increasing demand for specialty gases across manufacturing and research applications.
Some of the major players in the specialty gases market include Advanced Gas Technologies Inc., Advanced Specialty Gases Inc., Air Products and Chemicals Inc., Airgas Inc., DuPont de Nemours Inc., Honeywell International Inc., Kanto Denka Kogyo Co. Ltd., Messer Group, Mitsui Chemicals, Norco, Nova Gas Technologies Inc., Praxair, Showa Denko K.K., Taiyo Nippon Sanso Corporation, The Linde Group, Welsco Inc., etc.
Need more help?
- Speak to our experienced analysts for insights on the current market scenarios.
- Include additional segments and countries to customize the report as per your requirement.
- Gain an unparalleled competitive advantage in your domain by understanding how to utilize the report and positively impacting your operations and revenue.
- For further assistance, please connect with our analysts.
 Request Customization
 Speak to an Analyst
 Request Brochure
 Inquire Before Buying
Benefits of Customization
- Personalize this research
- Triangulate with your data
- Get data as per your format and definition
- Gain a deeper dive into a specific application, geography, customer, or competitor
- Any level of personalization
Get in Touch With Us
UNITED STATES
Phone: +1-201-971-6302
INDIA
Phone: +91-120-433-0800
UNITED KINGDOM
Phone: +44-753-714-6104
Email: [email protected]
Client Testimonials


.webp)


