
Stevia Market Size, Share, Trends and Forecast by Extract Type, End Use, and Region, 2026-2034
Stevia Market Size, Share Analysis & Growth Insights:
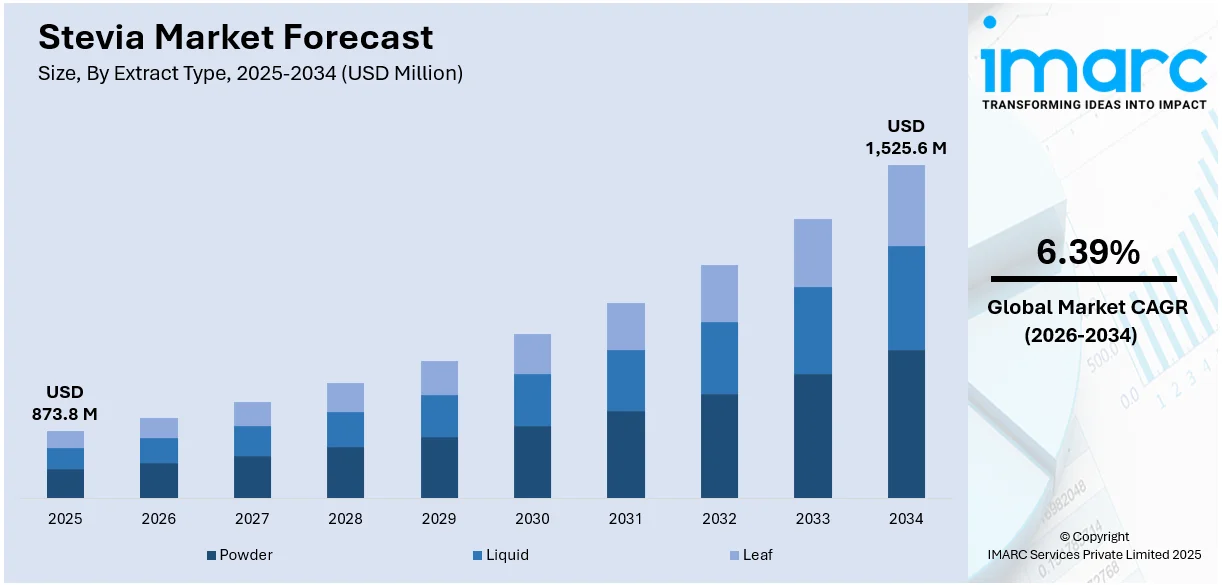
The global stevia market size was valued at USD 873.8 Million in 2025. Looking forward, IMARC Group estimates the market to reach USD 1,525.6 Million by 2034, exhibiting a CAGR of 6.39% from 2026-2034. Asia Pacific currently dominates the market, holding a market share of over 34.3% in 2025. The rising preference among individuals for natural sweeteners, coupled with the elevating applications of stevia in the food and beverage industry, are boosting the market.
|
Report Attribute
|
Key Statistics
|
|---|---|
|
Base Year
|
2025
|
|
Forecast Years
|
2026-2034
|
|
Historical Years
|
2020-2025
|
|
Market Size in 2025
|
USD 873.8 Million |
|
Market Forecast in 2034
|
USD 1,525.6 Million |
| Market Growth Rate 2026-2034 | 6.39% |
The stevia market share is undergoing massive growth due to several factors. Consumer demand for natural, plant-based sweeteners is being driven forward by rising awareness of health concerns from excessive sugar consumption. For example, in July 2024, Tate & Lyle launched Optimizer Stevia 8.1, offering a taste closest to sugar and lower costs, aligning with global trends as sugar reduction tops consumer dietary priorities. Furthermore, regulatory actions such as sugar reduction and usage of natural ingredients are leading to faster adoption. Low-calorie and specialty diets, including keto and low-carb lifestyles, are becoming favourably popular, further adding to the stevia market value. The growing uses in pharmaceuticals and personal care are also amplifying its market scope. In addition to this, more availability through retail networks and e-commerce platforms is improving access, while manufacturers focus on enhancing taste profiles to adapt to changing consumer preferences.
To get more information on this market Request Sample
Stevia market growth in the US is expanding due to health consciousness and a move towards natural low-calorie sweeteners. Heightened awareness about the adverse effects of excessive sugar intake has made consumers look for healthier alternatives, and hence they are shifting to stevia because of its plant-based origin and zero-calorie profile. The U.S. F&B industry is intensely integrating stevia into beverages, snacks, and dairy products in order to keep pace with evolving consumer demand. For instance, in April 2024, Ingredion Incorporated launched PURECIRCLE™ CTSS, a groundbreaking stevia solution 100x more soluble than Reb M, delivering unmatched clean-label sugar reduction with a natural, additive-free formulation. Moreover, the government support of sugar reduction initiatives and regulatory encouragement for natural ingredients are augmenting the stevia market demand. Stevia also benefits from the trend of health-focused diets like keto and low-carb lifestyles. Its wider availability through retail and online channels and its use in pharmaceuticals and personal care products are further driving market growth.
Stevia Market Trends:
Increasing Health-Consciousness
The growing focus among consumers on prioritizing health and wellness is strengthening the market. The report published by one of the leading consulting firms in January 2024, which surveyed more than 5,000 individuals across the United Kingdom, China, and the United States, showcased that approximately 60% of customers surveyed considered it "very" or "extremely" important to purchase products or services that help with healthy aging and longevity. Moreover, roughly 70% of people in the United Kingdom and the United States and about 85% in China indicated that they bought more in this category in prior years. These results were similar across age groups, thereby suggesting that the rising inclination toward healthy aging is spurred both by the millennial population seeking preventive solutions and older generations seeking to improve their longevity. Consequently, there is an escalating demand for natural and low-calorie sweeteners as alternatives to traditional sugar, which is expanding the stevia market scope across the globe. According to the IMARC, the global natural sweeteners market size reached USD 3.5 Billion in 2023. Looking forward, IMARC Group expects the market to reach USD 5.9 Billion by 2032, exhibiting a growth rate (CAGR) of 6.2% during 2024-2032. Apart from this, the rising prevalence of diabetes, obesity, and dental issues is encouraging consumers to reduce their sugar intake, which is also catalyzing the stevia market outlook. As per the International Food Information Council's Food and Health Survey conducted in December 2023, about 1,000 respondents in the U.S. sought out products with zero-sugar claims to limit or avoid sugar altogether.
Numerous Product Innovations
Advancements in the formulations of products, coupled with the introduction of new stevia-based products, are acting as a significant growth-inducing factor. For instance, in March 2023, Splenda, the low-calorie sweetener brand, and its parent company, Heartland Food Products Group, announced the opening of Splenda Stevia Farm to produce superior-tasting stevia sweeteners and minimize environmental impact by eliminating unnecessary CO2 emissions caused by global stevia supply chain operations. In order to develop better-tasting stevia extracts that lessen the bitter aftertaste that is typically associated with stevia, businesses are also heavily investing in research and development. This, in turn, is increasing the stevia market revenue. For example, in July 2023, Tate & Lyle, one of the key players specializing in ingredient solutions for healthier food and beverages, introduced TASTEVA SOL stevia sweetener with additional functionality and processing benefits. As per stevia market forecast, improvements in purification and extraction technology lead to high-purity products, which are more palatable. In December 2023, Domino Sugar and C&H Sugar launched product offerings that are an all-natural blend of pure cane sugar and stevia, with half the calories of sugar. Moreover, they are prepared with no artificial ingredients or sugar alcohols like erythritol. Apart from this, in February 2024, Sugar-Free, one of the market leaders in the sugar substitute category in India, launched its new variant, Sugar-Free Green, across the country. Made from Stevia leaves, it is commonly available in two formats, namely, pellets and powder. Furthermore, in May 2024, Ingredion created a drop-in stevia sweetener for its PureCircle brand's clean flavor solubility solution.
Regulatory Support
The launch of favorable policies by healthcare authorities plays a crucial role in the market's growth. The Food and Drug Administration (FDA) assesses the safety of a sweetener by evaluating the available information to identify potential hazards and determine a safe level of exposure. In the case of steviol glycosides, an acceptable daily intake (ADI) was established by the Joint Food and Agricultural Organization/World Health Organization Expert Committee on Food Additives (JECFA). Moreover, government bodies across several countries are also taking initiatives to reduce sugar consumption and combat related health issues, which is elevating the stevia market dynamics. According to the FSSAI, the guideline by the World Health Organization (WHO) can be used to educate consumers through the Eat Right India movement and create awareness among individuals to consume artificially sweetened products in moderation. Besides this, regulatory approvals provide food and beverage manufacturers with the confidence to include stevia in their formulations, which, in turn, will continue to fuel the stevia market price analysis in the coming years. For instance, in February 2024, Avansya, the joint venture between dsm-firmenich and Cargill, revealed that EverSweet stevia sweetener received a positive safety opinion from both the UK Food Standards Agency and the European Food Safety Authority (EFSA).
Stevia Industry Segmentation:
IMARC Group provides an analysis of the key trends in each segment of the global stevia market, along with forecast at the global, regional, and country levels from 2026-2034. The market has been categorized based on extract type and end use.
Analysis by Extract Type:
- Powder
- Liquid
- Leaf
According to the report, powder represented the largest market segmentation, holding 67.3% share. Powdered stevia is gaining significant popularity as a natural, zero-calorie sweetener, appealing to consumers seeking healthier alternatives to sugar. As per the stevia industry overview, this extract type offers a convenient form for use in various culinary applications, from baking to beverage preparation. As per stevia industry insights, advancements in processing techniques have improved the taste profile of powdered stevia, reducing the bitter aftertaste traditionally associated with earlier versions. This form of stevia is also favored for its long shelf life and ease of storage, further enhancing its appeal in both domestic kitchens and commercial food production. As consumers continue to prioritize health and wellness, powdered stevia will continue to augment the segment's growth. For example, in June 2023, Wisdom Natural Brands expanded its SweetLeaf product line in powdered form. Additionally, in April 2024, the Moon Store introduced Moon Lunar Hydration Powder, which is made with artificial sweeteners, such as stevia.
Analysis by End Use:
Access the comprehensive market breakdown Request Sample
- Beverages
- Food Products
- Table Top Sweeteners
- Pharmaceuticals
- Others
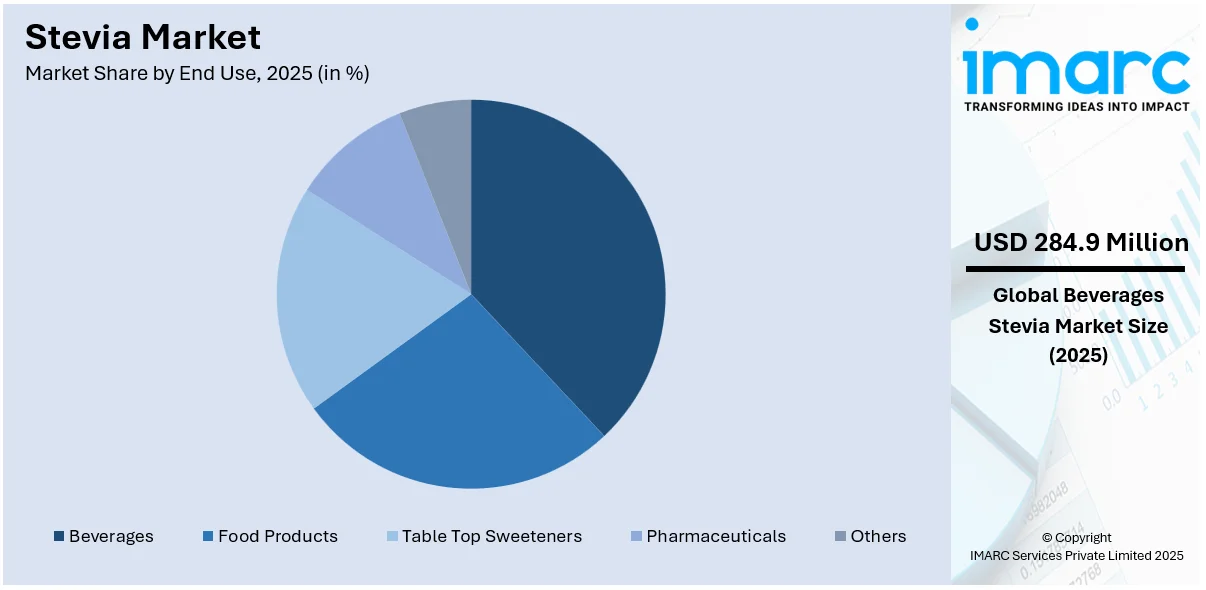
Beverages represented the largest market segmentation with a share of 36.1% share. It includes a diverse range of liquid products, such as soft drinks, flavored water, teas, and juices, where stevia serves as a natural sweetener. Apart from this, the impact of beverages on the market is significant and varied. Additionally, as consumers increasingly look for healthier and lower-calorie alternatives to traditional sugary drinks, beverage manufacturers are opting for stevia as a preferred sweetening option. Stevia's natural origin, zero-calorie content, and ability to replicate the taste of sugar make it a perfect choice to satisfy these evolving consumer preferences. As a result, it is anticipated to propel the segment's expansion during the anticipated time frame. For instance, in July 2023, Ingredion launched PureCircle Clean Taste Solutions, a range of stevia solutions tailored to specific applications in the preparation of beverages.
Regional Analysis:
To get more information on the regional analysis of this market Request Sample
- Asia Pacific
- China
- Japan
- India
- South Korea
- Australia
- Indonesia
- Others
- North America
- United States
- Canada
- Europe
- Germany
- France
- United Kingdom
- Italy
- Spain
- Russia
- Others
- Middle East and Africa
- Turkey
- Saudi Arabia
- Iran
- United Arab Emirates
- Others
- Latin America
- Brazil
- Mexico
- Argentina
- Colombia
- Chile
- Peru
- Others
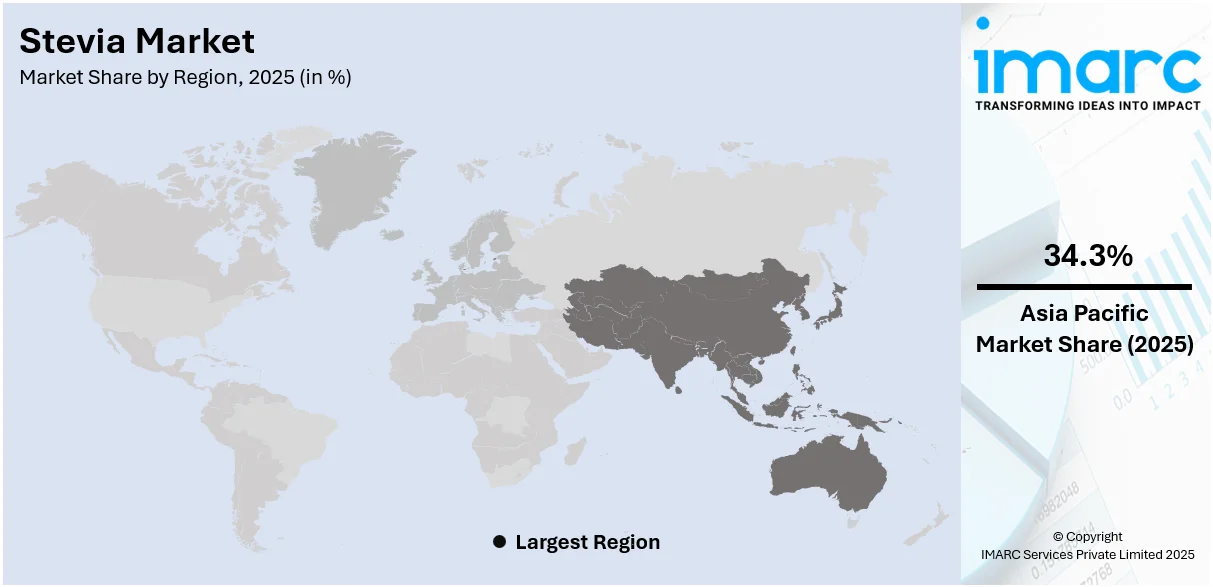
According to the report, Asia-Pacific accounted for the largest market share, holding a 33.3% share. The Asia Pacific stevia market is experiencing robust growth, driven by increasing health consciousness and a shift towards natural sweeteners. The stevia market research report states that countries such as China, India, Japan, and South Korea are leading this trend, with a rising number of consumers seeking healthier alternatives to sugar. For example, in April 2024, QNET India launched a vibrant social media initiative labeled Healthy Living with Natose Stevia. This campaign aims to highlight the importance of minimizing sugar intake and embracing healthier alternatives like stevia, a natural sweetener. The demand for stevia is bolstered by the region's growing diabetic population and government initiatives promoting reduced sugar intake. According to the Global Nutrition Report, in 2022, approximately 6.0% of adult men and about 4.3% of adult women aged 18 years and over in Japan were obese. Additionally, as per the stevia market growth analysis, the region's strong tradition of plant-based ingredients is acting as another significant growth-inducing factor. As the market expands, the Asia Pacific region is set to become a significant player in the global stevia industry, reflecting broader trends toward health and wellness. The report published by McKinsey in January 2024 showed that approximately 85% of individuals in China bought products that help with healthy aging and longevity.
Stevia Regional Takeaways:
North America Stevia Market Analysis
The market for stevia is very big in North America, fueled by a large demand from the consumer base for natural and low-calorie sugar alternatives. As health consciousness grows, people are highly preferring stevia for the fact that it is plant-based, zero-calorie, and compatible with diverse forms of diet. Used throughout the F&B industries like beverages, snacks, dairy products, and confectionery, it helps tackle the amplifying demand for a healthier and reduced sugar alternative. This is also from the heightened awareness of lifestyle disorders due to excessive consumption of sugar, which propels consumers to choose more of natural sweeteners. Its formulation flexibility makes stevia an attractive choice for manufacturers trying to keep up with the shifting preferences of the consumer. Moreover, there are various regulatory measures supporting the reduction of sugar in F&B products, and its adoption in the region is being spurred by such policies. Stevia has become a part of the F&B innovations of North America, representing a wider movement toward lifestyles that are oriented toward health.
United States Stevia Market Analysis
The main drivers of the stevia market in the United States are consumer demand for natural sweeteners, the incidence of lifestyle diseases, and increasing health consciousness. According to the data from Centre for Disease Control and Prevention, over 40% of adults suffer from obesity and 23% of U.S. adults with obesity have diabetes, customers are actively seeking low-calorie and sugar-reducing options. This trend is further bolstered by the increased use of stevia as a zero-calorie sweetener that is more frequently used in beverages, snack foods, and desserts. Large beverage companies like PepsiCo and Coca-Cola also included stevia in their portfolios, for example, Pepsi True and Diet Coke. Product innovation is also being boosted by the FDA (Food and Drug Administration) approval of steviol glycosides as GRAS. Stevia-based products today fill a large portion of the natural sweeteners market in the United States. Low-carb diets, vegan diets, ketogenic diets, and other similar dietary regimes have increased the demand for using stevia as a sugar substitute. Not only that, but greater access to e-commerce because of the growing industry means over 20% of natural sweetener sales are based online. Improved flavor profiles are guaranteed from increased investment into more advanced types of stevia derivatives including Reb M and Reb D, which will propel acceptance at a much faster pace in the U.S.
Europe Stevia Market Analysis
The sales of stevia in the European market are primarily inspired by stringent legislation governing sugar levels, rising prevalence of people with diabetes, and intense demand from the consumers' side for more natural consumables. Manufacturers are using stevia as an alternative because the European Union issued a mandate to cut by 10% of more added sugar across all categories by 2025. The main countries where this is happening are Germany, UK, and France. German is the leading region within this area in terms of how it introduces stevia products. According to the data by European Federation of Pharmaceutical Industries and Associations, more than 60 million people live with diabetes. The region's rising prevalence of diabetes is encouraging consumers to opt for low-calorie sweeteners. About 15% of protein powders and energy drinks use stevia as a sweetener, showing the increasing demand for stevia in sports nutrition. Since the carbon footprint of growing stevia is much lower than that of growing sugarcane, focus on sustainability has increased its acceptance even more. The applications of Stevia are increasing in Europe due to inventions of taste-enhancing mixtures.
Asia Pacific Stevia Market Analysis
Due to health awareness, growing disposable incomes, and high sugar consumption, Asia-Pacific region is the largest producer and consumer of Stevia. About 537 million people in the world and 90 million in South-East Asia have diabetes, and the statistics from the International Diabetes Federation say the figure will be about 151.5 million by 2045. The largest producer of stevia is China, where over 80% of China's stevia is exported as the government promotes its growth as a way of expanding the country's agricultural-based economy. Growing rates of diabetes and obesity fuel the demand for natural sweeteners in countries like India and Japan; for instance, stevia has been commercially embraced as a sweetener in Japanese food products since the 1970s. Stevia is being consumed in the region's rapidly expanding beverage industry, especially in China and India, flavored water, iced teas, and diet sodas. Stevia is also used in South Korean and Australian dairy products, and this drives the growth of the market. In addition, the rising demand for plant-based and herbal products in Asia-Pacific helps support the acceptance of stevia.
Latin America Stevia Market Analysis
The market for stevia in Latin America is influenced by health consciousness within the region and its importance as a key production base. The world's top stevia producer and exporter is Paraguay, the plant's native nation. The demand is being driven by growing awareness of diabetes control, and Brazil and Mexico are the major users. The fact that 14 million Mexicans and over 15 million Brazilians suffer from diabetes, according to data by International Diabetes Federation, fuels interest in low-calorie sweeteners. Due to regional product offerings by companies such as PepsiCo and Coca-Cola, stevia is increasingly used in soft drinks and sweets. Regional acceptance of natural products along with increasing partnerships between food manufacturers and stevia farmers support market growth.
Middle East and Africa Stevia Market Analysis
The market for stevia is growing throughout the Middle East and Africa due to increased obesity rates, a shift towards better diets, and growing knowledge of diabetes treatment. According to the International Diabetes Federation, most GCC nations have a high prevalence rate of prediabetes above 15% and diabetes above 20%. Stevia is frequently used to replace sugar in baked goods and beverages. The adoption of natural sweeteners like stevia is encouraged by the region's increased emphasis on diet and wellness. International companies are also expanding their market share by launching stevia-based goods that are suited to regional tastes.
Leading Stevia Companies:
The market is experiencing steady growth as key players are actively innovating to meet evolving consumer demands and expand their product offerings. The creation of sweeteners based on stevia that have better flavor profiles is one noteworthy advance. Several leading companies are investing in research and development (R&D) to overcome the lingering aftertaste associated with stevia, creating formulations that closely mimic the taste of sugar. Additionally, there has been a heightened focus on expanding the applications of stevia beyond tabletop sweeteners and into a broader range of food and beverage (F&B) products. This contains developments in baked items, dairy products, condiments, and beverages sweetened with stevia. Furthermore, as per the stevia market insights, sustainable sourcing and production methods have gained attention, with companies exploring environmentally friendly cultivation practices and supply chain transparency to meet the escalating demand for responsibly sourced stevia. These developments demonstrate the industry's dedication to meeting consumer demands for natural, sustainable, and healthier substitutes for conventional sugar.
The report provides a comprehensive analysis of the competitive landscape in the stevia market with detailed profiles of all major companies, including:
- Archer-Daniels-Midland Company
- Cargill Incorporated
- GLG Life Tech Corporation
- Guilin Layn Natural Ingredients Corp.
- Hunan NutraMax Inc.
- Ingredion Incorporated
- Morita Kagaku Kogyo Co. Ltd.
- Pyure Brands LLC
- Sunwin Stevia International Inc
- Tate & Lyle PLC
- The Real Stevia Company AB
- Wisdom Natural Brands
- Zhucheng Haotian Pharm Co. Ltd.
Latest News and Developments:
- November 2024: Wisdom Natural Brands, parent company of SweetLeaf, acquired Canada's Drizzle Honey, expanding its natural sweetener portfolio. Drizzle's sustainably sourced, raw honey products complement SweetLeaf’s stevia and monk fruit offerings. The acquisition opens U.S. distribution for Drizzle, aligning with Wisdom's focus on providing healthy, natural alternatives to refined sugar.
- October 2024: Tate & Lyle PLC and Manus announced a partnership, The Natural Sweetener Alliance, to expand access to bioconverted stevia Reb M sourced and manufactured in the Americas. This collaboration aims to meet growing demand for natural sugar reduction solutions, ensuring traceability, enhancing supply chain security, and offering sustainable, high-quality sweeteners across the food and beverage industry.
- August 2024: Howtian launched SoPure Dorado, an unrefined, golden stevia extract with zero calories. Minimally processed, the sweetener maintains its natural hue and is designed for consumers seeking plant-based, less processed products. It is ideal for tabletop sweeteners, syrups, and sauces. SoPure Dorado addresses consumer demand for healthier, low-sugar, and culturally appealing alternatives.
- May 2024: Ingredion introduced PureCircle Clean Taste Solubility Solution (CTSS), a non-GMO, 100% stevia sweetener 100 times more soluble than Reb M. It provides superior taste and solubility without additives, outperforming other stevia and artificial sweeteners. CTSS targets food and beverage applications with sugar reduction challenges, offering scalability through advanced stevia technologies.
Stevia Market Report Scope:
| Report Features | Details |
|---|---|
| Base Year of the Analysis | 2025 |
| Historical Period | 2020-2025 |
| Forecast Period | 2026-2034 |
| Units | Million USD, Metric Tons |
| Scope of the Report | Exploration of Historical Trends and Market Outlook, Industry Catalysts and Challenges, Segment-Wise Historical and Future Market Assessment:
|
| Extract Types Covered | Powder, Liquid, Leaf |
| End Uses Covered | Beverages, Food Products, Table Top Sweeteners, Pharmaceuticals, Others |
| Regions Covered | Asia Pacific, North America, Europe, Middle East and Africa, Latin America |
| Countries Covered | China, Japan, India, South Korea, Australia, Indonesia, United States, Canada, Germany, France, United Kingdom, Italy, Spain, Russia, Turkey, Saudi Arabia, Iran, United Arab Emirates, Brazil, Mexico, Argentina, Colombia, Chile, Peru |
| Companies Covered | Archer-Daniels-Midland Company, Cargill Incorporated, GLG Life Tech Corporation, Guilin Layn Natural Ingredients Corp., Hunan NutraMax Inc., Ingredion Incorporated, Morita Kagaku Kogyo Co. Ltd., Pyure Brands LLC, Sunwin Stevia International Inc, Tate & Lyle PLC, The Real Stevia Company AB, Wisdom Natural Brands, Zhucheng Haotian Pharm Co. Ltd., etc. |
| Customization Scope | 10% Free Customization |
| Post-Sale Analyst Support | 10-12 Weeks |
| Delivery Format | PDF and Excel through Email (We can also provide the editable version of the report in PPT/Word format on special request) |
Key Benefits for Stakeholders:
- IMARC’s report offers a comprehensive quantitative analysis of various market segments, historical and current market trends, market forecasts, and dynamics of the stevia market from 2020-2034.
- The research study provides the latest information on the market drivers, challenges, and opportunities in the global stevia market.
- The study maps the leading, as well as the fastest-growing, regional markets. It further enables stakeholders to identify the key country-level markets within each region.
- Porter's Five Forces analysis assists stakeholders in assessing the impact of new entrants, competitive rivalry, supplier power, buyer power, and the threat of substitution. It helps stakeholders to analyze the level of competition within the stevia industry and its attractiveness.
- Competitive landscape allows stakeholders to understand their competitive environment and provides an insight into the current positions of key players in the market.
Frequently Asked Questions About the Stevia Market Report
Stevia is a plant-based natural sweetener extracted from the leaves of the stevia rebaudiana plant. It has zero calories and high sweetness intensity, which makes it popular as an alternative to sugar. Stevia is widely used in F&B and other products for reducing sugar content with retained sweetness for health-conscious and diabetic people who are seeking a natural source of sweetening.
The global stevia market was valued at USD 873.8 Million in 2025.
IMARC estimates the global stevia market to exhibit a CAGR of 6.39% during 2026-2034.
The global stevia market is driven by rising health awareness, increasing demand for natural and low-calorie sweeteners, and the growing adoption of sugar alternatives in food and beverages. Regulatory support for sugar reduction initiatives, the popularity of health-focused diets like keto, and expanding applications in pharmaceuticals and personal care are further propelling the market's growth globally.
In 2025, powder represented the largest segment by extract type, driven by its ease of use, longer shelf life, and widespread application across food, beverages, and personal care products. Its versatility allows for precise formulation, making it a preferred choice for manufacturers targeting reduced-sugar or calorie-free products in various industries.
Beverages leads the market by end use owing to the rising demand for low-calorie, naturally sweetened drinks. Stevia’s ability to maintain sweetness without adding calories makes it ideal for soft drinks, teas, and flavored water, aligning with consumer preferences for healthier, sugar-free beverage options amid increasing health consciousness worldwide.
On a regional level, the market has been classified into North America, Asia Pacific, Europe, Latin America, and Middle East and Africa, wherein Asia Pacific currently dominates the global market.
Some of the major players in the global stevia market include Archer-Daniels-Midland Company, Cargill Incorporated, GLG Life Tech Corporation, Guilin Layn Natural Ingredients Corp., Hunan NutraMax Inc., Ingredion Incorporated, Morita Kagaku Kogyo Co. Ltd., Pyure Brands LLC, Sunwin Stevia International Inc, Tate & Lyle PLC, The Real Stevia Company AB, Wisdom Natural Brands, Zhucheng Haotian Pharm Co. Ltd., etc.
Need more help?
- Speak to our experienced analysts for insights on the current market scenarios.
- Include additional segments and countries to customize the report as per your requirement.
- Gain an unparalleled competitive advantage in your domain by understanding how to utilize the report and positively impacting your operations and revenue.
- For further assistance, please connect with our analysts.
 Request Customization
 Speak to an Analyst
 Request Brochure
 Inquire Before Buying
Benefits of Customization
- Personalize this research
- Triangulate with your data
- Get data as per your format and definition
- Gain a deeper dive into a specific application, geography, customer, or competitor
- Any level of personalization
Get in Touch With Us
UNITED STATES
Phone: +1-201-971-6302
INDIA
Phone: +91-120-433-0800
UNITED KINGDOM
Phone: +44-753-714-6104
Email: [email protected]
Client Testimonials


.webp)


