Market Overview:
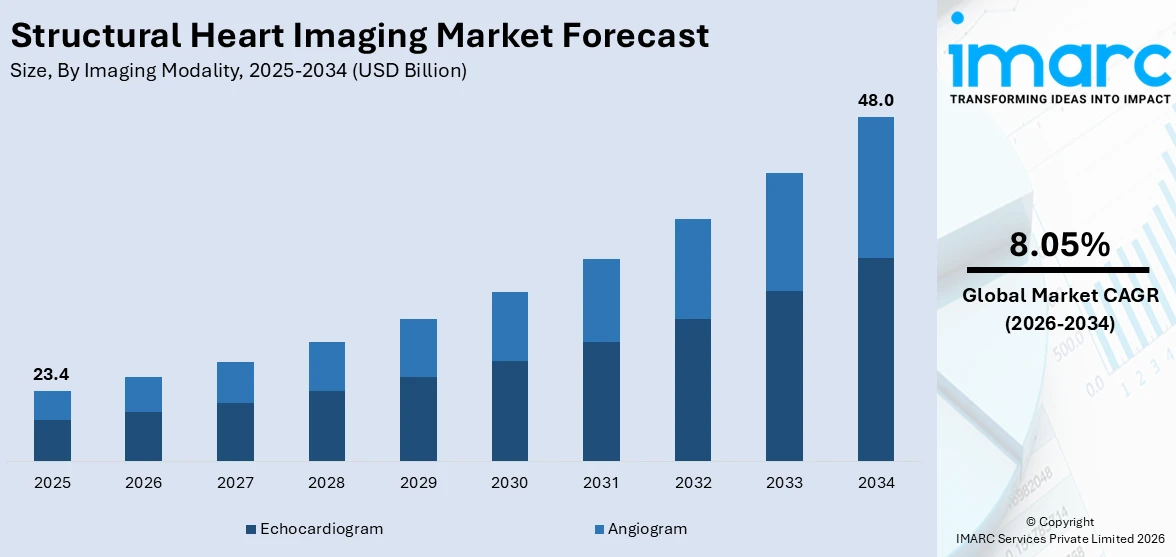
The global structural heart imaging market reached a value of US$ 16.2 Billion in 2021. Looking forward, IMARC Group expects the market to reach a value of US$ 30.4 Billion by 2027 exhibiting a CAGR of 10.60% during 2022-2027. Keeping in mind the uncertainties of COVID-19, we are continuously tracking and evaluating the direct as well as the indirect influence of the pandemic. These insights are included in the report as a major market contributor.
Structural heart imaging (SHI) is a special technique, which is extensively deployed in the healthcare industry for screening and examining the heart at the molecular level. This procedure includes the utilization of light reflection for producing the interior element images and creating a 2-dimensional cross-section analysis to get a clarified and accurate diagnosis. It is further used for enabling and assisting professionals while performing various operative procedures, such as locating the blockages and pathways for insertion by minimizing the risk of interference.
www.imarcgroup.com
Note: Values and trends in the above chart consists of dummy data and are only shown here for representation purpose. Kindly contact us for the actual market size and trends.
Structural Heart Imaging Market Trends:
The escalating prevalence of various congenital, cardiac diseases and lifestyle-induced ailments, such as obesity, diabetes, and high blood pressure due to excessive alcohol consumption and unhealthy eating habits, is one of the primary factors majorly driving the global heart imaging market toward the growth. Furthermore, the rising health consciousness amongst the consumers is positively influencing the market across the globe. In addition to this, the widespread adoption of SHI for addressing various heart conditions, such as non-valvular and valvular heart diseases, with the support of high precision and resolution cameras and sensors is considerably contributing to the market growth. Moreover, the introduction of transcatheter aortic valve replacement (TAVR) for operating heart diseases interventions by ensuring instant recovery of consumers post-surgery is promoting the growth of the market. Other than this, the rising investments in research and development (R&D) activities for introducing advanced structural heart imaging and cardiac systems is creating a positive outlook for the market. In line with this, the market is further being driven by the numerous initiatives undertaken by the governments of various nations for improving the healthcare infrastructure to ensure patients wellness.
Key Market Segmentation:
IMARC Group provides an analysis of the key trends in each sub-segment of the global structural heart imaging market, along with forecasts at the global, regional and country level from 2022-2027. Our report has categorized the market based on imaging modality, procedure type, application and end user.
Breakup by Imaging Modality:
Breakup by Procedure Type:
- Transcatheter Aortic Valve Replacement (TAVR)
- Surgical Aortic Valve Replacement (SAVR)
- Transcatheter Mitral Valve Repair (TMVR)
- Left Atrial Appendage Closure (LAAC)
- Annuloplasty
- Valvuloplasty
- Others
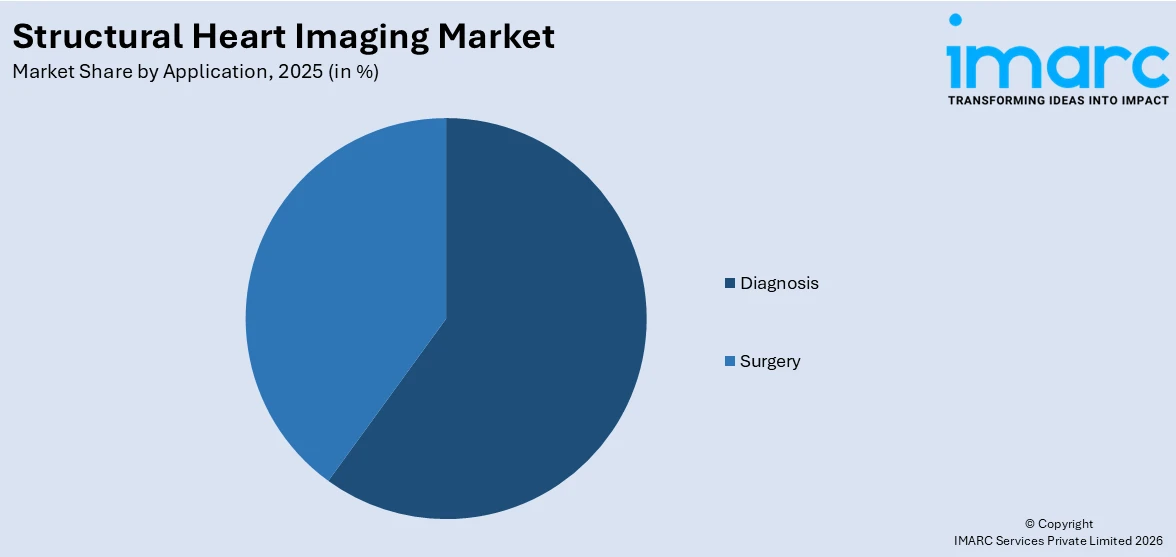
Breakup by Application:
www.imarcgroup.com
Note: Values and trends in the above chart consists of dummy data and are only shown here for representation purpose. Kindly contact us for the actual market size and trends.
Breakup by End User:
- Hospitals
- Specialty Clinics
- Cardiac Centers
- Diagnostic Centers
- Ambulatory Surgical Centers
- Catheterization Laboratories
- Others
Breakup by Region:
To get more information on the regional analysis of this market, Request Sample
- North America
- Asia-Pacific
- China
- Japan
- India
- South Korea
- Australia
- Indonesia
- Others
- Europe
- Germany
- France
- United Kingdom
- Italy
- Spain
- Russia
- Others
- Latin America
- Middle East and Africa
Competitive Landscape:
The competitive landscape of the industry has also been examined along with the profiles of the key players being Abbott Laboratories, Boston Scientific Corporation, Circle Cardiovascular Imaging Inc., Edwards Lifesciences Corporation, Integer Holdings Corporation, Koninklijke Philips N.V., Lepu Medical Technology (Beijing) Co. Ltd., LivaNova PLC, Medtronic plc, Pie Medical Imaging B.V. and Siemens Healthcare GmbH.
Report Coverage:
Report Features |
Details |
---|
Base Year of the Analysis |
2021 |
Historical Period |
2016-2021 |
Forecast Period |
2022-2027 |
Units |
US$ Billion |
Segment Coverage |
Imaging Modality, Procedure Type, Application, End User, Region |
Region Covered |
Asia Pacific, Europe, North America, Latin America, Middle East and Africa |
Countries Covered |
United States, Canada, Germany, France, United Kingdom, Italy, Spain, Russia, China, Japan, India, South Korea, Australia, Indonesia, Brazil, Mexico |
Companies Covered |
Abbott Laboratories, Boston Scientific Corporation, Circle Cardiovascular Imaging Inc., Edwards Lifesciences Corporation, Integer Holdings Corporation, Koninklijke Philips N.V., Lepu Medical Technology (Beijing) Co. Ltd., LivaNova PLC, Medtronic plc, Pie Medical Imaging B.V. and Siemens Healthcare GmbH. |
Customization Scope |
10% Free Customization |
Report Price and Purchase Option |
Single User License: US$ 2499
Five User License: US$ 3499
Corporate License: US$ 4499 |
Post-Sale Analyst Support |
10-12 Weeks |
Delivery Format |
PDF and Excel through Email (We can also provide the editable version of the report in PPT/Word format on special request) |
Key Questions Answered in This Report:
- How has the global structural heart imaging market performed so far and how will it perform in the coming years?
- What has been the impact of COVID-19 on the global structural heart imaging market?
- What are the key regional markets?
- What is the breakup of the market based on the imaging modality?
- What is the breakup of the market based on the procedure type?
- What is the breakup of the market based on the application?
- What is the breakup of the market based on the end user?
- What are the various stages in the value chain of the industry?
- What are the key driving factors and challenges in the industry?
- What is the structure of the global structural heart imaging market and who are the key players?
- What is the degree of competition in the industry?
1 Preface
2 Scope and Methodology
2.1 Objectives of the Study
2.2 Stakeholders
2.3 Data Sources
2.3.1 Primary Sources
2.3.2 Secondary Sources
2.4 Market Estimation
2.4.1 Bottom-Up Approach
2.4.2 Top-Down Approach
2.5 Forecasting Methodology
3 Executive Summary
4 Introduction
4.1 Overview
4.2 Key Industry Trends
5 Global Structural Heart Imaging Market
5.1 Market Overview
5.2 Market Performance
5.3 Impact of COVID-19
5.4 Market Forecast
6 Market Breakup by Imaging Modality
6.1 Echocardiogram
6.1.1 Market Trends
6.1.2 Market Forecast
6.2 Angiogram
6.2.1 Market Trends
6.2.2 Key Segments
6.2.2.1 CT
6.2.2.2 MRI
6.2.3 Market Forecast
7 Market Breakup by Procedure Type
7.1 Transcatheter Aortic Valve Replacement (TAVR)
7.1.1 Market Trends
7.1.2 Market Forecast
7.2 Surgical Aortic Valve Replacement (SAVR)
7.2.1 Market Trends
7.2.2 Market Forecast
7.3 Transcatheter Mitral Valve Repair (TMVR)
7.3.1 Market Trends
7.3.2 Market Forecast
7.4 Left Atrial Appendage Closure (LAAC)
7.4.1 Market Trends
7.4.2 Market Forecast
7.5 Annuloplasty
7.5.1 Market Trends
7.5.2 Market Forecast
7.6 Valvuloplasty
7.6.1 Market Trends
7.6.2 Market Forecast
7.7 Others
7.7.1 Market Trends
7.7.2 Market Forecast
8 Market Breakup by Application
8.1 Diagnosis
8.1.1 Market Trends
8.1.2 Market Forecast
8.2 Surgery
8.2.1 Market Trends
8.2.2 Market Forecast
9 Market Breakup by End User
9.1 Hospitals
9.1.1 Market Trends
9.1.2 Market Forecast
9.2 Specialty Clinics
9.2.1 Market Trends
9.2.2 Market Forecast
9.3 Cardiac Centers
9.3.1 Market Trends
9.3.2 Market Forecast
9.4 Diagnostic Centers
9.4.1 Market Trends
9.4.2 Market Forecast
9.5 Ambulatory Surgical Centers
9.5.1 Market Trends
9.5.2 Market Forecast
9.6 Catheterization Laboratories
9.6.1 Market Trends
9.6.2 Market Forecast
9.7 Others
9.7.1 Market Trends
9.7.2 Market Forecast
10 Market Breakup by Region
10.1 North America
10.1.1 United States
10.1.1.1 Market Trends
10.1.1.2 Market Forecast
10.1.2 Canada
10.1.2.1 Market Trends
10.1.2.2 Market Forecast
10.2 Asia-Pacific
10.2.1 China
10.2.1.1 Market Trends
10.2.1.2 Market Forecast
10.2.2 Japan
10.2.2.1 Market Trends
10.2.2.2 Market Forecast
10.2.3 India
10.2.3.1 Market Trends
10.2.3.2 Market Forecast
10.2.4 South Korea
10.2.4.1 Market Trends
10.2.4.2 Market Forecast
10.2.5 Australia
10.2.5.1 Market Trends
10.2.5.2 Market Forecast
10.2.6 Indonesia
10.2.6.1 Market Trends
10.2.6.2 Market Forecast
10.2.7 Others
10.2.7.1 Market Trends
10.2.7.2 Market Forecast
10.3 Europe
10.3.1 Germany
10.3.1.1 Market Trends
10.3.1.2 Market Forecast
10.3.2 France
10.3.2.1 Market Trends
10.3.2.2 Market Forecast
10.3.3 United Kingdom
10.3.3.1 Market Trends
10.3.3.2 Market Forecast
10.3.4 Italy
10.3.4.1 Market Trends
10.3.4.2 Market Forecast
10.3.5 Spain
10.3.5.1 Market Trends
10.3.5.2 Market Forecast
10.3.6 Russia
10.3.6.1 Market Trends
10.3.6.2 Market Forecast
10.3.7 Others
10.3.7.1 Market Trends
10.3.7.2 Market Forecast
10.4 Latin America
10.4.1 Brazil
10.4.1.1 Market Trends
10.4.1.2 Market Forecast
10.4.2 Mexico
10.4.2.1 Market Trends
10.4.2.2 Market Forecast
10.4.3 Others
10.4.3.1 Market Trends
10.4.3.2 Market Forecast
10.5 Middle East and Africa
10.5.1 Market Trends
10.5.2 Market Breakup by Country
10.5.3 Market Forecast
11 SWOT Analysis
11.1 Overview
11.2 Strengths
11.3 Weaknesses
11.4 Opportunities
11.5 Threats
12 Value Chain Analysis
13 Porters Five Forces Analysis
13.1 Overview
13.2 Bargaining Power of Buyers
13.3 Bargaining Power of Suppliers
13.4 Degree of Competition
13.5 Threat of New Entrants
13.6 Threat of Substitutes
14 Price Analysis
15 Competitive Landscape
15.1 Market Structure
15.2 Key Players
15.3 Profiles of Key Players
15.3.1 Abbott Laboratories
15.3.1.1 Company Overview
15.3.1.2 Product Portfolio
15.3.1.3 Financials
15.3.1.4 SWOT Analysis
15.3.2 Boston Scientific Corporation
15.3.2.1 Company Overview
15.3.2.2 Product Portfolio
15.3.2.3 Financials
15.3.2.4 SWOT Analysis
15.3.3 Circle Cardiovascular Imaging Inc.
15.3.3.1 Company Overview
15.3.3.2 Product Portfolio
15.3.4 Edwards Lifesciences Corporation
15.3.4.1 Company Overview
15.3.4.2 Product Portfolio
15.3.4.3 Financials
15.3.4.4 SWOT Analysis
15.3.5 Integer Holdings Corporation
15.3.5.1 Company Overview
15.3.5.2 Product Portfolio
15.3.5.3 Financials
15.3.6 Koninklijke Philips N.V.
15.3.6.1 Company Overview
15.3.6.2 Product Portfolio
15.3.6.3 Financials
15.3.6.4 SWOT Analysis
15.3.7 Lepu Medical Technology (Beijing) Co. Ltd.
15.3.7.1 Company Overview
15.3.7.2 Product Portfolio
15.3.7.3 Financials
15.3.8 LivaNova PLC
15.3.8.1 Company Overview
15.3.8.2 Product Portfolio
15.3.8.3 Financials
15.3.9 Medtronic plc
15.3.9.1 Company Overview
15.3.9.2 Product Portfolio
15.3.9.3 Financials
15.3.9.4 SWOT Analysis
15.3.10 Pie Medical Imaging B.V.
15.3.10.1 Company Overview
15.3.10.2 Product Portfolio
15.3.11 Siemens Healthcare GmbH
15.3.11.1 Company Overview
15.3.11.2 Product Portfolio
15.3.11.3 Financials
15.3.11.4 SWOT Analysis
List of Figures
Figure 1: Global: Structural Heart Imaging Market: Major Drivers and Challenges
Figure 2: Global: Structural Heart Imaging Market: Sales Value (in Billion US$), 2016-2021
Figure 3: Global: Structural Heart Imaging Market Forecast: Sales Value (in Billion US$), 2022-2027
Figure 4: Global: Structural Heart Imaging Market: Breakup by Imaging Modality (in %), 2021
Figure 5: Global: Structural Heart Imaging Market: Breakup by Procedure Type (in %), 2021
Figure 6: Global: Structural Heart Imaging Market: Breakup by Application (in %), 2021
Figure 7: Global: Structural Heart Imaging Market: Breakup by End User (in %), 2021
Figure 8: Global: Structural Heart Imaging Market: Breakup by Region (in %), 2021
Figure 9: Global: Structural Heart Imaging (Echocardiogram) Market: Sales Value (in Million US$), 2016 & 2021
Figure 10: Global: Structural Heart Imaging (Echocardiogram) Market Forecast: Sales Value (in Million US$), 2022-2027
Figure 11: Global: Structural Heart Imaging (Angiogram) Market: Sales Value (in Million US$), 2016 & 2021
Figure 12: Global: Structural Heart Imaging (Angiogram) Market Forecast: Sales Value (in Million US$), 2022-2027
Figure 13: Global: Structural Heart Imaging (Transcatheter Aortic Valve Replacement (TAVR)) Market: Sales Value (in Million US$), 2016 & 2021
Figure 14: Global: Structural Heart Imaging (Transcatheter Aortic Valve Replacement (TAVR)) Market Forecast: Sales Value (in Million US$), 2022-2027
Figure 15: Global: Structural Heart Imaging (Surgical Aortic Valve Replacement (SAVR)) Market: Sales Value (in Million US$), 2016 & 2021
Figure 16: Global: Structural Heart Imaging (Surgical Aortic Valve Replacement (SAVR)) Market Forecast: Sales Value (in Million US$), 2022-2027
Figure 17: Global: Structural Heart Imaging (Transcatheter Mitral Valve Repair (TMVR)) Market: Sales Value (in Million US$), 2016 & 2021
Figure 18: Global: Structural Heart Imaging (Transcatheter Mitral Valve Repair (TMVR)) Market Forecast: Sales Value (in Million US$), 2022-2027
Figure 19: Global: Structural Heart Imaging (Left Atrial Appendage Closure (LAAC)) Market: Sales Value (in Million US$), 2016 & 2021
Figure 20: Global: Structural Heart Imaging (Left Atrial Appendage Closure (LAAC)) Market Forecast: Sales Value (in Million US$), 2022-2027
Figure 21: Global: Structural Heart Imaging (Annuloplasty) Market: Sales Value (in Million US$), 2016 & 2021
Figure 22: Global: Structural Heart Imaging (Annuloplasty) Market Forecast: Sales Value (in Million US$), 2022-2027
Figure 23: Global: Structural Heart Imaging (Valvuloplasty) Market: Sales Value (in Million US$), 2016 & 2021
Figure 24: Global: Structural Heart Imaging (Valvuloplasty) Market Forecast: Sales Value (in Million US$), 2022-2027
Figure 25: Global: Structural Heart Imaging (Other Procedure Types) Market: Sales Value (in Million US$), 2016 & 2021
Figure 26: Global: Structural Heart Imaging (Other Procedure Types) Market Forecast: Sales Value (in Million US$), 2022-2027
Figure 27: Global: Structural Heart Imaging (Diagnosis) Market: Sales Value (in Million US$), 2016 & 2021
Figure 28: Global: Structural Heart Imaging (Diagnosis) Market Forecast: Sales Value (in Million US$), 2022-2027
Figure 29: Global: Structural Heart Imaging (Surgery) Market: Sales Value (in Million US$), 2016 & 2021
Figure 30: Global: Structural Heart Imaging (Surgery) Market Forecast: Sales Value (in Million US$), 2022-2027
Figure 31: Global: Structural Heart Imaging (Hospitals) Market: Sales Value (in Million US$), 2016 & 2021
Figure 32: Global: Structural Heart Imaging (Hospitals) Market Forecast: Sales Value (in Million US$), 2022-2027
Figure 33: Global: Structural Heart Imaging (Specialty Clinics) Market: Sales Value (in Million US$), 2016 & 2021
Figure 34: Global: Structural Heart Imaging (Specialty Clinics) Market Forecast: Sales Value (in Million US$), 2022-2027
Figure 35: Global: Structural Heart Imaging (Cardiac Centers) Market: Sales Value (in Million US$), 2016 & 2021
Figure 36: Global: Structural Heart Imaging (Cardiac Centers) Market Forecast: Sales Value (in Million US$), 2022-2027
Figure 37: Global: Structural Heart Imaging (Diagnostic Centers) Market: Sales Value (in Million US$), 2016 & 2021
Figure 38: Global: Structural Heart Imaging (Diagnostic Centers) Market Forecast: Sales Value (in Million US$), 2022-2027
Figure 39: Global: Structural Heart Imaging (Ambulatory Surgical Centers) Market: Sales Value (in Million US$), 2016 & 2021
Figure 40: Global: Structural Heart Imaging (Ambulatory Surgical Centers) Market Forecast: Sales Value (in Million US$), 2022-2027
Figure 41: Global: Structural Heart Imaging (Catheterization Laboratories) Market: Sales Value (in Million US$), 2016 & 2021
Figure 42: Global: Structural Heart Imaging (Catheterization Laboratories) Market Forecast: Sales Value (in Million US$), 2022-2027
Figure 43: Global: Structural Heart Imaging (Other End Users) Market: Sales Value (in Million US$), 2016 & 2021
Figure 44: Global: Structural Heart Imaging (Other End Users) Market Forecast: Sales Value (in Million US$), 2022-2027
Figure 45: North America: Structural Heart Imaging Market: Sales Value (in Million US$), 2016 & 2021
Figure 46: North America: Structural Heart Imaging Market Forecast: Sales Value (in Million US$), 2022-2027
Figure 47: United States: Structural Heart Imaging Market: Sales Value (in Million US$), 2016 & 2021
Figure 48: United States: Structural Heart Imaging Market Forecast: Sales Value (in Million US$), 2022-2027
Figure 49: Canada: Structural Heart Imaging Market: Sales Value (in Million US$), 2016 & 2021
Figure 50: Canada: Structural Heart Imaging Market Forecast: Sales Value (in Million US$), 2022-2027
Figure 51: Asia-Pacific: Structural Heart Imaging Market: Sales Value (in Million US$), 2016 & 2021
Figure 52: Asia-Pacific: Structural Heart Imaging Market Forecast: Sales Value (in Million US$), 2022-2027
Figure 53: China: Structural Heart Imaging Market: Sales Value (in Million US$), 2016 & 2021
Figure 54: China: Structural Heart Imaging Market Forecast: Sales Value (in Million US$), 2022-2027
Figure 55: Japan: Structural Heart Imaging Market: Sales Value (in Million US$), 2016 & 2021
Figure 56: Japan: Structural Heart Imaging Market Forecast: Sales Value (in Million US$), 2022-2027
Figure 57: India: Structural Heart Imaging Market: Sales Value (in Million US$), 2016 & 2021
Figure 58: India: Structural Heart Imaging Market Forecast: Sales Value (in Million US$), 2022-2027
Figure 59: South Korea: Structural Heart Imaging Market: Sales Value (in Million US$), 2016 & 2021
Figure 60: South Korea: Structural Heart Imaging Market Forecast: Sales Value (in Million US$), 2022-2027
Figure 61: Australia: Structural Heart Imaging Market: Sales Value (in Million US$), 2016 & 2021
Figure 62: Australia: Structural Heart Imaging Market Forecast: Sales Value (in Million US$), 2022-2027
Figure 63: Indonesia: Structural Heart Imaging Market: Sales Value (in Million US$), 2016 & 2021
Figure 64: Indonesia: Structural Heart Imaging Market Forecast: Sales Value (in Million US$), 2022-2027
Figure 65: Others: Structural Heart Imaging Market: Sales Value (in Million US$), 2016 & 2021
Figure 66: Others: Structural Heart Imaging Market Forecast: Sales Value (in Million US$), 2022-2027
Figure 67: Europe: Structural Heart Imaging Market: Sales Value (in Million US$), 2016 & 2021
Figure 68: Europe: Structural Heart Imaging Market Forecast: Sales Value (in Million US$), 2022-2027
Figure 69: Germany: Structural Heart Imaging Market: Sales Value (in Million US$), 2016 & 2021
Figure 70: Germany: Structural Heart Imaging Market Forecast: Sales Value (in Million US$), 2022-2027
Figure 71: France: Structural Heart Imaging Market: Sales Value (in Million US$), 2016 & 2021
Figure 72: France: Structural Heart Imaging Market Forecast: Sales Value (in Million US$), 2022-2027
Figure 73: United Kingdom: Structural Heart Imaging Market: Sales Value (in Million US$), 2016 & 2021
Figure 74: United Kingdom: Structural Heart Imaging Market Forecast: Sales Value (in Million US$), 2022-2027
Figure 75: Italy: Structural Heart Imaging Market: Sales Value (in Million US$), 2016 & 2021
Figure 76: Italy: Structural Heart Imaging Market Forecast: Sales Value (in Million US$), 2022-2027
Figure 77: Spain: Structural Heart Imaging Market: Sales Value (in Million US$), 2016 & 2021
Figure 78: Spain: Structural Heart Imaging Market Forecast: Sales Value (in Million US$), 2022-2027
Figure 79: Russia: Structural Heart Imaging Market: Sales Value (in Million US$), 2016 & 2021
Figure 80: Russia: Structural Heart Imaging Market Forecast: Sales Value (in Million US$), 2022-2027
Figure 81: Others: Structural Heart Imaging Market: Sales Value (in Million US$), 2016 & 2021
Figure 82: Others: Structural Heart Imaging Market Forecast: Sales Value (in Million US$), 2022-2027
Figure 83: Latin America: Structural Heart Imaging Market: Sales Value (in Million US$), 2016 & 2021
Figure 84: Latin America: Structural Heart Imaging Market Forecast: Sales Value (in Million US$), 2022-2027
Figure 85: Brazil: Structural Heart Imaging Market: Sales Value (in Million US$), 2016 & 2021
Figure 86: Brazil: Structural Heart Imaging Market Forecast: Sales Value (in Million US$), 2022-2027
Figure 87: Mexico: Structural Heart Imaging Market: Sales Value (in Million US$), 2016 & 2021
Figure 88: Mexico: Structural Heart Imaging Market Forecast: Sales Value (in Million US$), 2022-2027
Figure 89: Others: Structural Heart Imaging Market: Sales Value (in Million US$), 2016 & 2021
Figure 90: Others: Structural Heart Imaging Market Forecast: Sales Value (in Million US$), 2022-2027
Figure 91: Middle East and Africa: Structural Heart Imaging Market: Sales Value (in Million US$), 2016 & 2021
Figure 92: Middle East and Africa: Structural Heart Imaging Market: Breakup by Country (in %), 2021
Figure 93: Middle East and Africa: Structural Heart Imaging Market Forecast: Sales Value (in Million US$), 2022-2027
Figure 94: Global: Structural Heart Imaging Industry: SWOT Analysis
Figure 95: Global: Structural Heart Imaging Industry: Value Chain Analysis
Figure 96: Global: Structural Heart Imaging Industry: Porter's Five Forces Analysis
List of Tables
Table 1: Global: Structural Heart Imaging Market: Key Industry Highlights, 2021 and 2027
Table 2: Global: Structural Heart Imaging Market Forecast: Breakup by Imaging Modality (in Million US$), 2022-2027
Table 3: Global: Structural Heart Imaging Market Forecast: Breakup by Procedure Type (in Million US$), 2022-2027
Table 4: Global: Structural Heart Imaging Market Forecast: Breakup by Application (in Million US$), 2022-2027
Table 5: Global: Structural Heart Imaging Market Forecast: Breakup by End User (in Million US$), 2022-2027
Table 6: Global: Structural Heart Imaging Market Forecast: Breakup by Region (in Million US$), 2022-2027
Table 7: Global: Structural Heart Imaging Market: Competitive Structure
Table 8: Global: Structural Heart Imaging Market: Key Players