
Supplements & Nutrition Packaging Market Report by Packaging Type (Primary Packaging, Secondary and Tertiary Packaging), Material (Glass, Plastic, Metal, Paper and Cardboard), Product Form (Tablets, Capsules, Powder, Soft Gels, Liquids), and Region 2026-2034
Supplements & Nutrition Packaging Market Size:
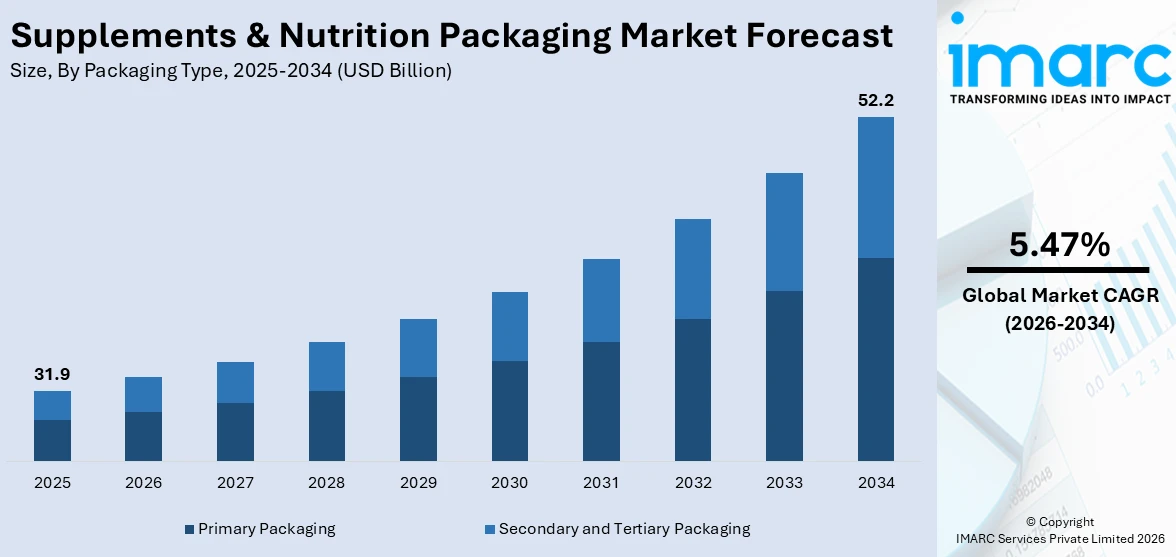
The global supplements & nutrition packaging market size reached USD 31.9 Billion in 2025. Looking forward, IMARC Group expects the market to reach USD 52.2 Billion by 2034, exhibiting a growth rate (CAGR) of 5.47% during 2026-2034. The increasing health and wellness awareness among consumers, a growing emphasis on eco-friendly and sustainable packaging solutions, the rise of e-commerce sector, stringent regulatory standards, advancements in packaging technology, surging interest in sports and fitness, the impact of the COVID-19 pandemic, and the expansion of the personalized nutrition sector are some of the factors bolstering the market growth.
|
Report Attribute
|
Key Statistics
|
|---|---|
|
Base Year
|
2025 |
|
Forecast Years
|
2026-2034
|
|
Historical Years
|
2020-2025
|
| Market Size in 2025 | USD 31.9 Billion |
| Market Forecast in 2034 | USD 52.2 Billion |
| Market Growth Rate (2026-2034) | 5.47% |
Supplements & Nutrition Packaging Market Analysis:
- Market Growth and Size: The global supplements and nutrition packaging market has experienced consistent growth, due to the increasing focus on wellness. Moreover, the rising health consciousness and the growing demand for nutritional supplements globally is increasing the market size.
- Major Market Drivers: The surge in demand for immune-boosting supplements following the COVID-19 pandemic, the increasing preference for personalized nutrition, expansion of the supplements industry into emerging markets, growing consumer interest in plant-based supplements, the need for child-resistant packaging for vitamins and supplements, and adoption of smart packaging solutions to enhance user experience are factors stimulating the market growth.
- Technological Advancements: Ongoing innovations in packaging materials to improve product protection and freshness, utilization of augmented reality (AR) to create interactive packaging experiences, development of biodegradable and compostable packaging options, and advancements in printing techniques for product labels and branding are some of the technological advancements.
- Industry Applications: The supplements and nutrition packaging industry serves a diverse range of applications, including dietary supplements, sports nutrition, vitamins, minerals, and herbal products.
- Key Market Trends: A growing demand for sustainable packaging options driven by consumer eco-consciousness, shift toward minimalist packaging designs aimed at waste reduction, integration of near field communication (NFC) technology for product authentication, and increased use of recycled materials in packaging are some of the key market trends.
- Geographical Trends: North America leads the global market, owing to a health-conscious population and advanced packaging technology infrastructure. Europe closely follows, influenced by sustainability priorities and strict regulatory standards. Emerging markets in Asia-Pacific are experiencing rapid growth, driven by a rising middle class and heightened health and wellness awareness.
- Competitive Landscape: The supplements and nutrition packaging market is highly competitive, with key players investing in research and development (R&D) to introduce innovative packaging solutions. Companies aim to differentiate themselves through sustainability, safety, and convenience features in their packaging offerings.
- Challenges and Opportunities: Challenges include meeting rigorous regulatory requirements, particularly in pharmaceutical-grade packaging. Opportunities arise in the development of sustainable packaging solutions and addressing the increasing demand for personalized nutrition offerings.
To get more information on this market Request Sample
Supplements & Nutrition Packaging Market Trends:
Increasing awareness of health and wellness:
The global supplements and nutrition packaging market is experiencing significant growth due to the increasing awareness of health and wellness among consumers. In recent years, individuals have become more health-conscious, leading to a surge in the demand for dietary supplements and nutritional products. Consumers are seeking solutions to support their overall well-being, and this trend has been a driving force behind the growth of the industry, which emphasizes the importance of packaging in conveying product information, safety, and quality to consumers. Manufacturers are challenged to create packaging that not only protects the product but also effectively communicates its benefits, which has led to innovations in labeling, such as nutritional facts and health claims, to cater to the informed consumer base.
Burgeoning aging population:
The aging population worldwide is a crucial driver shaping the supplements and nutrition packaging market. With an increasing number of elderly individuals, there is a growing demand for specialized supplements that address age-related health concerns, such as joint health or cognitive function., which has led to the development of packaging solutions tailored to the needs of older consumers. Packaging design and functionality play a significant role in ensuring that these products are accessible and easy to use for seniors.
Eco-Friendly and sustainable packaging:
The global trend towards eco-friendly and sustainable practices is influencing the supplements and nutrition packaging market. Consumers are increasingly concerned about the environmental impact of packaging materials, which emphasizes the need for the industry to adopt sustainable packaging solutions, such as recyclable materials and reduced packaging waste. Packaging companies are exploring innovative ways to reduce their carbon footprint, from using biodegradable materials to optimizing packaging design for efficiency. The push for sustainability not only aligns with consumer preferences but also helps companies demonstrate their commitment to environmental responsibility, which can be a competitive advantage in the market.
Rise of e-commerce sector:
The rise of e-commerce has significantly impacted the supplements and nutrition packaging market. As consumers increasingly turn to online shopping for their supplement needs, packaging has to adapt to the unique challenges of this distribution channel. Convenience and durability become paramount, as products need to withstand shipping and handling. Packaging design that minimizes the risk of damage during transit is essential. Additionally, the demand for single-serving or portion-controlled packaging has grown in e-commerce to enhance convenience. Manufacturers are also exploring packaging solutions that offer resealability to maintain product freshness. The e-commerce-driven driver underscores the importance of packaging in ensuring that products reach consumers intact and in optimal condition, making it a pivotal aspect of the industry's growth.
Supplements & Nutrition Packaging Industry Segmentation:
IMARC Group provides an analysis of the key trends in each segment of the market, along with forecasts at the global, regional, and country levels for 2026-2034. Our report has categorized the market based on packaging type, material, and product form.
Breakup by Packaging Type:
- Primary Packaging
- Bottles and Jars
- Tins and Cans
- Stand-Up Pouches
- Blisters and Strips
- Rigid Papers
- Others
- Secondary and Tertiary Packaging
Primary packaging holds the largest share in the industry
The report has provided a detailed breakup and analysis of the market based on the packaging type. This includes primary packaging (bottles and jars, tins and cans, stand-up pouches, blisters and strips, rigid papers, others), and secondary and tertiary packaging. According to the report, primary packaging accounted for the largest market share.
The primary packaging (bottles and jars, tins and cans, stand-up pouches, blisters and strips, rigid papers, others) segment is driven by the increasing demand for product differentiation and protection. As consumer preferences become more diverse, manufacturers are compelled to create packaging solutions that safeguard the product and also enhance its appeal on the retail shelf. Moreover, the growing emphasis on eco-friendly packaging materials and sustainable practices is transforming primary packaging, with a shift towards recyclable and biodegradable options. Additionally, advancements in technology, including tamper-evident seals and smart packaging features, are enhancing product safety and user experience, driving the evolution of primary packaging.
On the other hand, the secondary and tertiary packaging segment is primarily influenced by the need for efficient logistics and supply chain management. The rising trend of e-commerce and global trade has heightened the importance of secondary and tertiary packaging, leading to innovations in protective and cost-effective solutions. Companies are focusing on optimizing packaging designs to reduce shipping costs and minimize environmental impact, aligning with sustainability goals.
Breakup by Material:
Access the comprehensive market breakdown Request Sample
- Glass
- Plastic
- PET
- HDPE
- PP
- Others
- Metal
- Paper and Cardboard
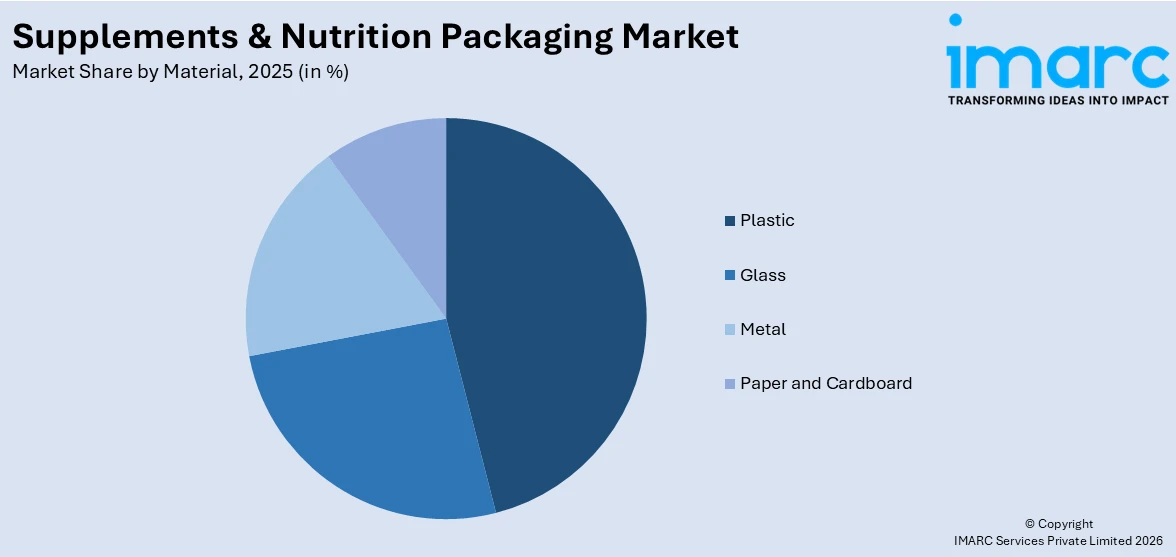
Plastic holds the largest share in the industry
A detailed breakup and analysis of the market based on the material have also been provided in the report. This includes glass, plastic (PET, HDPE, PP, others), metal, paper and cardboard. According to the report, plastic accounted for the largest market share.
The plastic (PET, HDPE, PP, others) segment is driven by the increasing need for lightweight, cost-effective, and versatile packaging solutions. Plastic's adaptability allows for a wide range of applications across various industries, from food and beverages (F&B) to pharmaceuticals and personal care products. Its lightweight nature reduces transportation costs and carbon emissions, aligning with sustainability goals. Plastic packaging also offers convenience, with features like resealability and portability. Moreover, its ability to be molded into various shapes and sizes enhances its functionality, making it suitable for both single-serving products and bulk packaging.
The glass segment is driven by the increasing consumer demand for sustainable and eco-friendly packaging solutions. Glass is a preferred choice for many consumers due to its recyclability and minimal environmental impact. Additionally, the glass segment benefits from the growing awareness of health and safety concerns, as glass packaging is considered non-reactive and preserves the purity and freshness of F&B.
The metal segment is driven by its exceptional durability, protection properties, and recyclability. Metals, such as aluminum and steel, are ideal for packaging products that require long shelf life, such as canned foods and beverages. The barrier properties of metal prevent contamination and maintain product integrity. The recyclability of metal packaging reduces the environmental footprint, making it an environmentally responsible choice. The metal segment also benefits from innovations like easy-open lids and tamper-evident seals, ensuring product safety and consumer confidence.
The paper and cardboard segment is driven by the increasing focus on sustainability and eco-friendliness. They are highly renewable and biodegradable, making them environmentally responsible choices. The rise of e-commerce has led to a surge in demand for corrugated cardboard packaging, which offers excellent protection during shipping and is easily recyclable.
Furthermore, the paper and cardboard segment is driven by their versatility, making them suitable for a wide range of products, from F&B packaging to pharmaceutical cartons. Technological advancements have led to improvements in printing and finishing techniques, allowing for attractive and informative packaging designs. The paper and cardboard segment also align with the consumer preference for minimalist and recyclable packaging, making it a vital player in the packaging industry's sustainable future.
Breakup by Product Form:
- Tablets
- Capsules
- Powder
- Soft Gels
- Liquids
Powder represents the leading market segment
The report has provided a detailed breakup and analysis of the market based on the product form. This includes tablets, capsules, powder, soft gels, and liquids. According to the report, powder accounted for the largest market share.
The powder segment is leading the market due to its versatility and adaptability in various applications. Powdered supplements, including protein powders, meal replacements, and powdered vitamins, offer easy mixing with liquids and can be incorporated into a wide range of dietary routines. The segment is further propelled by the preference for customizable dosages, as consumers can adjust the amount of powder they use. Additionally, the rise of fitness and wellness trends, along with the demand for convenience, contributes to the continued growth of the powder segment in the supplements and nutrition market.
The tablets segment is driven by the increasing consumer preference for convenience and portability in taking supplements and medications. Tablets offer a compact and easy-to-carry dosage form, making them a popular choice among consumers. Additionally, advancements in tablet manufacturing technology, such as controlled-release formulations and taste-masking techniques, have expanded their applications in various therapeutic areas.
The capsules segment is driven by the growing demand for customizable and targeted delivery of supplements and medications. Capsules offer versatility in formulation, enabling the encapsulation of various ingredients, including powders, liquids, and oils, in a single dose, which allows for the creation of specialized formulations, such as time-release capsules, dual-action capsules, and personalized nutrient combinations.
The soft gels segment is driven by its efficacy, bioavailability, and consumer-friendly attributes. Soft gelatin capsules are known for their enhanced absorption rates compared to some other dosage forms, making them a preferred choice for fat-soluble vitamins, essential oils, and botanical extracts. The segment benefits from the expanding market for specialized supplements like omega-3 fatty acids and herbal extracts, where soft gels are a common delivery format.
The liquids segment is driven by its immediate bioavailability and suitability for certain therapeutic needs. Liquid supplements offer rapid absorption, making them ideal for individuals who require quick results or have difficulty swallowing pills. It is particularly favored for pediatric and geriatric populations, as it provides a user-friendly option for those with specific dietary or medical requirements.
Breakup by Region:
- North America
- United States
- Canada
- Asia Pacific
- China
- Japan
- India
- South Korea
- Australia
- Indonesia
- Others
- Europe
- Germany
- France
- United Kingdom
- Italy
- Spain
- Russia
- Others
- Latin America
- Brazil
- Mexico
- Others
- Middle East and Africa
Asia Pacific leads the market, accounting for the largest supplements & nutrition packaging market share
The market research report has also provided a comprehensive analysis of all the major regional markets, which include North America (the United States and Canada); Asia Pacific (China, Japan, India, South Korea, Australia, Indonesia, and others); Europe (Germany, France, the United Kingdom, Italy, Spain, Russia, and others); Latin America (Brazil, Mexico, and others); and the Middle East and Africa. According to the report, Asia Pacific accounted for the largest market share.
Asia-Pacific supplements and nutrition packaging market experiences growth due to rapid urbanization, industrialization, and the rise of the middle-class population, which are contributing to increased disposable incomes and a growing focus on health and wellness. Notably, countries like China and India are experiencing exponential growth in the supplements sector. Sustainability is a key driver, with the adoption of eco-friendly packaging materials and practices aligning with global environmental concerns. Child-resistant packaging solutions are also gaining relevance in the region, ensuring the safety of products.
In North America, a growing awareness of health and wellness is spurring the demand for supplements and nutrition products. Moreover, online sales growth necessitates durable e-commerce packaging, and smart packaging enhances safety. The flourishing sports and fitness industry fuels related supplements and packaging demand. Strict regulations promote safety and quality, and innovations in tamper-evident and child-resistant packaging cater to evolving needs.
In Europe, the supplements and nutrition packaging market is thriving due to a similar increase in health consciousness among consumers. The emphasis on sustainability and eco-friendly practices is a shared driver with North America. Biodegradable and compostable packaging materials are gaining traction in Europe, aligning with the region's commitment to environmental responsibility. Minimalist and recyclable packaging designs are on the rise, reflecting European consumers' preference for eco-conscious choices.
In Latin America, the supplements and nutrition packaging market is driven by the growing awareness of health and wellness. As consumers become more health-conscious, the demand for dietary supplements and nutritional products is on the rise. The region's diverse geography and climates contribute to a wide variety of local ingredients and nutritional offerings.
The Middle East and Africa region are experiencing growth in the supplements and nutrition packaging market, primarily due to an increasing awareness of health and wellness among consumers. The region's expanding population, rising incomes, and lifestyle changes are driving the demand for dietary supplements and nutritional products.
Leading Key Players in the Supplements & Nutrition Packaging Industry:
The key players in the supplements and nutrition packaging market are actively engaged in various strategic initiatives to maintain their competitiveness and meet evolving consumer demands. They are investing heavily in research and development (R&D) to innovate and introduce packaging solutions that align with emerging trends, such as sustainability and smart packaging. They are also focusing on eco-friendly materials to address environmental concerns, aiming to reduce their carbon footprint. Additionally, many major players are expanding their global presence through acquisitions and partnerships, seeking to tap into new markets and strengthen their supply chains. Compliance with stringent regulatory standards remains a priority, with ongoing efforts to ensure product safety and quality. Furthermore, companies are leveraging advanced technologies like blockchain and augmented reality (AR) to enhance packaging functionality, improve consumer engagement, and provide greater transparency in the supply chain.
The market research report has provided a comprehensive analysis of the competitive landscape. Detailed profiles of all major companies have also been provided. Some of the key players in the market include:
- Alpha Packaging Holdings Inc.
- Arizona Nutritional Supplements LLC
- Comar LLC
- Container and Packaging Supply Inc.
- ePac Holdings LLC
- Gerresheimer AG
- Glenroy Inc.
- Graham Packaging Company Inc.
- Law Print & Packaging Management Ltd.
- Moulded Packaging Solutions Limited
- OPM (Labels and Packaging) Group Ltd.
- ParkAcre Limited
(Please note that this is only a partial list of the key players, and the complete list is provided in the report.)
Latest News:
- In August 2021: Alpha Packaging announced a significant expansion of its manufacturing capacity by acquiring a new blow molding plant in Salt Lake City, Utah. This strategic move aimed to meet the growing demand for sustainable packaging solutions in the supplements and nutrition industry.
- In May 2021: Arizona Nutritional Supplements announced a partnership with a leading raw materials supplier to ensure a consistent and high-quality supply chain for its nutritional products.
- In March 2021: Comar expanded its product portfolio by introducing a range of child-resistant packaging solutions specifically designed for the nutraceutical and dietary supplement industry. This move addressed the growing regulatory requirements for child safety in packaging.
Supplements & Nutrition Packaging Market Report Scope:
| Report Features | Details |
|---|---|
| Base Year of the Analysis | 2025 |
| Historical Period | 2020-2025 |
| Forecast Period | 2026-2034 |
| Units | Billion USD |
| Scope of the Report | Exploration of Historical Trends and Market Outlook, Industry Catalysts and Challenges, Segment-Wise Historical and Future Market Assessment:
|
| Packaging Types Covered |
|
| Materials Covered |
|
| Product Forms Covered | Tablets, Capsules, Powder, Soft Gels, Liquids |
| Regions Covered | Asia Pacific, Europe, North America, Latin America, Middle East and Africa |
| Countries Covered | United States, Canada, Germany, France, United Kingdom, Italy, Spain, Russia, China, Japan, India, South Korea, Australia, Indonesia, Brazil, Mexico |
| Companies Covered | Alpha Packaging Holdings Inc., Arizona Nutritional Supplements LLC, Comar LLC., Container and Packaging Supply Inc., ePac Holdings LLC, Gerresheimer AG, Glenroy Inc., Graham Packaging Company Inc., Law Print & Packaging Management Ltd., Moulded Packaging Solutions Limited., OPM (Labels and Packaging) Group Ltd., ParkAcre Limited, etc. |
| Customization Scope | 10% Free Customization |
| Post-Sale Analyst Support | 10-12 Weeks |
| Delivery Format | PDF and Excel through Email (We can also provide the editable version of the report in PPT/Word format on special request) |
Key Questions Answered in This Report:
- How has the global supplements & nutrition packaging market performed so far, and how will it perform in the coming years?
- What are the drivers, restraints, and opportunities in the global supplements & nutrition packaging market?
- What is the impact of each driver, restraint, and opportunity on the global supplements & nutrition packaging market?
- What are the key regional markets?
- Which countries represent the most attractive supplements & nutrition packaging market?
- What is the breakup of the market based on the packaging type?
- Which is the most attractive packaging type in the supplements & nutrition packaging market?
- What is the breakup of the market based on the material?
- Which is the most attractive material in the supplements & nutrition packaging market?
- What is the breakup of the market based on product form?
- Which is the most attractive product form in the supplements & nutrition packaging market?
- What is the competitive structure of the market?
- Who are the key players/companies in the global supplements & nutrition packaging market?
Key Benefits for Stakeholders:
- IMARC’s industry report offers a comprehensive quantitative analysis of various market segments, historical and current market trends, market forecasts, and dynamics of the supplements & nutrition packaging market from 2020-2034.
- The research report provides the latest information on the market drivers, challenges, and opportunities in the global supplements & nutrition packaging market.
- The study maps the leading, as well as the fastest-growing, regional markets. It further enables stakeholders to identify the key country-level markets within each region.
- Porter's five forces analysis assists stakeholders in assessing the impact of new entrants, competitive rivalry, supplier power, buyer power, and the threat of substitution. It helps stakeholders to analyze the level of competition within the supplements & nutrition packaging industry and its attractiveness.
- The competitive landscape allows stakeholders to understand their competitive environment and provides insight into the current positions of key players in the market.
Need more help?
- Speak to our experienced analysts for insights on the current market scenarios.
- Include additional segments and countries to customize the report as per your requirement.
- Gain an unparalleled competitive advantage in your domain by understanding how to utilize the report and positively impacting your operations and revenue.
- For further assistance, please connect with our analysts.
 Request Customization
 Speak to an Analyst
 Request Brochure
 Inquire Before Buying
Benefits of Customization
- Personalize this research
- Triangulate with your data
- Get data as per your format and definition
- Gain a deeper dive into a specific application, geography, customer, or competitor
- Any level of personalization
Get in Touch With Us
UNITED STATES
Phone: +1-201-971-6302
INDIA
Phone: +91-120-433-0800
UNITED KINGDOM
Phone: +44-753-714-6104
Email: [email protected]
Client Testimonials


.webp)


