
Table Olives Market Report by Ripening Stage (Green Olives, Olives Turning Color, Black Olives), Olives Style (Whole, Stoned (Pitted), Stuffed, Salad, With Capers, Paste and Tapenade), Processing Type (Treated, Natural, Dehydrated, Darkened by Oxidation, Specialties, and Others), Distribution Channel (Supermarkets and Hypermarkets, Convenience Stores, E-commerce, Specialty Stores, and Others), Price (Premium, Standard), and Region 2026-2034
Market Overview:
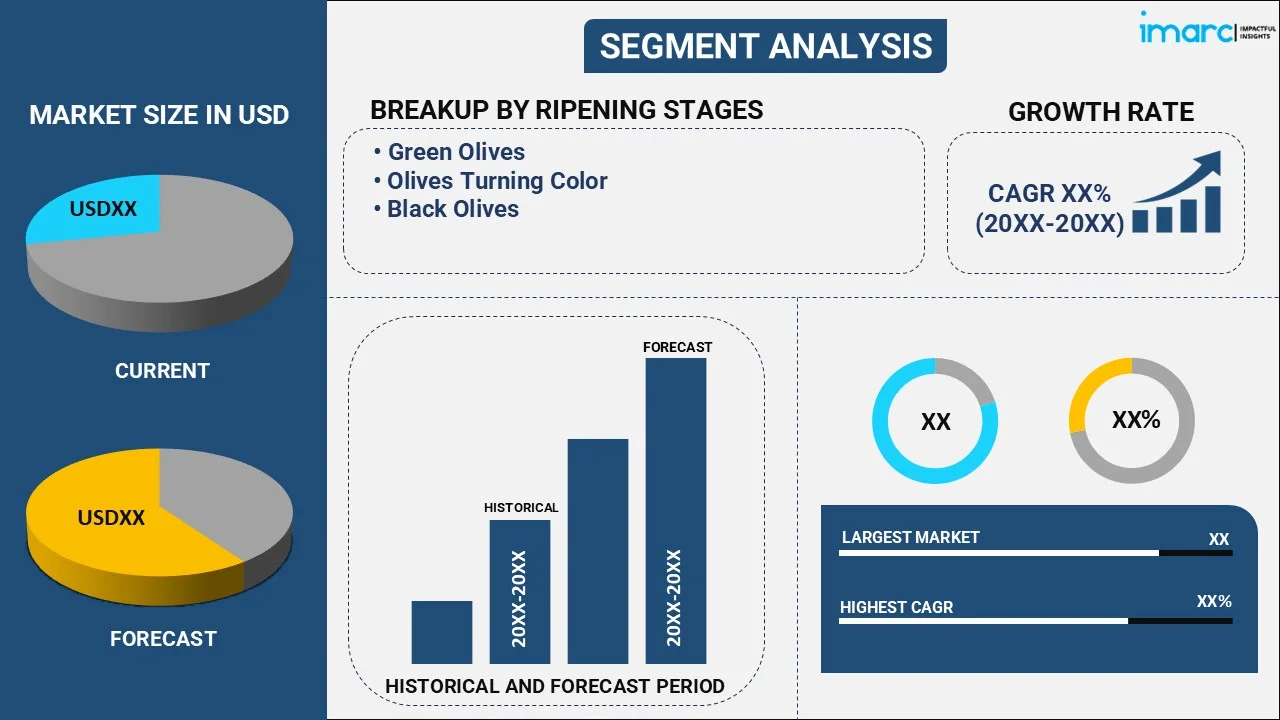
The global table olives market size reached USD 4.5 Million in 2025. Looking forward, IMARC Group expects the market to reach USD 5.9 Million by 2034, exhibiting a growth rate (CAGR) of 2.97% during 2026-2034. The increasing influence of social media promoting olive consumption, the rising product incorporation in functional foods and beverages, and the expansion of e-commerce platforms across the globe are some of the factors propelling the market.
|
Report Attribute
|
Key Statistics
|
|---|---|
|
Base Year
|
2025
|
|
Forecast Years
|
2026-2034
|
|
Historical Years
|
2020-2025
|
|
Market Size in 2025
|
USD 4.5 Million |
|
Market Forecast in 2034
|
USD 5.9 Million |
| Market Growth Rate 2026-2034 | 2.97% |
Table olives are a popular and ancient delicacy enjoyed worldwide. These small, oval-shaped fruits are harvested from olive trees and cured to reduce their natural bitterness. Typically served as appetizers or in salads, table olives come in various varieties like green, black, and red, each boasting unique flavors and textures. Curing involves brining, dry salting, or lye treatment to enhance taste and extend shelf life. Rich in healthy monounsaturated fats and antioxidants, table olives offer numerous health benefits while adding a burst of Mediterranean flair to any dish.

To get more information on this market Request Sample
The global market is majorly driven by the increasing consumer awareness of the health benefits of olives and olive products. In line with this, the rising interest in Mediterranean cuisine and flavors is significantly contributing to the market. Furthermore, the expanding popularity of plant-based diets and vegetarian/vegan lifestyles is positively influencing the market. Apart from this, the growing demand for natural and healthier food options is catalyzing the product demand. Moreover, the innovations in olive processing techniques and packaging are offering numerous opportunities for the market. Besides, the expanding food service industry and olive inclusion in diverse dishes are propelling the market. Additionally, the expansion of international trade and global supply chains is bolstering the market.
Table Olives Market Trends/Drivers:
Favorable climate conditions in olive-producing regions
Favorable climate conditions in olive-producing regions create a positive market outlook. Olive trees thrive in specific climates, typically characterized by mild winters, hot and dry summers, and well-defined seasons. The Mediterranean region is renowned for its ideal olive-growing climate. The right temperature, rainfall, and sunlight balance in these regions promotes healthy olive tree growth, resulting in abundant fruit production and high-quality olives. Consistent and favorable weather conditions also contribute to the natural curing process, essential for enhancing the olives' flavor and texture. Furthermore, the stable climate allows for consistent yields year after year, ensuring a steady supply of table olives to meet the increasing demand. Olive producers in these regions can also cultivate different olive varieties, offering consumers a diverse range of flavors and options worldwide.
Development of new product varieties
The development of new product varieties is fostering the market. Researchers and olive growers have created cultivars with enhanced flavors and increased productivity through innovative breeding and biotechnological advancements. Improved taste profiles ensure that consumers can access olives with superior sensory characteristics, catering to diverse palates and culinary preferences. This has led to a broader consumer base and higher product demand globally. Furthermore, the development of high-yielding olive varieties has revolutionized the olive industry. These new cultivars produce larger quantities of olives per tree, increasing production efficiency and profitability for olive growers. Higher yields also help to meet the rising demand for table olives in the market, particularly as the popularity of Mediterranean cuisine and healthy eating continues to grow. The continuous pursuit of creating superior olive varieties will likely lead to even more enticing options for consumers, further bolstering the market.
Increasing product use in beauty and personal care products
The increasing use of table olives in beauty and personal care products has become a notable trend. Olive oil and extracts are rich in beneficial compounds like antioxidants, vitamins, and fatty acids, making them valuable ingredients in skincare and haircare formulations. Olive oil's emollient properties help moisturize and nourish the skin, promoting a radiant, healthy complexion. It is often used in creams, lotions, soaps, and body oils. Olive extracts are also incorporated into anti-aging products because they combat free radicals and support skin elasticity. In hair care, olive oil is popular for conditioning treatments and hair masks. It can add shine, softness, and manageability to dry and damaged hair. The natural components of olives are gentle and suitable for various skin and hair types, making them sought-after ingredients in the beauty industry. As consumers become more conscious of natural and sustainable beauty solutions, the use of olives in cosmetic products is likely to expand, further catalyzing the market growth and offering additional revenue streams for olive producers.
Table Olives Industry Segmentation:
IMARC Group provides an analysis of the key trends in each segment of the global table olives market report, along with forecasts at the global, regional and country levels from 2026-2034. Our report has categorized the market based on ripening stage, olives style, processing type, distribution channel and price.
Breakup by Ripening Stage:
To get detailed segment analysis of this market Request Sample
- Green Olives
- Olives Turning Color
- Black Olives
Green olives dominates the market
The report has provided a detailed breakup and analysis of the market based on the ripening stage. This includes green olives, olives turning color, and black olives. According to the report, green olives represented the largest segment.
Green olives hold a dominant position in the market, primarily due to their high oil content and vulnerability to bruising in this early stage of maturity. The higher oil content in green olives contributes to their distinct flavor profile, making them a preferred choice for consumers seeking a tangy and slightly bitter taste. Additionally, the delicate nature of green olives during the initial ripening phase makes them more susceptible to bruising. This characteristic requires careful handling and processing, which can add value to their exclusivity in the market.
Green olives are often favored for their firm texture, perfect for stuffing with various ingredients like cheese, garlic, or peppers. Their versatility in culinary applications, from salads to tapenades, has further contributed to their market dominance. While other olive varieties, such as black and red, have a unique appeal, green olives' oil content and delicate nature have solidified their position as the leading choice for consumers and culinary enthusiasts.
Breakup by Olives Style:
- Whole
- Stoned (Pitted)
- Stuffed
- Salad
- With Capers
- Paste and Tapenade
Stoned (Pitted) holds the largest share of the market
A detailed breakup and analysis of the market based on olives style have also been provided in the report. This includes whole, stoned (pitted), stuffed, salad, with capers, and paste and tapenade. According to the report, stoned (pitted) accounted for the largest market share.
Stoned (pitted) olives have emerged as the dominant choice in the market due to their versatile and practical appeal. Removing pits from olives helps retain their shape and appearance, making them ideal for stuffing with various ingredients, such as cheese, garlic, almonds, or peppers. This feature enhances the overall culinary experience, as consumers can enjoy a seamless and hassle-free dining experience without the inconvenience of dealing with pits.
Moreover, stoned olives offer convenience in cooking, allowing chefs and home cooks to effortlessly incorporate them into a wide array of dishes, from salads to pasta, without additional preparation. Their versatility has made them popular in both professional kitchens and households. Stoned olives have gained widespread acceptance by addressing the inconvenience of pits while preserving the olives' flavor and texture.
Breakup by Processing Type:
- Treated
- Natural
- Dehydrated
- Darkened by Oxidation
- Specialties
- Others
Treated holds the largest share of the market
A detailed breakup and analysis of the market based on the processing type have also been provided in the report. This includes treated, natural, dehydrated, darkened by oxidation, specialties, and others. According to the report, treated accounted for the largest market share.
Treated table olives currently hold the leading position in the market due to their wide availability, diverse flavors, and extended shelf life. The curing process, which involves various treatments like brining, dry salting, or lye treatment, is crucial in reducing the natural bitterness of olives and enhancing their taste and texture. This treatment allows an extensive range of flavors to cater to consumer preferences, further boosting their popularity.
Additionally, treated table olives have a longer shelf life than fresh ones, making them a convenient option for consumers and retailers. Their extended storage capability enables widespread distribution and availability throughout the year, contributing to their market dominance. Furthermore, treated olives are commonly used in the food service industry and incorporated into numerous dishes and appetizers.
Breakup by Distribution Channel:
- Supermarkets and Hypermarkets
- Convenience Stores
- E-commerce
- Specialty Stores
- Others
Supermarkets and hypermarkets hold the largest share of the market
A detailed breakup and analysis of the market based on the distribution channel have also been provided in the report. This includes supermarkets and hypermarkets, convenience stores, e-commerce, specialty stores, and others. According to the report, supermarkets and hypermarkets accounted for the largest market share.
Supermarkets and hypermarkets have captured the majority of the total market share in the table olives industry due to their ability to offer consumers a wide and diverse collection of products. These large retail outlets provide a one-stop shopping experience, giving customers access to an extensive selection of table olive varieties, flavors, and brands under one roof. The vast shelf space and well-organized displays in supermarkets and hypermarkets allow different olive brands to showcase their products effectively, attracting the attention of potential buyers. This visibility plays a significant role in influencing consumer purchasing decisions.
Moreover, convenience is crucial in driving customers to these retail giants. Shoppers appreciate the ease of finding various table olive options alongside other grocery items, making their shopping experience more efficient and satisfying. The marketing and promotional efforts employed by supermarkets and hypermarkets further contribute to their market share dominance, as they often offer attractive deals and discounts on table olives, enticing consumers to make purchases.
Breakup by Price:
- Premium
- Standard
Standard holds the largest share of the market
A detailed breakup and analysis of the market based on the price have also been provided in the report. This includes premium and standard. According to the report, standard accounted for the largest market share.
The dominance of the standard price of table olives in the market can be attributed to its widespread appeal and affordability to a broad range of consumers. Standard-priced table olives balance quality and cost, making them an attractive choice for budget-conscious shoppers seeking value for their money. For consumers, the standard price represents a reasonable compromise between premium and budget options, ensuring they can enjoy table olives' taste and health benefits without overspending. This affordability has helped standard-priced table olives gain popularity among households, restaurants, and food service establishments across the globe.
Breakup by Region:
.webp)
To get more information on the regional analysis of this market Request Sample
- Europe
- Germany
- Greece
- Italy
- Spain
- France
- United Kingdom
- Portugal
- Others
- North America
- United States
- Canada
- Asia Pacific
- China
- Japan
- India
- Australia
- Others
- Latin America
- Brazil
- Mexico
- Peru
- Argentina
- Others
- Middle East and Africa
- Algeria
- Egypt
- Turkey
- Iran
- Morocco
- Others
Europe exhibits a clear dominance, accounting for the largest table olives market share
The report has also provided a comprehensive analysis of all the major regional markets, which include Europe (Germany, Greece, Italy, Spain, France, United Kingdom, Portugal, and Others), North America (United States and Canada), Asia Pacific (China, Japan, India, Australia, and Others), Latin America (Brazil, Mexico, Peru, Argentina, and Others), and the Middle East and Africa (Algeria, Egypt, Turkey, Iran, Morocco, and Others). According to the report, Europe accounted for the largest market share.
The dominance of Europe in the global market can be attributed to its status as one of the largest producers of table olives worldwide. The Mediterranean region is known for its long-standing olive cultivation and production tradition. The European countries boast ideal climatic conditions and a rich heritage of olive farming, contributing to consistently high yields and top-quality olives. Their expertise in olive cultivation and processing techniques has allowed them to meet the ever-increasing demand for domestic and international product.
Furthermore, Europe's history of olive consumption and integration of olives into traditional Mediterranean cuisine has played a pivotal role in driving the global market. The popularity of Mediterranean flavors and the perception of olives as a healthy and gourmet food choice have further expanded the market. As a result, Europe's strong foothold in olive production and its cultural association with olives have propelled the continent to hold the majority of the global table olives market share.
Competitive Landscape:
Top table olives companies are employing various strategies to strengthen the market and maintain their competitive edge in the industry. These companies are expanding their range of table olive varieties, catering to different tastes and preferences, thus attracting a broader customer base. They are developing new and unique olive products, such as flavored olives, stuffed olives, or ready-to-eat olive snacks, to entice consumers and stay ahead of the market. These companies are emphasizing eco-friendly cultivation and processing methods to appeal to environmentally conscious consumers and ensure long-term viability in the market. Furthermore, they are actively seeking opportunities to enter new international markets, leveraging the rising demand for Mediterranean and healthy foods worldwide. Moreover, they are collaborating with retailers, food service providers, and beauty and personal care companies to increase product visibility and accessibility. The top companies are investing in robust marketing campaigns, highlighting the health benefits, quality, and versatility of these olives to create brand recognition and consumer loyalty. They are also investing in R&D to improve olive cultivation techniques, develop disease-resistant olive varieties, and enhance production efficiency.
The report has provided a comprehensive analysis of the competitive landscape in the table olives market. Detailed profiles of all major companies have also been provided.
- Two Brothers Organic Farms
- Adamakis Olives
- Servicentral Agrosevilla SL
- Bell-Carter Foods, LLC.
- Eugene Brunel
- Aceituna Verde SL
- Mantziolive Hellas
- Olive Line International, S.L.
- OliveOilsLand
- OLIVES ESCAMILLA
Recent Developments:
- Two Brothers Organic Farms obtained a funding of INR 14.5 Crores in Pre-series A in April 2023, which will be used towards expanding the company’s manufacturing capacity, constructing farmer training centers and broadening its domestic and international business.
- Aceitunas Guadalquivir (AG Olives), a premier olive companies and recognized industry leader in technology, announced the acquisition of Bell-Carter Foods, LLC in 2022 to spur growth in the US market and strengthen grower contracts.
Table Olives Market Report Scope:
| Report Features | Details |
|---|---|
| Base Year of the Analysis | 2025 |
| Historical Period | 2020-2025 |
| Forecast Period | 2026-2034 |
| Units | Million USD |
| Scope of the Report | Exploration of Historical and Forecast Trends, Industry Catalysts and Challenges, Segment-Wise Historical and Predictive Market Assessment:
|
| Ripening Stages Covered | Green Olives, Olives Turning Color, Black Olives |
| Olives Styles Covered | Whole, Stoned (Pitted), Stuffed, Salad, With Capers, Paste and Tapenade |
| Processing Types Covered | Treated, Natural, Dehydrated, Darkened by Oxidation, Specialties, Others |
| Distribution Channels Covered | Supermarkets and Hypermarkets, Convenience Stores, E-commerce, Specialty Stores, Others |
| Prices Covered | Premium, Standard |
| Regions Covered | Asia Pacific, Europe, North America, Latin America, Middle East and Africa |
| Countries Covered | United States, Canada, Germany, France, United Kingdom, Italy, Spain, Greece, Portugal, China, Japan, India, Australia, Brazil, Mexico, Peru, Argentina, Algeria, Egypt, Turkey, Iran, Morocco |
| Companies Covered | Two Brothers Organic Farms, Adamakis Olives, Servicentral Agrosevilla SL, Bell-Carter Foods, LLC., Eugene Brunel, Aceituna Verde SL, Mantziolive Hellas, Olive Line International, S.L., OliveOilsLand, OLIVES ESCAMILLA, etc. |
| Customization Scope | 10% Free Customization |
| Post-Sale Analyst Support | 10-12 Weeks |
| Delivery Format | PDF and Excel through Email (We can also provide the editable version of the report in PPT/Word format on special request) |
Key Benefits for Stakeholders:
- IMARC’s report offers a comprehensive quantitative analysis of various market segments, historical and current market trends, market forecasts, and dynamics of the table olives market from 2020-2034.
- The research study provides the latest information on the market drivers, challenges, and opportunities in the global table olives market.
- The study maps the leading, as well as the fastest-growing, regional markets. It further enables stakeholders to identify the key country-level markets within each region.
- Porter's five forces analysis assists stakeholders in assessing the impact of new entrants, competitive rivalry, supplier power, buyer power, and the threat of substitution. It helps stakeholders to analyze the level of competition within the table olives industry and its attractiveness.
- Competitive landscape allows stakeholders to understand their competitive environment and provides an insight into the current positions of key players in the market.
Frequently Asked Questions About the Table Olives Market Report
The table olives market was valued at USD 4.5 Million in 2025.
The table olives market is projected to exhibit a CAGR of 2.97% during 2026-2034, reaching a value of USD 5.9 Million by 2034.
The market is benefiting from the growing use of olives in ready-to-eat (RTE) meals, salads, pizzas, and gourmet dishes. Urbanization and changing lifestyles are further leading to greater consumption of convenient and packaged food products, including table olives. In addition, innovations in packaging, such as resealable containers and vacuum pouches, enhance product shelf life and appeal.
Europe currently dominates the table olives market due to its long-standing olive cultivation tradition, favorable climate, and strong consumer demand. Countries like Spain, Italy, and Greece are producing and exporting large volumes. Additionally, widespread use of table olives in European diets is fueling the market growth.
Some of the major players in the table olives market include Two Brothers Organic Farms, Adamakis Olives, Servicentral Agrosevilla SL, Bell-Carter Foods, LLC., Eugene Brunel, Aceituna Verde SL, Mantziolive Hellas, Olive Line International, S.L., OliveOilsLand, OLIVES ESCAMILLA, etc.
Need more help?
- Speak to our experienced analysts for insights on the current market scenarios.
- Include additional segments and countries to customize the report as per your requirement.
- Gain an unparalleled competitive advantage in your domain by understanding how to utilize the report and positively impacting your operations and revenue.
- For further assistance, please connect with our analysts.
 Request Customization
 Speak to an Analyst
 Request Brochure
 Inquire Before Buying
Benefits of Customization
- Personalize this research
- Triangulate with your data
- Get data as per your format and definition
- Gain a deeper dive into a specific application, geography, customer, or competitor
- Any level of personalization
Get in Touch With Us
UNITED STATES
Phone: +1-201-971-6302
INDIA
Phone: +91-120-433-0800
UNITED KINGDOM
Phone: +44-753-714-6104
Email: [email protected]
Client Testimonials


.webp)


