
Theranostics Market Report by Disease Type (Neurological Disorders, Cardiovascular Diseases, Immunological Disorders, Oncology Diseases, and Others), Technology (Polymerase Chain Reaction, Immunohistochemistry, In-Situ Hybridization, Sequencing, and Others), End User (Hospitals and Clinics, Diagnostic Laboratories, and Others), and Region 2026-2034
Market Overview:
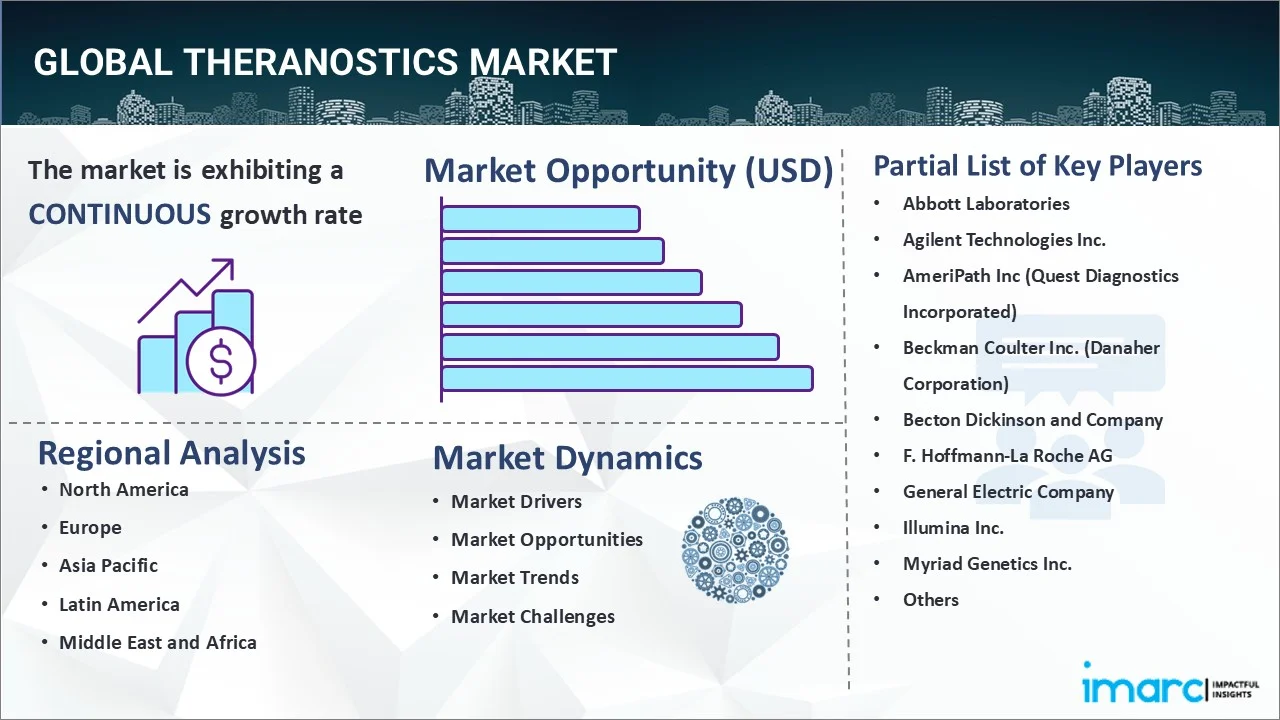
The global theranostics market size reached USD 2.6 Billion in 2025. Looking forward, IMARC Group expects the market to reach USD 10.2 Billion by 2034, exhibiting a growth rate (CAGR) of 15.75% during 2026-2034.
|
Report Attribute
|
Key Statistics
|
|---|---|
|
Base Year
|
2025 |
|
Forecast Years
|
2026-2034
|
|
Historical Years
|
2020-2025
|
| Market Size in 2025 | USD 2.6 Billion |
| Market Forecast in 2034 | USD 10.2 Billion |
| Market Growth Rate (2026-2034) | 15.75% |
Theranostics is a combination of various radioactive drugs and techniques used to diagnose, deliver therapy, and treat life-threatening illnesses. It is cost-effective and involves pharmacogenetics, proteomics, and biomarker profiling. It can be integrated with nanomedicine to target specific organs and tissues and improve patient-specific outcomes. Nowadays, researchers worldwide are developing new diagnostic and therapeutic agents for theranostics to personalize the treatment of cancer, reduce side effects of treatment, and improve the quality care of pharmacotherapy.
To get more information on this market Request Sample
The rising prevalence of cancer due to the increasing consumption of tobacco and alcohol, high body mass index (BMI), low nutrition intake, and lack of physical activity represents one of the main factors stimulating the market growth. Moreover, according to the World Health Organization (WHO), cancer is the second leading cause of death globally, out of which 70% of deaths occur in low and middle-income countries. This is encouraging health and governing agencies of several countries to increase awareness about the available medical treatments and improve the healthcare infrastructure, which is positively influencing the market growth. The escalating demand for personalized medicine is also bolstering the market growth. Apart from this, the integration of seamless, multiple imaging treatment technologies within a single nanoparticle to tackle pathologies is driving the market. Furthermore, the increasing approvals to produce theranostics and rising investments in research and development (R&D) activities are other factors anticipated to propel the growth of the market in the coming years.
Key Market Segmentation:
IMARC Group provides an analysis of the key trends in each sub-segment of the global theranostics market report, along with forecasts at the global, regional and country level from 2026-2034. Our report has categorized the market based on disease type, technology and end user.
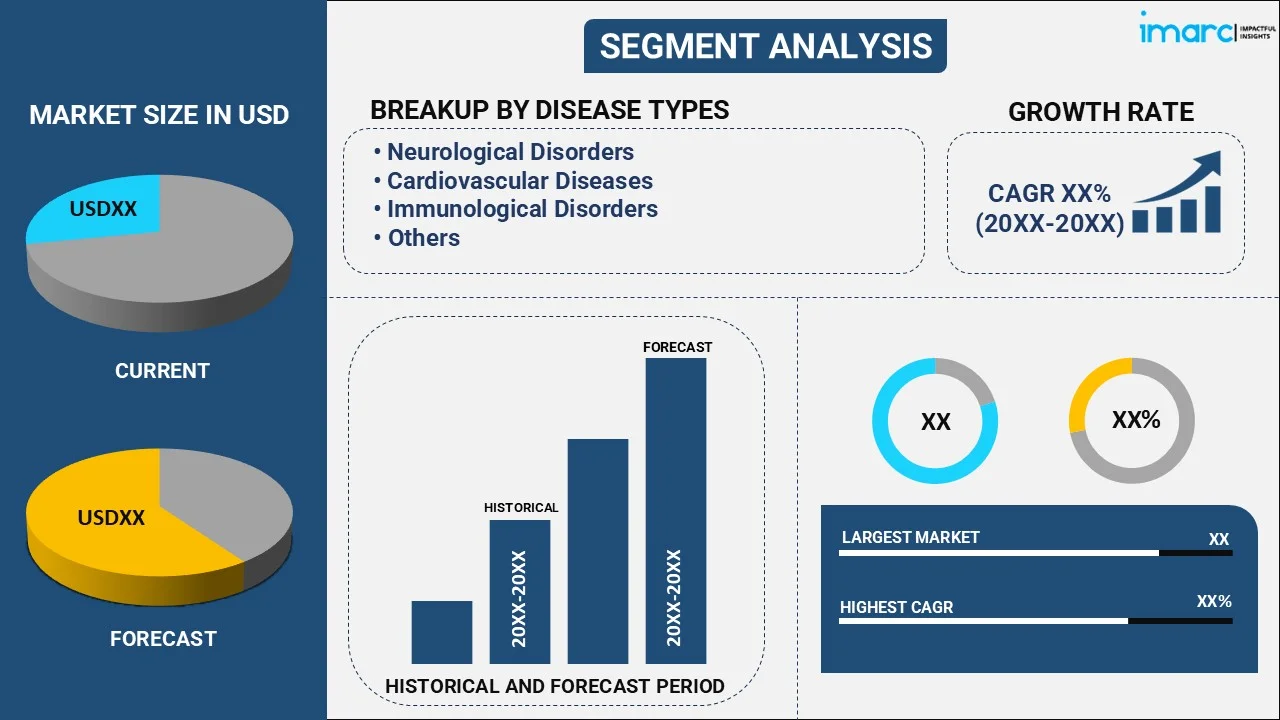
Breakup by Disease Type:
To get detailed segment analysis of this market Request Sample
- Neurological Disorders
- Cardiovascular Diseases
- Immunological Disorders
- Oncology Diseases
- Others
Breakup by Technology:
- Polymerase Chain Reaction
- Immunohistochemistry
- In-Situ Hybridization
- Sequencing
- Others
Breakup by End User:
- Hospitals and Clinics
- Diagnostic Laboratories
- Others
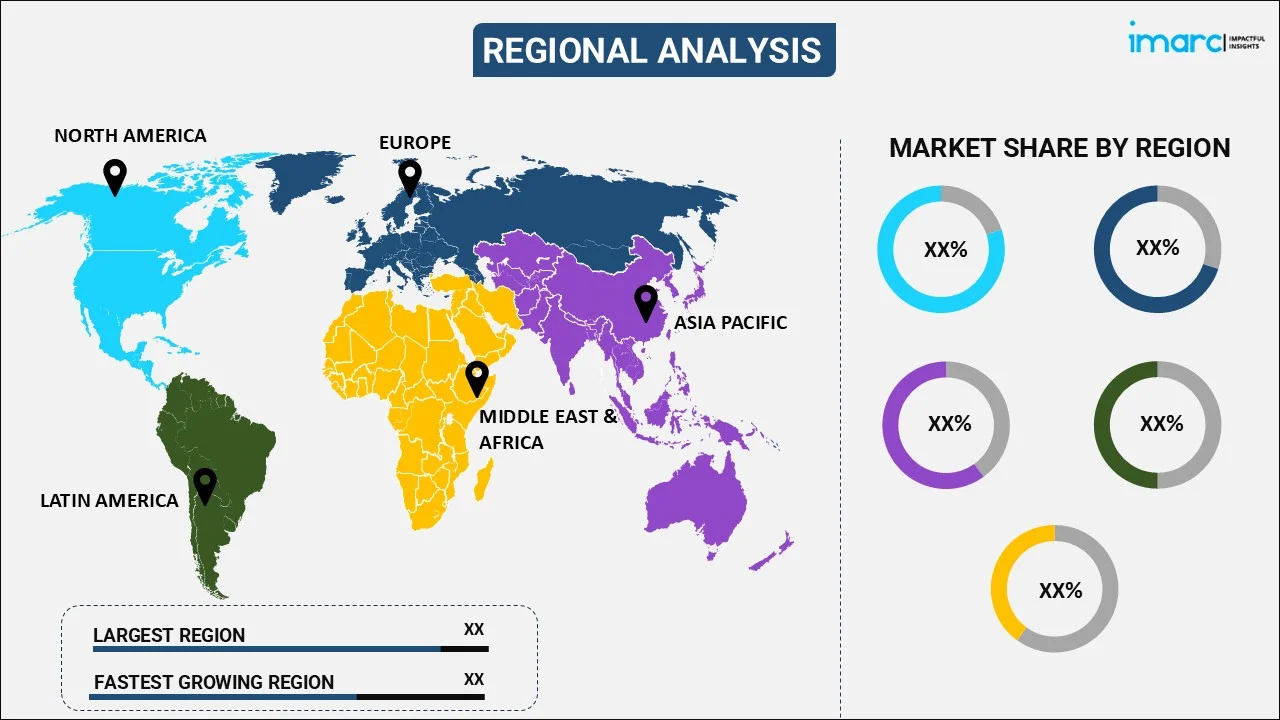
Breakup by Region:
To get more information on the regional analysis of this market Request Sample
- North America
- United States
- Canada
- Asia-Pacific
- China
- Japan
- India
- South Korea
- Australia
- Indonesia
- Others
- Europe
- Germany
- France
- United Kingdom
- Italy
- Spain
- Russia
- Others
- Latin America
- Brazil
- Mexico
- Others
- Middle East and Africa
Competitive Landscape:
The competitive landscape of the industry has also been examined along with the profiles of the key players being Abbott Laboratories, Agilent Technologies Inc., AmeriPath Inc (Quest Diagnostics Incorporated), Beckman Coulter Inc. (Danaher Corporation), Becton Dickinson and Company, F. Hoffmann-La Roche AG, General Electric Company, Illumina Inc., Myriad Genetics Inc., Pfizer Inc., Qiagen N.V. and Thermo Fisher Scientific Inc.
Report Coverage:
| Report Features | Details |
|---|---|
| Base Year of the Analysis | 2025 |
| Historical Period | 2020-2025 |
| Forecast Period | 2026-2034 |
| Units | Billion USD |
| Segment Coverage | Disease Type, Technology, End User, Region |
| Region Covered | Asia Pacific, Europe, North America, Latin America, Middle East and Africa |
| Countries Covered | United States, Canada, Germany, France, United Kingdom, Italy, Spain, Russia, China, Japan, India, South Korea, Australia, Indonesia, Brazil, Mexico |
| Companies Covered | Abbott Laboratories, Agilent Technologies Inc., AmeriPath Inc (Quest Diagnostics Incorporated), Beckman Coulter Inc. (Danaher Corporation), Becton Dickinson and Company, F. Hoffmann-La Roche AG, General Electric Company, Illumina Inc., Myriad Genetics Inc., Pfizer Inc., Qiagen N.V., Thermo Fisher Scientific Inc. |
| Customization Scope | 10% Free Customization |
| Post-Sale Analyst Support | 10-12 Weeks |
| Delivery Format | PDF and Excel through Email (We can also provide the editable version of the report in PPT/Word format on special request) |
Frequently Asked Questions About the Theranostics Market Report
We expect the global theranostics market to exhibit a CAGR of 15.75% during 2026-2034.
The rising development of new diagnostic and therapeutic agents for theranostics for personalizing the treatment of cancer, reducing side effects of treatment, and improving the quality care of pharmacotherapy is primarily driving the global theranostics market.
The sudden outbreak of the COVID-19 pandemic had led to postponement of cancer treatments to reduce the risk of the coronavirus infection upon hospital visits and interaction with medical equipment, thereby negatively impacting the global market for theranostics.
Based on the disease type, the global theranostics market can be segmented into neurological disorders, cardiovascular diseases, immunological disorders, oncology diseases, and others. Currently, oncology diseases exhibit a clear dominance in the market.
Based on the technology, the global theranostics market has been bifurcated into polymerase chain reaction, immunohistochemistry, in-situ hybridization, sequencing, and others. Among these, polymerase chain reaction currently accounts for the majority of the total market share.
Based on the end user, the global theranostics market can be divided into hospitals and clinics, diagnostic laboratories, and others. Currently, hospitals and clinics hold the largest market share.
On a regional level, the market has been classified into North America, Asia-Pacific, Europe, Latin America, and Middle East and Africa, where North America currently dominates the global market.
Some of the major players in the global theranostics market include Abbott Laboratories, Agilent Technologies Inc., AmeriPath Inc (Quest Diagnostics Incorporated), Beckman Coulter Inc. (Danaher Corporation), Becton Dickinson and Company, F. Hoffmann-La Roche AG, General Electric Company, Illumina Inc., Myriad Genetics Inc., Pfizer Inc., Qiagen N.V., and Thermo Fisher Scientific Inc.
Need more help?
- Speak to our experienced analysts for insights on the current market scenarios.
- Include additional segments and countries to customize the report as per your requirement.
- Gain an unparalleled competitive advantage in your domain by understanding how to utilize the report and positively impacting your operations and revenue.
- For further assistance, please connect with our analysts.
 Request Customization
 Speak to an Analyst
 Request Brochure
 Inquire Before Buying
Benefits of Customization
- Personalize this research
- Triangulate with your data
- Get data as per your format and definition
- Gain a deeper dive into a specific application, geography, customer, or competitor
- Any level of personalization
Get in Touch With Us
UNITED STATES
Phone: +1-201-971-6302
INDIA
Phone: +91-120-433-0800
UNITED KINGDOM
Phone: +44-753-714-6104
Email: [email protected]
Client Testimonials


.webp)


