
Turpentine Prices, Trend, Chart, Demand, Market Analysis, News, Historical and Forecast Data Report 2026 Edition
Turpentine Price Trend, Index and Forecast
Track the latest insights on turpentine price trend and forecast with detailed analysis of regional fluctuations and market dynamics across North America, Latin America, Central Europe, Western Europe, Eastern Europe, Middle East, North Africa, West Africa, Central and Southern Africa, Central Asia, Southeast Asia, South Asia, East Asia, and Oceania.
Turpentine Prices Outlook Q1 2026
- USA: USD 3573/Ton
- China: USD 2244/Ton
- Brazil: USD 1790/Ton
- Belgium: USD 1963/Ton
- Japan: USD 3220/Ton
Turpentine Price Chart

Get real-time access to monthly/quarterly/yearly prices Request Sample
During the first quarter of 2026, the turpentine prices in the USA reached 3573 USD/Ton in March. The market recorded a moderate increase, supported by steady demand from the paints and coatings industry. Supply conditions remained relatively tight due to controlled pine resin extraction and stable production levels. Demand from chemical and solvent applications remained consistent, contributing to price stability. Buyers maintained balanced procurement strategies, ensuring adequate supply without excessive inventory buildup.
During the first quarter of 2026, the turpentine prices in China reached 2244 USD/Ton in March. Stable demand from the downstream chemical and fragrance industries propelled the market's modest price growth. Due to limited resin tapping activity, which affected supply availability, domestic production remained under control. The stable export demand helped maintain a balanced supply situation. Market players kept enough supplies and used prudent buying techniques.
During the first quarter of 2026, the turpentine prices in Brazil reached 1790 USD/Ton in March. The market saw a discernible rise backed by consistent domestic output and strong export demand. Although availability was significantly impacted by seasonal changes in resin extraction, supply conditions remained balanced. Market activity was supported by steady demand from the adhesives and coatings industries.
During the first quarter of 2026, the turpentine prices in Belgium reached 1963 USD/Ton in March. The market recorded a steady rise influenced by stable demand from the industrial and chemical sectors. Import availability remained consistent, ensuring balanced supply conditions across the market. Consumption from coatings and solvent applications remained firm, supporting price increases.
During the first quarter of 2026, the turpentine prices in Japan reached 3220 USD/Ton in March. The market experienced moderate growth driven by steady demand from the chemical and pharmaceutical sectors. Import reliance played a key role in shaping supply conditions, with consistent inflows ensuring adequate availability. Consumption remained stable, supporting market balance.
Turpentine Prices Outlook Q4 2025
- USA: USD 3514/Ton
- China: USD 2217/Ton
- Brazil: USD 1730/Ton
- Belgium: USD 1916/Ton
- Japan: USD 3100/Ton
During the fourth quarter of 2025, the turpentine prices in the USA reached 3514 USD/Ton in December. Due to tighter domestic supply conditions brought on by decreased pine resin tapping efficiency and limited gum turpentine feedstock availability, prices witnessed bullish sentiment. Supply chains were further strained by seasonal labor shortages and increased operational expenses across forestry enterprises. Paints, coatings, and industrial solvents continued to be in high demand due to consistent building and renovation activities.
During the fourth quarter of 2025, the turpentine prices in China reached 2217 USD/Ton in December. The market experienced gradual price strengthening supported by controlled production rates and reduced output from smaller distillation units. Environmental compliance measures limited operational flexibility, leading to restrained supply availability. Downstream demand from adhesives, fragrances, and chemical intermediates remained stable, while export interest improved toward the end of the quarter.
During the fourth quarter of 2025, the turpentine prices in Brazil reached 1730 USD/Ton in December. Weather-related disruptions to raw material collection and limited pine resin harvesting operations were the main causes of price hikes. Coatings and agrochemical industries maintained robust domestic demand, effectively utilizing available volumes. Besides, local supply balances were tightened as export demand increased as well.
During the fourth quarter of 2025, the turpentine prices in Belgium reached 1916 USD/Ton in December. Limited regional supply availability and consistent demand from manufacturers of specialized chemicals and fragrances sustained the industry. The market was subject to shipping restrictions and upstream cost pressures due to its reliance on imports, which resulted in higher prices. As purchasers used just-in-time procurement techniques, inventory levels stayed low.
During the fourth quarter of 2025, the turpentine prices in Japan reached 3100 USD/Ton in December. Prices strengthened due to restricted import volumes and steady downstream demand from pharmaceuticals, flavors, and specialty solvents. Domestic production limitations increased reliance on overseas supply, exposing the market to freight and procurement challenges. Buyers prioritized supply security, leading to firm contract negotiations.
Turpentine Prices Outlook Q3 2025
- USA: USD 3459/Ton
- China: USD 2184/Ton
- Brazil: USD 1676/Ton
- Belgium: USD 1875/Ton
- Japan: USD 2989/Ton
During the third quarter of 2025, the turpentine prices in the USA reached 3459 USD/Ton in September. Prices increased as fragrance, coatings, and industrial solvent manufacturers expanded intake in line with rising production cycles. Feedstock from gum-resin operations tightened periodically, encouraging distributors to pre-book shipments. Strong logistics performance through Gulf and East Coast terminals allowed downstream processors to maintain consistent manufacturing runs.
During the third quarter of 2025, the turpentine prices in China reached 2184 USD/Ton in September. Prices rose amid improving demand from aromatics, adhesive, and synthetic fragrance industries. Weather-related fluctuations in resin tapping influenced supply, prompting more guarded inventory planning among producers. Export volumes remained active, and domestic production hubs managed materials efficiently to support downstream operations.
During the third quarter of 2025, the turpentine prices in Brazil reached 1676 USD/Ton in September. Prices declined as resin tapping volumes increased in several forested regions, adding more availability to the domestic supply chain. Some downstream users in fragrances, solvents, and intermediates sourced material cautiously to balance inventories. Logistics networks across key ports enabled timely movement, supporting predictable dispatch schedules.
During the third quarter of 2025, the turpentine prices in Belgium reached 1875 USD/Ton in September. Prices moved downward as steady import arrivals from South America and Asia expanded availability. Downstream users in adhesives, coatings, and specialty chemicals maintained routine purchasing in line with established operations. Inland distribution through Northwest European logistics corridors improved delivery timing, supporting stable production cycles.
During the third quarter of 2025, the turpentine prices in Japan reached 2989 USD/Ton in September. Prices increased as domestic fragrance, ink, and solvent manufacturers elevated procurement. Import-dependent industries adjusted sourcing strategies to manage lead times across East Asian shipping routes. Consistent downstream manufacturing contributed to more active purchasing across major industrial clusters.
Turpentine Prices Outlook Q2 2025
- USA: USD 3398/Ton
- China: USD 2152/Ton
- Brazil: USD 1708/Ton
- Belgium: USD 1911/Ton
- Japan: USD 2905/Ton
During the second quarter of 2025, the turpentine prices in the USA reached 3398 USD/Ton in June. As per the turpentine price chart, logistical challenges, including transportation bottlenecks and export constraints, complicated the supply chain. These issues led to delays in shipments and increased costs, contributing to the overall upward pressure on prices. Additionally, the US market faced competition from international suppliers, particularly in Asia and Europe, where production levels and export activities influenced global pricing trends.
During the second quarter of 2025, the turpentine prices in China reached 2152 USD/Ton in June. Prices in China experienced fluctuations influenced by steady demand from the paints and coatings sector, which maintained a consistent consumption pattern. However, as the quarter progressed, concerns about oversupply emerged due to increased refinery activity and higher export volumes.
During the second quarter of 2025, turpentine prices in Brazil reached 1708 USD/Ton in June. Logistical challenges exacerbated the supply constraints. Delays in shipments, particularly to key markets like India, were reported due to limited availability of isotanks and port congestion in the Asia-Pacific region. These delays disrupted the timely delivery of turpentine, further straining supply and contributing to price increases.
During the second quarter of 2025, the turpentine prices in Belgium reached 1911 USD/Ton in June. A significant contributor to the softening demand was the lackluster construction activity during the early spring season. This slowdown in construction projects led to reduced consumption of MTO in applications such as coatings and adhesives. Additionally, buyers in Belgium scaled back purchases amidst growing inventories and slower-than-expected project starts, further dampening market sentiment.
During the second quarter of 2025, the turpentine prices in Japan reached 2905 USD/Ton in June. Japan's domestic demand for turpentine remained steady, with consistent consumption in traditional sectors such as paints, coatings, and cleaning agents. However, there were no significant spikes in demand that would drive prices higher.
Turpentine Prices Outlook Q1 2025
- USA: USD 3345/Ton
- China: USD 2020/Ton
- Brazil: USD 1740/Ton
- Belgium: USD 1945/Ton
- Japan: USD 2855/Ton
During the first quarter of 2025, the turpentine prices in the USA reached 3345 USD/Ton in March. As per the turpentine price chart, prices fluctuated due to a combination of factors, including crude oil prices, seasonal demand, and supply chain disruptions. Besides, refinery maintenance and export opportunities also played a significant role.
During the first quarter of 2025, turpentine prices in China reached 2020 USD/Ton in March. Prices experienced fluctuations due to a combination of factors, including elevated domestic production capacity, robust export activity, and fluctuations in crude oil prices. Initially, prices were supported by supply concerns and steady demand, but as refinery activity normalized and exports increased, concerns about oversupply began to mount.
During the first quarter of 2025, the turpentine prices in Brazil reached 1740 USD/Ton in March. Brazilian elliottii gum turpentine prices surged due to tightening supply and robust demand from critical end-use sectors. Besides, due to the continued bearish outlook for rosin, low processing rates persisted, limiting turpentine supply further.
During the first quarter of 2025, the turpentine prices in Belgium reached 1945 USD/Ton in March. Prices in Belgium fluctuated due to a mix of factors, including changes in crude oil prices, supply chain disruptions, and seasonal demand patterns.
During the first quarter of 2025, the turpentine prices in Japan reached 2855 USD/Ton in March. Prices in Japan experienced fluctuations due varying crude oil prices, refinery turnarounds, and seasonal demand. Elevated input costs, particularly those related to crude oil and seasonal demand also influenced prices.
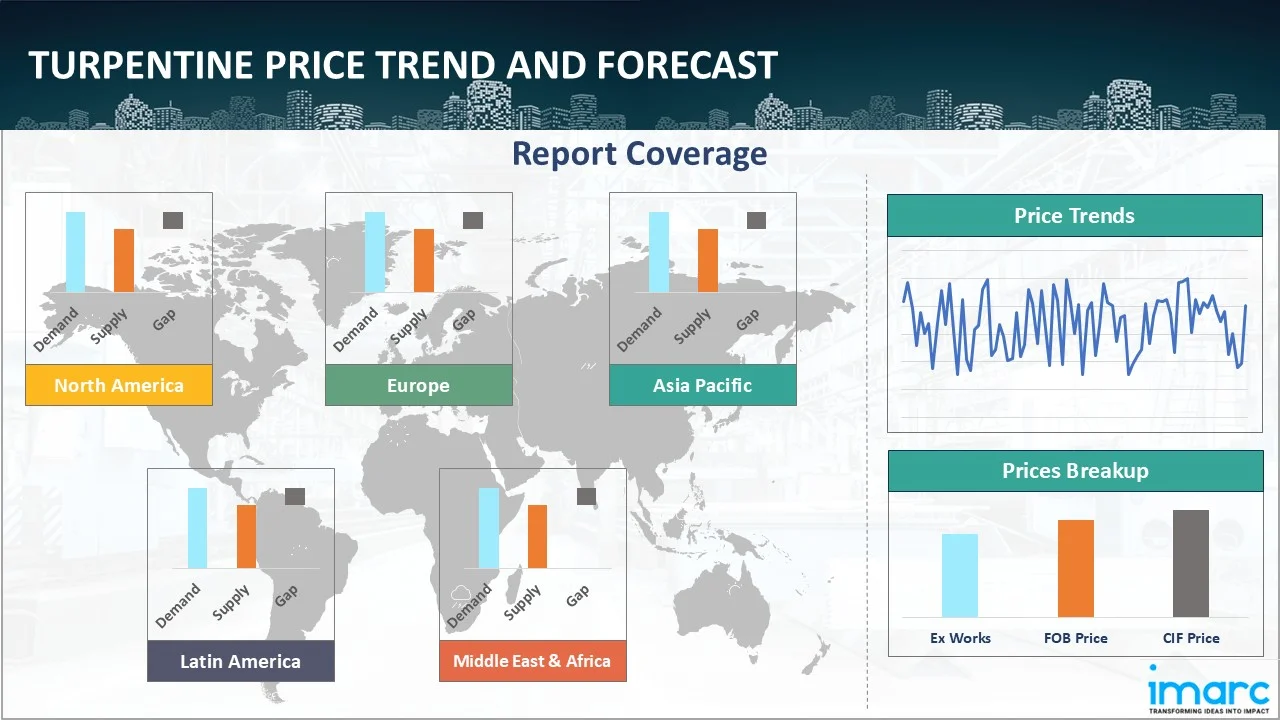
Regional Coverage
The report provides a detailed analysis of the market across different regions, each with unique pricing dynamics influenced by localized market conditions, supply chain intricacies, and geopolitical factors. This includes price trends, price forecast and supply and demand trends for each region, along with spot prices by major ports. The report also provides coverage of FOB and CIF prices, as well as the key factors influencing turpentine prices.
Europe Turpentine Price Trend
Q1 2026:
The turpentine price index in Europe showed a steady upward trend supported by balanced supply and consistent demand from coatings and solvent industries. Import availability remained stable across major markets, ensuring adequate distribution of material without creating supply shortages. Production levels across the region were aligned with consumption needs, preventing excess inventory buildup. Demand from paints, varnishes, and industrial solvent applications remained firm, supporting continuous offtake.
Q4 2025:
The turpentine price index in Europe reflected an upward trend driven by constrained supply and steady downstream demand. Limited regional production and reliance on imports exposed markets to logistics and cost pressures. Energy cost volatility and cautious manufacturing activity influenced supplier pricing strategies. Buyers focused on supply continuity, supporting firmer contract negotiations. Lean inventory levels and disciplined procurement reinforced price stability across the region.
Q3 2025:
As per the turpentine price index, Europe recorded softer conditions overall, shaped by declines in Belgium and variations in procurement across Western and Central Europe. Downstream sectors such as coatings, adhesives, and fragrance compounds continued operating steadily, with distributors relying on regular arrivals from Brazil, China, and Japan to meet grade-specific requirements. Mild congestion at Antwerp, Rotterdam, and Hamburg influenced shipment timing, prompting earlier planning among buyers. Energy-linked manufacturing costs remained a focal point for suppliers, while chemical clusters across Germany and the Benelux coordinated intake according to evolving production schedules.
Q2 2025:
On the supply side, Europe faced logistical challenges that impacted the distribution of turpentine. Inland transport issues, particularly in Central Europe, led to increased delivery times and costs, further contributing to the overall market pressure. Additionally, refinery maintenance schedules and unplanned outages in key Western European production hubs constrained output, limiting the availability of turpentine in the market. Despite these challenges, the European turpentine market remained relatively stable, with prices adjusting to reflect the current supply-demand balance.
Q1 2025:
As per the turpentine price index, prices in Europe were influenced by a combination of factors, including a weak construction sector, fluctuating energy prices, and geopolitical uncertainties. Moreover, changes in crude oil prices, a key factor in turpentine production costs, impacted the market. Besides, the demand for turpentine from various downstream industries, including paints, coatings, and chemicals, also played a role in price fluctuations.
This analysis can be extended to include detailed turpentine price information for a comprehensive list of countries.
| Region | Countries Covered |
|---|---|
| Europe | Germany, France, United Kingdom, Italy, Spain, Russia, Turkey, Netherlands, Poland, Sweden, Belgium, Austria, Ireland, Switzerland, Norway, Denmark, Romania, Finland, Czech Republic, Portugal, and Greece, among other European countries. |
North America Turpentine Price Trend
Q1 2026:
The turpentine price index in North America reflected moderate growth driven by steady demand from paints, coatings, and chemical industries. Domestic resin extraction and processing activity remained stable, ensuring controlled supply conditions across the region. Production levels were sufficient to meet demand without creating surplus availability. Consumption from industrial applications remained consistent, particularly from coatings and cleaning product manufacturers. Buyers adopted disciplined procurement strategies, aligning purchases with immediate production needs and avoiding excess stock accumulation.
Q4 2025:
The turpentine price index in North America showed strengthening momentum. Reduced resin harvesting efficiency and higher operating costs limited supply availability. Demand from construction-related coatings and industrial solvents remained resilient. Logistics constraints and cautious inventory management further supported higher prices. Market participants prioritized domestic sourcing, reinforcing regional price firmness.
Q3 2025:
As per the turpentine price index, North America reflected firmer conditions led by the price increase in the USA. Demand strengthened among fragrance, solvent-blending, and adhesive manufacturers, supported by improved resin feedstock availability and robust chemical-sector activity. Canada’s processors maintained dependable intake for intermediate production, aided by stable cross-border logistics. Import shipments from Brazil, China, and Belgium augmented regional supply diversity. Port terminals across the Gulf and East Coasts operated efficiently, facilitating timely fulfillment of downstream production commitments.
Q2 2025:
Turpentine prices in North America experienced a downward trend, influenced by several interrelated factors. A significant contributor to this decline was subdued demand from key sectors such as paints, coatings, and industrial solvents. This was particularly evident in April and May, when cooler-than-expected weather conditions in several regions led to a slowdown in construction and renovation activities. Consequently, downstream consumption lagged, and end-users reduced their spot purchases amid bloated inventories and slow-moving sales.
Q1 2025:
Turpentine prices in North America experienced fluctuations influenced by a combination of factors, including crude oil prices and supply chain dynamics. Prices were influenced due to increased input costs and seasonal demand, particularly from wedding festivities. However, supply and falling crude oil prices, despite persistent weak downstream demand in the construction and coatings sectors, further influenced prices.
Specific turpentine prices and historical data within the United States and Canada can also be provided.
| Region | Countries Covered |
|---|---|
| North America | United States and Canada |
Middle East and Africa Turpentine Price Trend
Q1 2026:
According to the turpentine price chart, supply chain interruptions, seasonal changes in demand, and geopolitical influences were the main causes of the price fluctuations in the Middle East and Africa.
Q4 2025:
The report explores the turpentine trends and turpentine chart in the Middle East and Africa, considering factors like regional industrial growth, the availability of natural resources, and geopolitical tensions that uniquely influence market prices.
Q3 2025:
As per turpentine price chart, the prices in the Middle East and Africa fluctuated due to a complex interplay of factors, primarily driven by supply chain disruptions, seasonal demand shifts, and geopolitical influences.
In addition to region-wise data, information on turpentine prices for countries can also be provided.
| Region | Countries Covered |
|---|---|
| Middle East & Africa | Saudi Arabia, UAE, Israel, Iran, South Africa, Nigeria, Oman, Kuwait, Qatar, Iraq, Egypt, Algeria, and Morocco, among other Middle Eastern and African countries. |
Asia Pacific Turpentine Price Trend
Q1 2026:
In the Asia Pacific region, turpentine prices showed moderate growth driven by steady demand from the chemical and fragrance industries. Production levels across key countries remained controlled, ensuring balanced supply conditions without creating excess availability. Import and export flows remained stable, supporting consistent trade activity across the region. Demand from downstream sectors such as coatings, adhesives, and personal care products remained firm, sustaining market momentum. Buyers maintained cautious procurement strategies, avoiding aggressive inventory accumulation while ensuring supply continuity.
Q4 2025:
Turpentine prices in the Asia Pacific region demonstrated a sustained upward trend as producers maintained controlled operating rates to balance supply with prevailing demand conditions. Regulatory oversight and stricter environmental compliance requirements continued to restrict production flexibility, limiting the ability of manufacturers to scale output in response to market needs. At the same time, downstream demand from adhesives, coatings, fragrances, and specialty chemical sectors remained consistently stable, providing a solid demand base. Export-oriented sales further tightened regional availability, particularly as suppliers prioritized contractual commitments.
Q3 2025:
Asia Pacific recorded firmer conditions driven by increases in China and Japan. Strong procurement from aromatics, adhesives, and fragrance manufacturers supported demand across China’s coastal chemical zones, while Japan’s specialty chemical and solvent processors elevated intake. Southeast Asian countries, including Indonesia and Malaysia, maintained steady sourcing as manufacturing activity progressed. Imports from the USA, Brazil, and Europe expanded grade availability. Improved port efficiency in Shanghai, Yokohama, and Singapore ensured smooth logistics, enabling downstream industries to manage inventories effectively.
Q2 2025:
The decrease in prices was primarily driven by subdued demand from key sectors such as paints, coatings, and industrial solvents. Buyers exhibited cautious procurement behavior, opting to utilize existing inventories rather than restocking, amid broader economic uncertainties and a generally soft market sentiment. Despite steady domestic production, the lack of strong buying interest placed downward pressure on prices.
Q1 2025:
In the Asia Pacific region during Q1 2025, turpentine prices fluctuated due rising crude oil prices and seasonal demand from numerous festivities, which led to price hikes. Later, refinery turnarounds and improved exports also supported price increases, while declining crude prices and abundant supply in March led to price volatility. Downstream demand remained weak in the construction and coatings industries.
This turpentine price analysis can be expanded to include a comprehensive list of countries within the region.
| Region | Countries Covered |
|---|---|
| Asia Pacific | China, India, Indonesia, Pakistan, Bangladesh, Japan, Philippines, Vietnam, Thailand, South Korea, Malaysia, Nepal, Taiwan, Sri Lanka, Hongkong, Singapore, Australia, and New Zealand, among other Asian countries. |
Latin America Turpentine Price Trend
Q1 2026:
In Latin America, turpentine prices experienced steady upward movement supported by balanced supply and firm export demand. Regional production remained stable, supported by consistent resin extraction and processing activities. Export demand from international markets remained firm, contributing to tighter supply availability within domestic markets. Consumption from coatings, adhesives, and industrial solvent sectors remained steady, ensuring continuous market activity. Buyers followed cautious purchasing strategies, maintaining sufficient inventory levels without engaging in aggressive procurement.
Q4 2025:
The Latin American turpentine market experienced bullish pricing dynamics, primarily supported by the constrained availability of pine resin feedstock. Harvesting activity was affected by weather-related disruptions, which limited raw material collection and reduced effective supply. Despite these constraints, export demand remained steady, particularly from international buyers seeking alternative sourcing options, further tightening regional supply balances. Domestic consumption from coatings, agrochemicals, and industrial solvent applications showed resilience, absorbing available volumes efficiently.
Q3 2025:
Latin America reflected a softer overall tone, driven primarily by the decline in Brazil, a key producer and supplier. Increased resin tapping across Brazilian forested areas boosted availability and placed downward pressure on domestic offers. Downstream manufacturers in Argentina, Chile, and Colombia maintained stable procurement to support fragrance, coatings, and solvent-based applications, relying partly on imports from the USA, China, and Japan. Inland logistics and currency considerations shaped purchasing schedules, leading some buyers to coordinate shipments earlier to manage variability across regional transport networks.
Q2 2025:
As per the turpentine price index, prices in Latin America experienced notable fluctuations, influenced by a combination of supply constraints, demand shifts, and regional economic factors. In Mexico, the market faced challenges stemming from logistical disruptions and fluctuating demand. Infrastructure bottlenecks and inconsistent regulatory frameworks contributed to price volatility, making it difficult for producers to maintain stable pricing.
Q1 2025:
As per the turpentine price index, Brazilian pinus elliottii gum turpentine prices surged due to tightening supply and robust demand from critical end-use sectors. This price hike stemmed from reduced supply, as gum turpentine is a coproduct of pine oleoresin distillation, along with gum rosin. With a weaker market outlook for gum rosin, many processors lowered their production rates, consequently curbing the output of gum turpentine. Moreover, several Brazilian manufacturers sold out of Pinus elliottii gum turpentine through February and March, indicating sustained demand pressure.
This comprehensive review can be extended to include specific countries within the region.
| Region | Countries Covered |
|---|---|
| Latin America | Brazil, Mexico, Argentina, Columbia, Chile, Ecuador, and Peru, among other Latin American countries. |
Turpentine Pricing Report, Market Analysis, and News
IMARC's latest publication, “Turpentine Prices, Trend, Chart, Demand, Market Analysis, News, Historical and Forecast Data Report 2026 Edition,” presents a detailed examination of the turpentine market, providing insights into both global and regional trends that are shaping prices. This report delves into the spot price of turpentine at major ports and analyzes the composition of prices, including FOB and CIF terms. It also presents detailed turpentine prices trend analysis by region, covering North America, Europe, Asia Pacific, Latin America, and Middle East and Africa. The factors affecting turpentine pricing, such as the dynamics of supply and demand, geopolitical influences, and sector specific developments, are thoroughly explored. This comprehensive report helps stakeholders stay informed with the latest market news, regulatory updates, and technological progress, facilitating informed strategic decision-making and forecasting.
Turpentine Industry Analysis
The global turpentine industry size reached USD 1.4 Billion in 2025. By 2034, IMARC Group expects the market to reach USD 2.3 Billion, at a projected CAGR of 5.42% during 2026-2034. Growth is supported by expanding demand in fragrance and flavor formulations, rising use in resins and adhesives, and increasing preference for bio-based solvents across coatings and specialty chemical applications, aided by global capacity additions in gum-resin production.
Latest News and Developments:
- June 2025: Chennai Petroleum Corporation Limited (CPCL) announced plans to launch fuel retail outlets and introduce new lubricant products across India, including to industries that use forest-derived inputs, such as turpentine oil, in downstream manufacturing. The expansion aims to strengthen CPCL’s presence in the domestic energy and lubricants market while supporting broader industrial supply chains.
Product Description
Turpentine is a volatile, odorous liquid obtained primarily from the distillation of resin extracted from pine trees. It exists in two primary forms: gum turpentine, derived directly from tapping live pine trees, and wood turpentine, obtained as a by-product during the processing of pine wood. Chemically, turpentine consists mainly of terpenes, especially alpha-pinene and beta-pinene, which lend it both its characteristic aroma and its utility as a precursor in the production of fragrance and flavor compounds.
Historically, turpentine has served as a vital solvent in the manufacture of varnishes, paints, and waxes due to its strong dissolving properties and compatibility with resins. Today, it continues to be used in the paints and coatings industry, as well as in adhesives, pharmaceuticals, cleaning agents, and aroma chemicals. Its bio-based origin also makes it an attractive alternative to synthetic solvents in environmentally conscious applications. Furthermore, with increasing emphasis on renewable and sustainable raw materials, turpentine’s role is expanding in green chemistry and biorefinery processes.
Report Coverage
| Key Attributes | Details |
|---|---|
| Product Name | Turpentine |
| Report Features | Exploration of Historical Trends and Market Outlook, Industry Demand, Industry Supply, Gap Analysis, Challenges, Ammonia Price Analysis, and Segment-Wise Assessment. |
| Currency/Units | US$ (Data can also be provided in local currency) or Metric Tons |
| Region/Countries Covered | The current coverage includes analysis at the global and regional levels only. Based on your requirements, we can also customize the report and provide specific information for the following countries: Asia Pacific: China, India, Indonesia, Pakistan, Bangladesh, Japan, Philippines, Vietnam, Thailand, South Korea, Malaysia, Nepal, Taiwan, Sri Lanka, Hongkong, Singapore, Australia, and New Zealand Europe: Germany, France, United Kingdom, Italy, Spain, Russia, Turkey, Netherlands, Poland, Sweden, Belgium, Austria, Ireland, Switzerland, Norway, Denmark, Romania, Finland, Czech Republic, Portugal and Greece North America: United States and Canada Middle East & Africa: Saudi Arabia, UAE, Israel, Iran, South Africa, Nigeria, Oman, Kuwait, Qatar, Iraq, Egypt, Algeria, and Morocco Latin America: Brazil, Mexico, Argentina, Columbia, Chile, Ecuador, Peru The list of countries presented is not exhaustive. Information on additional countries can be provided if required by the client. |
| Information Covered for Key Suppliers |
|
| Customization Scope | The report can be customized as per the requirements of the customer |
| Report Price and Purchase Option |
Plan A: Monthly Updates - Annual Subscription
Plan B: Quarterly Updates - Annual Subscription
Plan C: Biannually Updates - Annual Subscription
|
| Post-Sale Analyst Support | 360-degree analyst support after report delivery |
| Delivery Format | PDF and Excel through email (We can also provide the editable version of the report in PPT/Word format on special request) |
Key Benefits for Stakeholders:
- IMARC’s report presents a detailed analysis of turpentine pricing, covering global and regional trends, spot prices at key ports, and a breakdown of FOB and CIF prices.
- The study examines factors affecting turpentine price trend, including input costs, supply-demand shifts, and geopolitical impacts, offering insights for informed decision-making.
- The competitive landscape review equips stakeholders with crucial insights into the latest market news, regulatory changes, and technological advancements, ensuring a well-rounded, strategic overview for forecasting and planning.
- IMARC offers various subscription options, including monthly, quarterly, and biannual updates, allowing clients to stay informed with the latest market trends, ongoing developments, and comprehensive market insights. The turpentine price charts ensure our clients remain at the forefront of the industry.
Need more help?
- Speak to our experienced analysts for insights on the current market scenarios.
- Include additional segments and countries to customize the report as per your requirement.
- Gain an unparalleled competitive advantage in your domain by understanding how to utilize the report and positively impacting your operations and revenue.
- For further assistance, please connect with our analysts.
 Request Customization
 Inquire Before Buying
 Speak to an Analyst
 Request Brochure
Benefits of Customization
- Personalize this research
- Triangulate with your data
- Get data as per your format and definition
- Gain a deeper dive into a specific application, geography, customer, or competitor
- Any level of personalization
Get in Touch With Us
UNITED STATES
Phone: +1-201-971-6302
INDIA
Phone: +91-120-433-0800
UNITED KINGDOM
Phone: +44-753-714-6104
Email: [email protected]
Client Testimonials


.webp)


Why Choose Us
IMARC offers trustworthy, data-centric insights into commodity pricing and evolving market trends, enabling businesses to make well-informed decisions in areas such as procurement, strategic planning, and investments. With in-depth knowledge spanning more than 1000 commodities and a vast global presence in over 150 countries, we provide tailored, actionable intelligence designed to meet the specific needs of diverse industries and markets.
1000
+Commodities
150
+Countries Covered
3000
+Clients
20
+Industry
Robust Methodologies & Extensive Resources
IMARC delivers precise commodity pricing insights using proven methodologies and a wealth of data to support strategic decision-making.
Subscription-Based Databases
Our extensive databases provide detailed commodity pricing, import-export trade statistics, and shipment-level tracking for comprehensive market analysis.
Primary Research-Driven Insights
Through direct supplier surveys and expert interviews, we gather real-time market data to enhance pricing accuracy and trend forecasting.
Extensive Secondary Research
We analyze industry reports, trade publications, and market studies to offer tailored intelligence and actionable commodity market insights.
Trusted by 3000+ industry leaders worldwide to drive data-backed decisions. From global manufacturers to government agencies, our clients rely on us for accurate pricing, deep market intelligence, and forward-looking insights.