
United States Beer Market Size, Share, Trends and Forecast by Product Type, Packaging, Production, Alcohol Content, Flavor, Distribution Channel, and Region, 2026-2034
United States Beer Market Size, Share, Trends & Forecast (2026-2034)
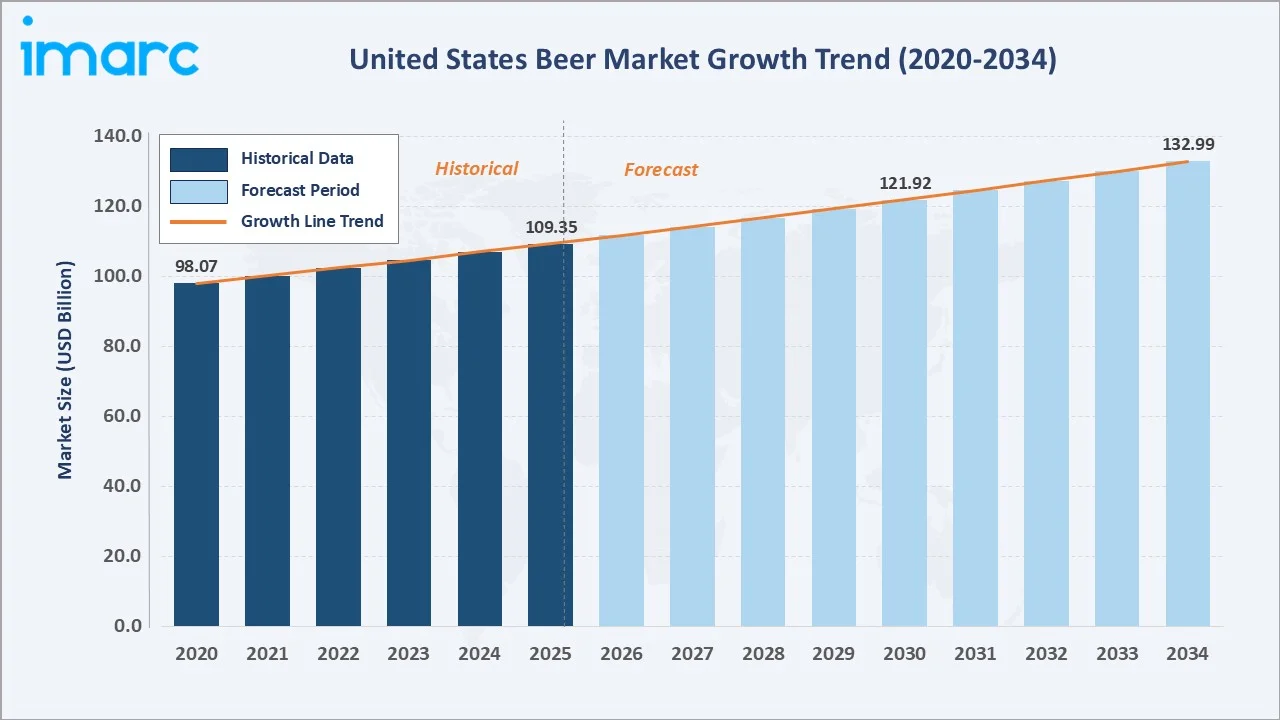
The United States beer market size reached USD 109.35 Billion in 2025 and is projected to reach USD 132.99 Billion by 2034, exhibiting a CAGR of 2.20% during 2026-2034. Changing consumer preferences towards craft and flavored beers, rising disposable incomes, and proliferation of microbreweries and brewpubs are the primary forces driving beer market growth.
Standard lager dominates the product mix at 46.8% in 2025, while glass packaging leads at 41.6%. The West commands a 29.6% regional share in 2025, reflecting California's craft culture and premium demand.
Market Snapshot
|
Metric |
Value |
|
Market Size (2025) |
USD 109.35 Billion |
|
Forecast Market Size (2034) |
USD 132.99 Billion |
|
CAGR (2026-2034) |
2.20% |
|
Base Year |
2025 |
|
Historical Period |
2020-2025 |
|
Forecast Period |
2026-2034 |
|
Largest Region |
West (29.6% share, 2025) |
|
Second Region |
South (27.8% share, 2025) |
|
Leading Product Type |
Standard Lager (46.8%, 2025) |
|
Leading Packaging |
Glass (41.6%, 2025) |
To get more information on this market, Request Sample
The United States beer market growth trajectory from 2020 through 2034, with the historical expansion to USD 109.35 Billion in 2025, reflects consistent demand-driven growth, while the forecast to USD 132.99 Billion captures accelerating premiumization, craft beer expansion, and the mainstreaming of low-alcohol and non-alcoholic variants.
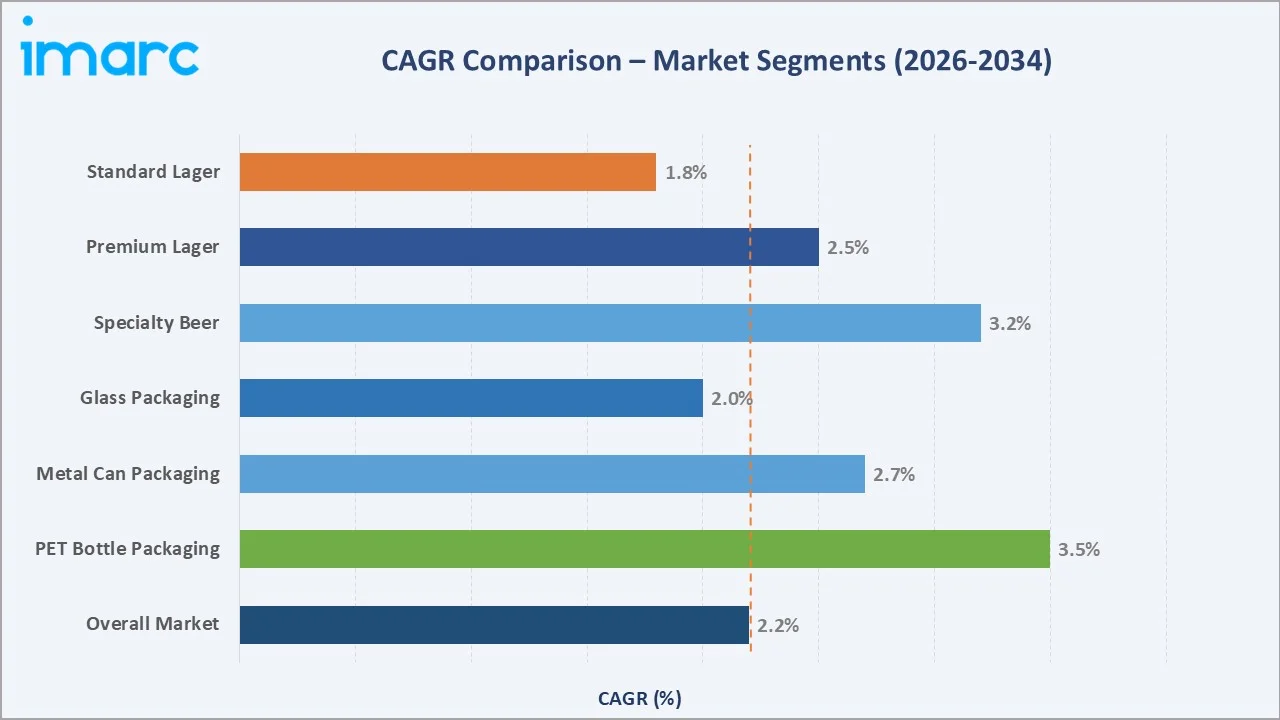
The CAGR trajectories across key product type and packaging sub-segments, with specialty beer at ~3.2% CAGR and PET bottle packaging at ~3.5% CAGR, are the fastest-growing categories within the United States beer industry through 2034.
Executive Summary
The United States beer market is on a sustained growth trajectory from USD 109.35 Billion in 2025 to USD 132.99 Billion by 2034. Beer, an essential beverage across social, sports, and leisure occasions, benefits from non-discretionary demand characteristics reinforced by strong brand loyalty and extensive retail distribution.
Standard lager dominates product type at 46.8% in 2025, owing to its widespread appeal, accessible price point, and availability across all retail and on-trade channels. Premium lager at 24.6% captures the premiumization trend. Specialty beer at 20.4% is the fastest-growing segment, driven by craft movement consumer sophistication.
The West leads regional distribution at 29.6% in 2025, reflecting California's craft beer culture and Pacific Northwest premium demand. The South follows at 27.8%, driven by Texas and Florida's high-volume consumption markets and outdoor culture.
Key Market Insights
|
Insight |
Data |
|
Largest Product Type |
Standard Lager — 46.8% share (2025) |
|
Second Product Type |
Premium Lager — 24.6% share (2025) |
|
Leading Packaging |
Glass — 41.6% revenue share (2025) |
|
Second Packaging |
Metal Can — 34.8% revenue share (2025) |
|
Leading Region |
West — 29.6% revenue share (2025) |
|
Second Region |
South — 27.8% revenue share (2025) |
|
Top Companies |
Anheuser-Busch InBev, Molson Coors, Constellation Brands, Boston Beer Co., Heineken USA, Pabst Brewing, Diageo North America |
Key Analytical Observations Supporting the Above Data:
- Standard lager, with 46.8% in 2025, dominates because of its universal consumer appeal, cost-effectiveness at scale, and the commanding brand strength of Budweiser, Coors Light, and Miller Lite, which maintain near-ubiquitous retail presence across the United States.
- Glass packaging, at 41.6% in 2025, leads because it is perceived as premium by consumers, preserves flavor integrity, and is the preferred format for on-trade and specialty beer occasions. Bottles dominate craft and import beer presentations.
- The West's 29.6% dominance in 2025 reflects multiple structural forces: California alone hosts over 1,000 craft breweries, the Pacific Northwest has one of the highest per-capita craft beer consumption rates, and Colorado's Denver hub anchors the Rocky Mountain craft scene.
- The South, with 27.8% in 2025, benefits from high-volume consumption tied to warm climate outdoor events, sports venues, concerts, and a younger demographic concentration in Texas, Florida, and Georgia.
United States Beer Market Overview
Beer is the most consumed alcoholic beverage in the United States, produced through fermentation of grain-based sugars with yeast, incorporating water, malted barley, hops, and adjunct grains. Product configurations span standard lagers, premium lagers, specialty craft beers, ales, stouts, and non-alcoholic variants, differentiated by alcohol content, flavor profile, origin, and packaging format.
The US beer ecosystem integrates agricultural raw material suppliers, large macro-brewery producers, regional and micro-brewery networks, glass and can packaging manufacturers, national and regional distributors, large-format retail chains, convenience stores, on-trade venues, and a diverse end-consumer base across all four US geographic regions.
Market Dynamics
To evaluate market opportunities, Request Sample
Market Drivers
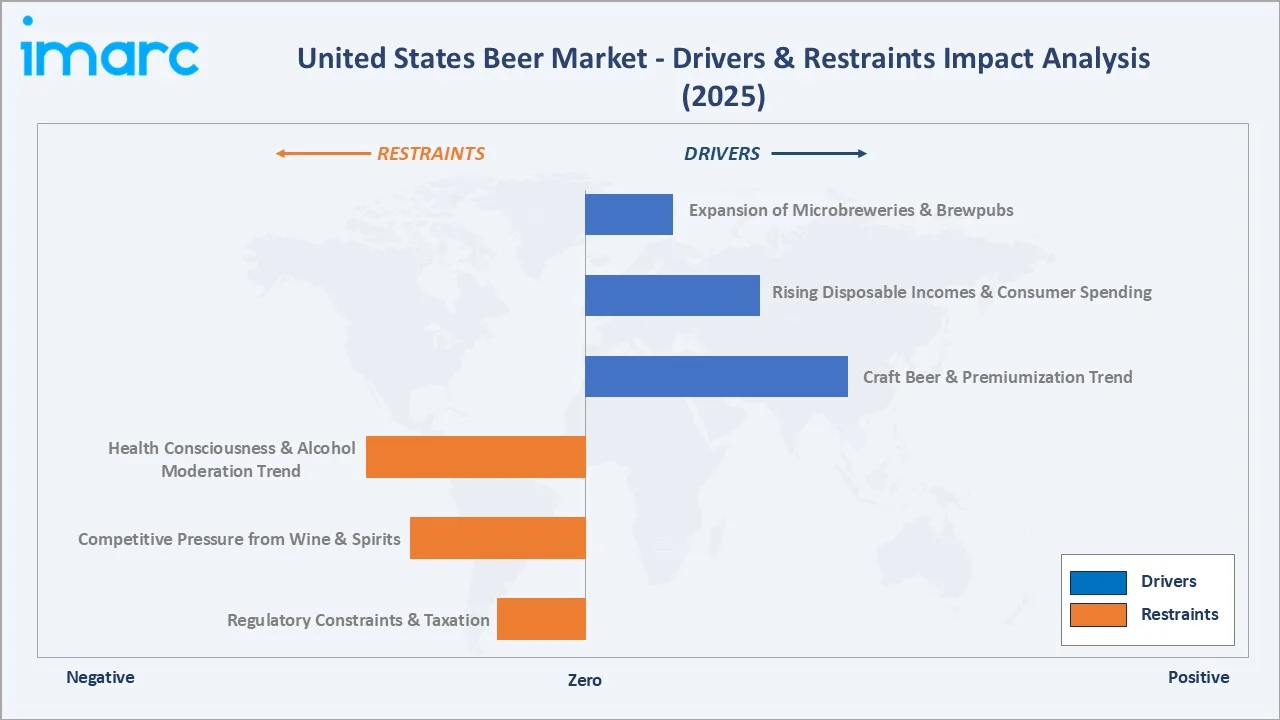
- Craft Beer and Premiumization Trend: Consumer preference for unique, locally produced, and artisanal beer varieties has fueled a craft beer renaissance. Over 9,700 craft breweries were operating in the United States, generating sustained demand for specialty and premium beer segments that command higher retail price points and per-unit margins.
- Rising Disposable Incomes and Evolving Social Cultures: Growing household incomes and a culture of social beer consumption at sports events, concerts, music festivals, and casual dining drive volume growth. Beer's strong association with professional sports, particularly NFL, MLB, and NBA, creates sustained high-frequency consumption occasions.
- Expanding Microbrewery and Brewpub Network: The proliferation of microbreweries and brewpubs across suburban and urban markets creates local loyalty and tourism demand. Experiential brewery visits have become a growing consumer activity, generating both on-premises revenue and premium packaged product sales.
Market Restraints
- Health Consciousness and Moderation Trend: Growing health awareness, particularly among Millennials and Gen Z, is driving a shift away from traditional beer toward low-calorie, low-alcohol, and non-alcoholic alternatives. This structural demographic shift pressures volume growth in the mainstream standard lager segment.
- Competition from Wine, Spirits, and RTD Beverages: Beer faces intense share-of-occasion competition from wine, premium spirits, hard seltzers, and ready-to-drink cocktails that offer perceived premiumness and lifestyle alignment. This fragmentation of the alcohol market constrains beer volume share.
Market Opportunities
- Non-Alcoholic Beer Mainstreaming: Growing health awareness and the sober-curious movement are driving mainstream adoption of non-alcoholic beer. Major brewers are expanding their zero-alcohol portfolios with premium variants that closely replicate the taste and experience of traditional beer, broadening the addressable consumer base across age groups and occasions.
- E-commerce and Direct-to-Consumer Channels: The regulatory easing of direct-to-consumer alcohol shipping in over 40 US states creates a new high-margin revenue channel for craft brewers. Online subscription clubs for craft beers, limited-edition releases, and brewery merchandise expand addressable revenue.
Market Challenges
- Commodity Input Cost Volatility: Beer producers face cost pressures from barley and hops price volatility, aluminum can price fluctuations, and glass cost escalation. Supply chain disruptions from weather, geopolitical factors, and agricultural cycle variations impact input cost predictability and margin management.
- Regulatory Complexity and State-by-State Compliance: The three-tier distribution system, along with varying state alcohol laws, taxation rates, labelling requirements, and tied house regulations, creates significant compliance costs and operational complexity, particularly for small craft producers seeking multi-state distribution.
Emerging Market Trends
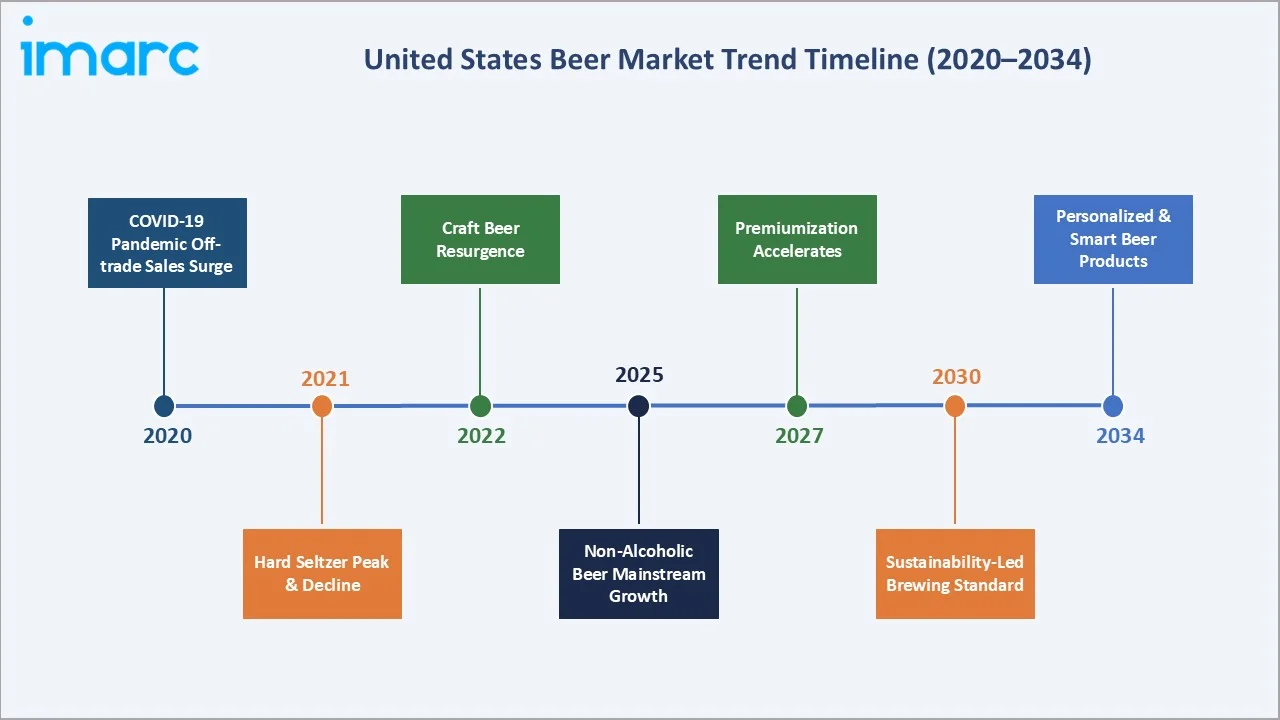
1. Non-Alcoholic Beer Becomes a Mainstream Category
The sober-curious movement and growing health awareness are transforming non-alcoholic beer from a niche product into a mainstream category. Brewing technology advances now replicate the flavor complexity of traditional beers, enabling premium positioning. Blue Moon Non-Alcoholic and Heineken 0.0 both entered the top non-alcoholic beverage rankings within their first year of launch.
2. Premiumization and Craft Beer Innovation Driving Value Growth
Despite volume pressures from health consciousness, the US beer market is growing in revenue value terms driven by premiumization. Consumers are trading up to premium lagers, craft IPAs, barrel-aged stouts, and imported specialty beers. Limited-edition brewery releases, seasonal variants, and collaboration beers command significant price premiums over standard lager.
3. Sustainable Brewing and Eco-Packaging as Competitive Differentiator
Sustainability credentials are becoming a key purchase driver, particularly among younger consumers. Molson Coors committed USD 85 million to eliminating plastic six-pack rings. AB InBev targets 100% renewable electricity for global operations. Breweries with verifiable green credentials gain shelf positioning and ESG investment appeal.
4. Data-Driven Direct-to-Consumer and Digital Marketing
Digital transformation through mobile apps, loyalty programs, and data analytics is enabling brewers to personalize consumer engagement. Direct-to-consumer craft beer subscription services are creating recurring high-margin revenue streams outside traditional distribution channels.
Industry Value Chain Analysis
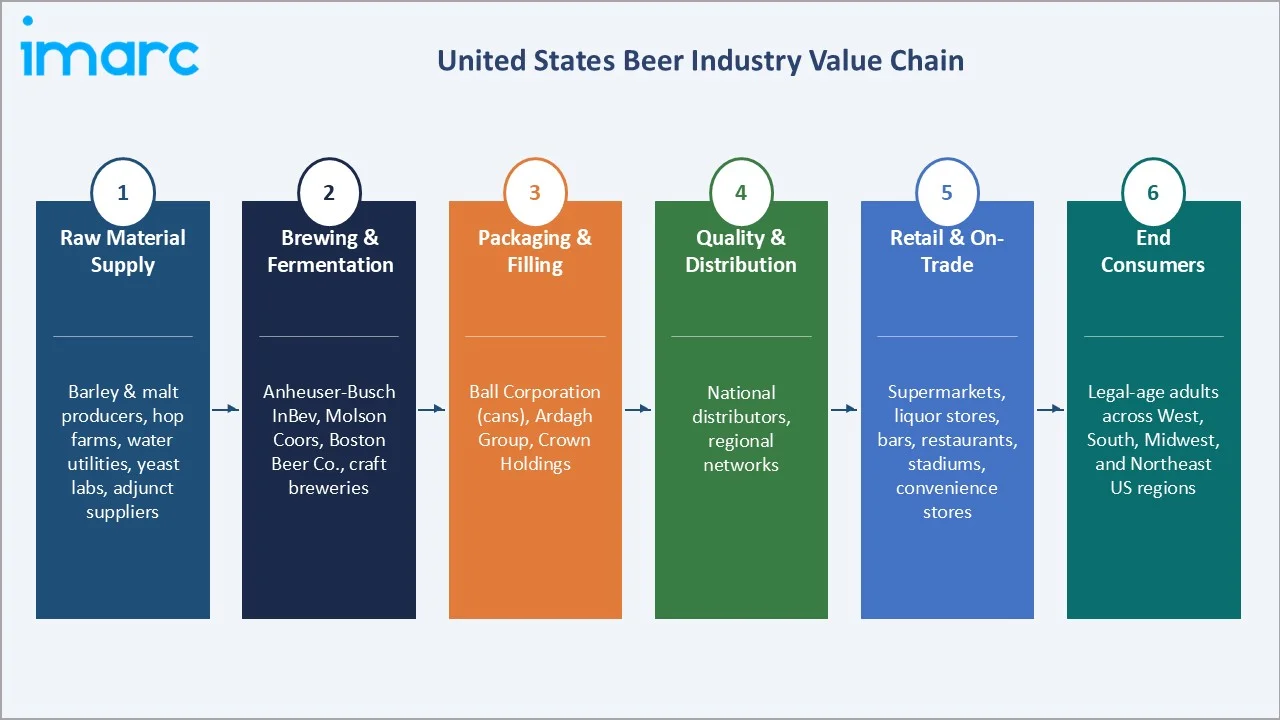
The United States beer industry value chain spans six stages from raw agricultural input through end-consumer delivery. Brewing and fermentation, combined with packaging, capture the highest value-add margins, while premium retail positioning and on-trade venue partnerships generate significant brand equity that differentiates commodity producers from premium and craft competitors.
|
Stage |
Key Players / Examples |
|
Raw Material Supply |
Barley & malt producers, hop farms, water utilities, yeast labs, adjunct suppliers |
|
Brewing & Fermentation |
Anheuser-Busch InBev, Molson Coors, Boston Beer Co., craft breweries |
|
Packaging & Filling |
Ball Corporation (cans), Ardagh Group, Crown Holdings |
|
Quality & Distribution |
National distributors, regional networks |
|
Retail & On-Trade |
Supermarkets, liquor stores, bars, restaurants, stadiums, convenience stores |
|
End Consumers |
Legal-age adults across West, South, Midwest, and Northeast US regions |
Vertically integrated macro-brewers with captive malt production, company-owned distribution in permitted states, and large-format retail partnerships achieve cost structures that smaller craft producers cannot match at volume. However, craft brewers command 2-4x higher per-unit revenue through direct-to-consumer taproom sales and specialty retail channels.
Technology Landscape in the United States Beer Industry
Advanced Brewing Technology and Quality Control
Continuous fermentation systems, high-gravity brewing with downstream dilution, and closed-loop process control systems enable macro-brewers to achieve consistent product quality at industrial scale with 20-30% lower water and energy consumption versus legacy open-fermentation systems. Automated sensory analysis and AI-driven recipe optimization are accelerating new product development.
Packaging Innovation: Aluminum Can and Glass Technology
Ball Corporation and Crown Holdings are developing lightweight aluminum can technology with enhanced barrier coatings that extend beer shelf life to 120+ days without refrigeration, enabling direct-to-consumer e-commerce shipping. Smart packaging with QR-coded traceability enables brewers to communicate provenance, ingredient sourcing, and sustainability certification directly to consumers.
Digital Distribution and B2B Platforms
AB InBev's BEES digital B2B ordering platform and Molson Coors's Salesforce-integrated route-to-market systems are transforming distributor relationships. Digital platforms enable real-time inventory visibility, dynamic pricing, and predictive demand analytics, reducing out-of-stocks and improving working capital efficiency across the distribution chain.
Market Segmentation Analysis
The report covers the following segments:
|
Segment Category |
Leading Segment |
Market Share |
Year |
|
Product Type |
Standard Lager |
46.8% |
2025 |
|
Packaging |
Glass |
41.6% |
2025 |
|
Production |
Macro-brewery |
🔒 |
2025 |
|
Alcohol Content |
High |
🔒 |
2025 |
|
Flavor |
Unflavored |
🔒 |
2025 |
|
Distribution Channel |
Supermarkets and Hypermarkets |
🔒 |
2025 |
|
Region |
West |
29.6% |
2025 |

By Product Type
To access detailed market analysis, Request Sample
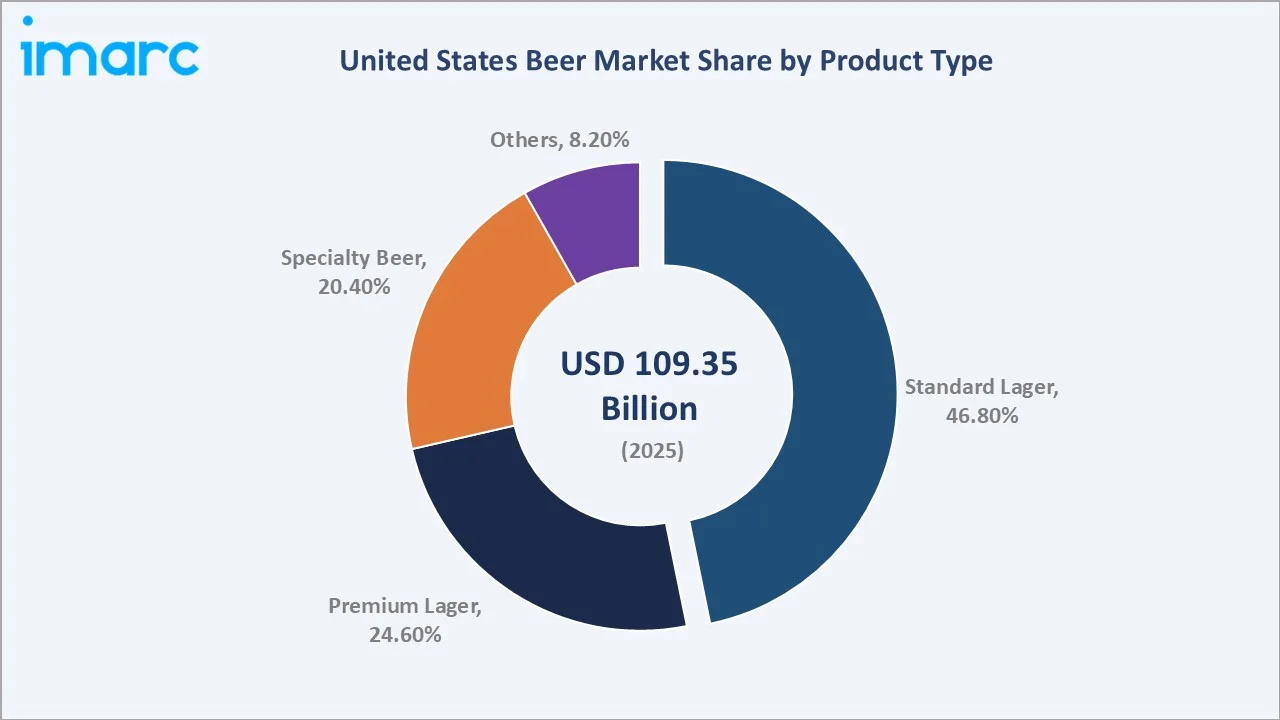
Standard lager commands a 46.8% majority share in 2025 owing to its fundamental consumer accessibility, broad availability across all retail channels, and the dominant brand strength of Budweiser, Coors Light, and Miller Lite. Standard lager is the default specification for sports venues, casual dining, and mass retail across all US regions.
Premium lager at 24.6% in 2025 captures the premiumization trend as consumers trade up to Heineken, Corona, and Stella Artois at higher price points. Specialty beer at 20.4% is the fastest-growing product segment, driven by craft brewery expansion, IPAs, stouts, and sour ales commanding premium retail pricing. Others at 8.2% includes malt beverages and non-alcoholic variants growing rapidly.
By Packaging
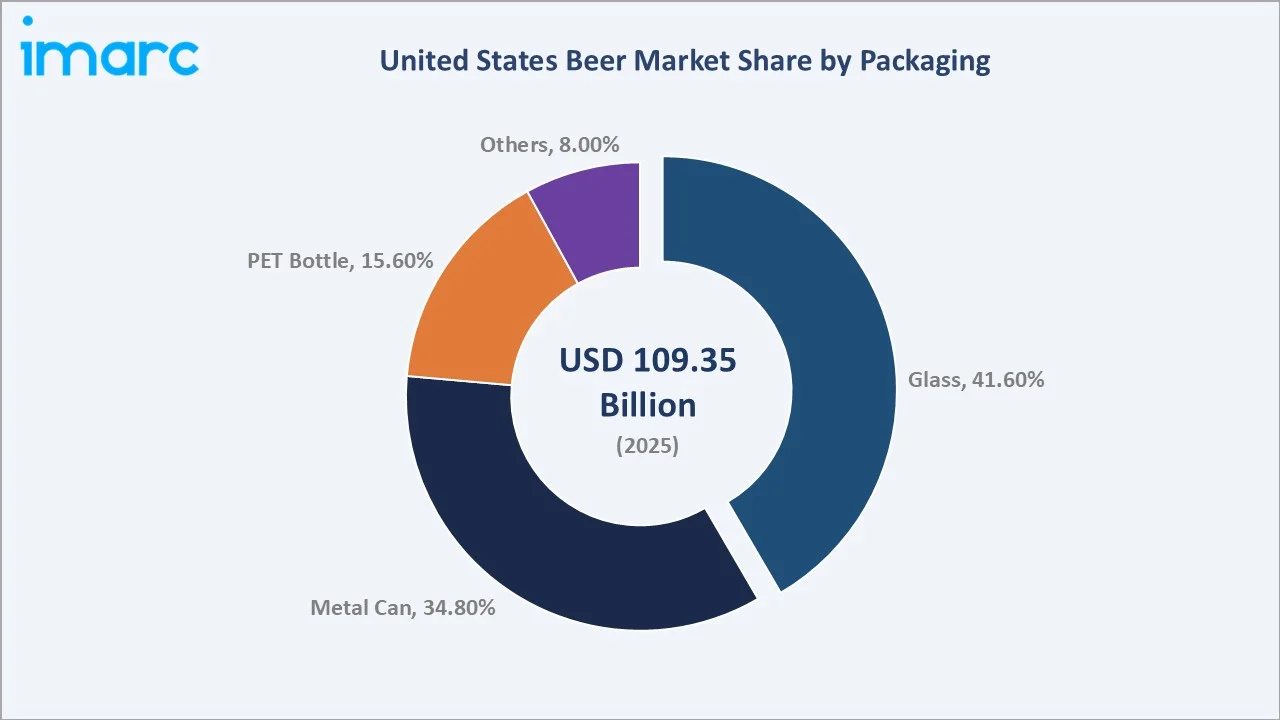
Glass packaging dominates at 41.6% in 2025, preferred for premium, craft, and imported beers were bottle aesthetics signal quality. On-trade venues and specialty retailers overwhelmingly use glass, reinforcing its market leadership at premium price points and craft occasions.
Metal can at 34.8% in 2025 is the fastest-growing packaging format, driven by sustainability advantages, superior portability, and growing craft brewery adoption. PET bottle at 15.6% serves the value and convenience segments, particularly for large-format retail. Others at 8.0% includes kegs and innovative packaging emerging in hospitality channels.
Regional Market Insights
|
Region |
Share (2025) |
Key Growth Drivers |
|
West |
29.6% |
Craft beer culture, California premium demand, Pacific Northwest microbreweries |
|
South |
27.8% |
High-volume consumption, Texas/Florida growth, sports and outdoor events |
|
Midwest |
23.4% |
Heritage brewing culture, Chicago & St. Louis brewery hubs, sports bars |
|
Northeast |
19.2% |
Urban craft beer demand, NYC bar scene, Boston microbrewery cluster |
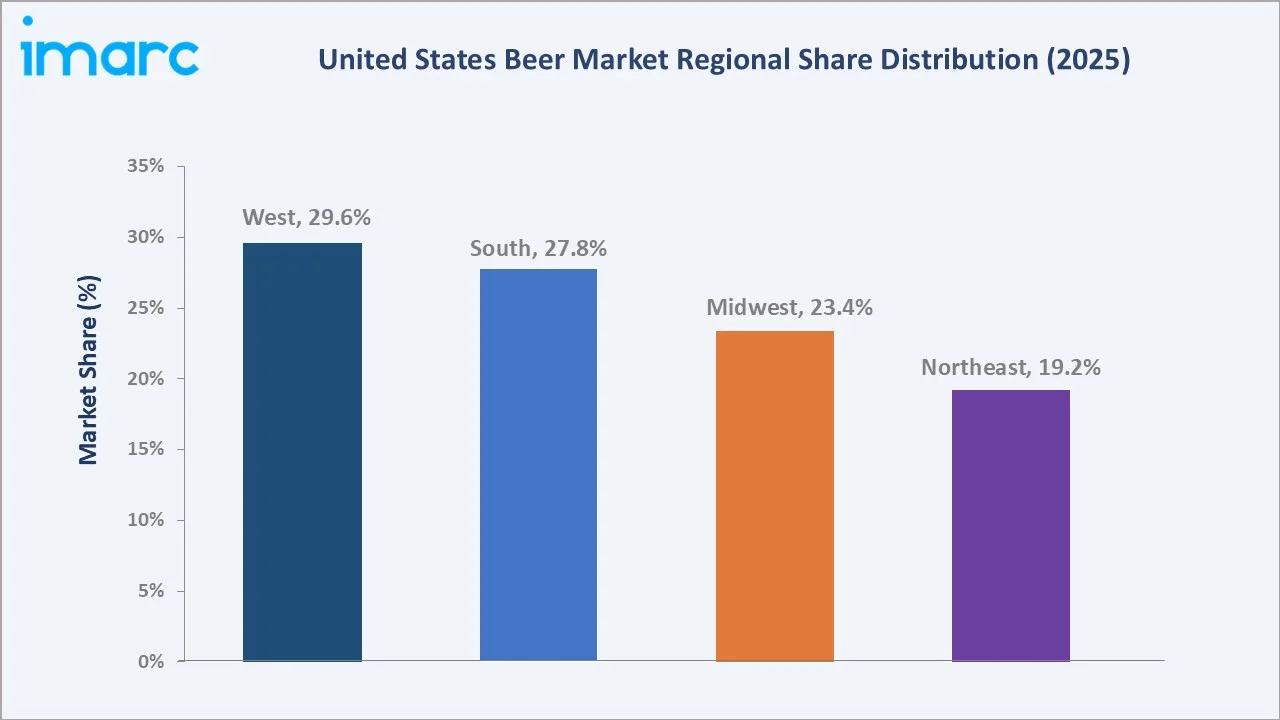
The West's 29.6% market leadership in 2025 is driven by California's over 1,000 craft breweries, the Pacific Northwest's world-leading per-capita craft beer consumption, and premium consumer spending demographics in Seattle, Portland, Denver, and San Francisco. The region commands the highest average retail beer price per unit in the country.
The South at 27.8% benefits from strong high-volume mainstream beer consumption driven by outdoor culture, sports events, and a large young adult population in Texas, Florida, Georgia, and the Carolinas. The Midwest at 23.4% anchors heritage brewing in Chicago, St. Louis, and Milwaukee, with growing craft scenes in smaller metros. The Northeast at 19.2% hosts premium urban beer consumption in New York City and Boston's dense craft brewery cluster.
Competitive Landscape
The United States beer market is moderately concentrated, with two macro-brewery players — Anheuser-Busch InBev and Molson Coors — commanding a combined estimated 60-65% volume share, while Constellation Brands leads the premium import segment.
|
Company Name |
Key Products |
Market Position |
Global Strategic Focus |
|
Anheuser-Busch InBev |
Budweiser, Bud Light, Michelob Ultra, Stella Artois |
Leader |
US volume leader; macro & premium; national distribution |
|
Molson Coors Beverage Company |
Coors Light, Miller Lite, Blue Moon |
Leader |
Second largest; mainstream & craft; sustainability |
|
Constellation Brands |
Corona, Modelo, Pacifico |
Leader |
Import & premium leader; fastest revenue growth |
|
Boston Beer Company |
Samuel Adams, Dogfish Head |
Leader |
Craft pioneer; beyond-beer innovation; premium positioning |
|
Heineken USA |
Heineken, Dos Equis, Tecate, Amstel Light |
Leader |
Premium import focus; premium lager segment |
|
Pabst Brewing Company |
Pabst Blue Ribbon, Olympia, Schlitz, Old Style |
Challenger |
Value segment; nostalgia-driven; millennial revival |
|
Diageo Beer Company USA |
Guinness, Smithwick's, Harp Lager |
Challenger |
Specialty & stout expertise; on-trade stronghold |
The competitive positioning of key United States beer market participants across global market presence and strategic investment dimensions in 2025. The key players include Anheuser-Busch InBev, Molson Coors Beverage Company, Constellation Brands, Boston Beer Company, Heineken USA, Pabst Brewing Company, Diageo Beer Company USA, and others.
Key Company Profiles
Anheuser-Busch InBev
Anheuser-Busch InBev is the world's largest brewer and the dominant player in the United States beer market, with a portfolio spanning value, mainstream, and premium segments. Its US business operates across multiple large-scale breweries and holds the largest combined market share through brands including Budweiser, Bud Light, Michelob Ultra, and Stella Artois.
- Product Portfolio: Offers Budweiser, Bud Light, Natural Light, Michelob Ultra, Stella Artois, Goose Island craft, and Bud Zero non-alcoholic for the US beer market.
- Recent Developments: In May 2025, Anheuser-Busch announced a $300 million investment to expand and modernize its manufacturing operations across the United States, reinforcing its long-term commitment to domestic production. The initiative focuses on upgrading facilities, advancing technology capabilities, and strengthening workforce development through training programs and veteran employment initiatives.
- Strategic Focus: AB InBev's US strategy focuses on defending its mainstream lager volume leadership while aggressively growing above-premium and craft segments through acquisitions and capturing the non-alcoholic beer opportunity through dedicated zero-alcohol product lines.
Molson Coors Beverage Company
Molson Coors is the second-largest beer company in the United States, operating the largest single US brewery in Golden, Colorado, following a multi-million modernization project. Its portfolio spans mainstream, premium, craft, and non-alcoholic segments across all US regions.
- Product Portfolio: Offers Coors Light, Miller Lite, Coors Banquet, Blue Moon, Leinenkugel's, and non-alcoholic Blue Moon N/A for the United States beer market.
- Recent Developments: In March 2022, Molson Coors committed USD 85 million to eliminate plastic six-pack rings from its North American brands by end-2025.
- Strategic Focus: Molson Coors focuses on mainstream volume defense through aggressive price investment and innovation in above premium and non-alcoholic segments where it sees the most sustainable long-term growth.
Constellation Brands
Constellation Brands is the leading premium import beer company in the United States, with its Mexican beer portfolio, Corona, Modelo Especial, and Pacifico, driving the fastest revenue growth of any major US beer player. Modelo Especial overtook Bud Light as the top-selling US beer brand by dollar value in 2023, cementing Constellation's premium positioning.
- Product Portfolio: Offers Corona Extra, Modelo Especial, Modelo Negra, Pacifico, Victoria, and expanding craft acquisitions for the US beer market.
- Recent Developments: In March 2026, Constellation Brands entered into an agreement to acquire the remaining stake in HOPWTR, a fast-growing premium non-alcoholic beverage brand, thereby taking full ownership after its initial investment in 2021. The acquisition strengthens Constellation’s presence in the rapidly expanding non-alcoholic segment, aligning with shifting consumer preferences toward moderation and functional beverages.
- Strategic Focus: Constellation focuses on premiumizing the Mexican beer category while expanding its footprint in high-growth markets including Texas, California, and the Sun Belt.
Market Concentration Analysis
The United States beer market is moderately concentrated at the macro level, with AB InBev and Molson Coors together commanding approximately 60-65% of volume share but increasingly fragmented in value terms as craft and premium imports take a disproportionate revenue share. The craft segment alone contributes over 25% of retail dollar value despite representing only ~13% of volume.
Consolidation through acquisition is ongoing: AB InBev acquired Goose Island, 10 Barrel, and other craft breweries; Constellation acquired Funky Buddha and other regional craft brands; Tilray acquired four craft breweries from Molson Coors to rise through craft segment rankings. This dual trend of macro-brewery consolidation and craft brewery fragmentation is reshaping the competitive structure.
Investment & Growth Opportunities
Fastest-Growing Segments
Specialty beer at ~3.2% CAGR through 2034 is the highest-growth product segment, driven by craft brewery expansion, the IPA category's sustained popularity, and innovation in sour, barrel-aged, and experimental styles. PET bottle packaging at ~3.5% CAGR represents the fastest packaging growth, driven by e-commerce compatibility and convenience positioning. Non-alcoholic beer is tracking above 15% annual growth as a super-segment.
Emerging Opportunities
The direct-to-consumer e-commerce channel, now legal for beer shipping in over 40 states, represents a significant untapped opportunity for premium craft breweries. Digital subscription models with curated monthly craft beer boxes command premium pricing, build brand loyalty, and generate recurring revenue streams outside the traditional three-tier distribution system.
Venture & Investment Trends
Private equity interest in craft brewery platforms is growing consolidation of regional craft brands into multi-brand craft portfolio companies is an active M&A trend. ESG-driven investment in sustainable brewing technology, including solar-powered breweries, water recycling systems, and carbon-neutral malt sourcing, is generating both operational cost savings and premium brand positioning.
Future Market Outlook (2026-2034)
The United States beer market is forecast to expand from USD 109.35 Billion in 2025 to USD 132.99 Billion by 2034 at a CAGR of 2.20%. This steady growth reflects the market's consumer staple demand characteristics and the positive revenue mix shift toward higher-value premium and craft categories.
Three structural forces will most significantly shape the United States beer market through 2034. The non-alcoholic beer mainstreaming will expand the addressable beer occasion beyond traditional alcoholic consumption, adding new dayparts and demographics. Craft and premium beer premiumization will continue lifting average revenue per unit even as mainstream volume growth moderates. Digital and direct-to-consumer channel development will create new high-margin revenue streams outside the legacy three-tier distribution system.
Research Methodology
Primary Research
Primary research encompassed over 50 structured interviews with US beer industry stakeholders, including senior commercial managers at major breweries, craft brewery operators, retail buyers at major supermarket chains, distributor executives, and consumer behavior specialists at US beverage consultancies. Primary data validated market sizing, product type and packaging segment shares, regional demand estimates, and technology adoption timelines.
Secondary Research
Key secondary sources include Brewers Association Annual Statistical Briefing, Beer Institute Annual Report, TTB (Alcohol and Tobacco Tax and Trade Bureau) statistical releases, US Census Bureau consumer expenditure data, Nielsen and IRI off-premise beer scan data, IWSR Drinks Market Analysis, and trade publications including Brewbound, Beer Business Daily, and Beverage Industry magazine.
Forecasting Models
Market size estimations and growth projections were derived using a combination of top-down and bottom-up forecasting models, incorporating GDP growth rates, disposable income trends, legal drinking age population projections, on-trade recovery indices, and historical category evolution patterns. Scenario analysis across base, optimistic, and conservative cases accounted for regulatory, macroeconomic, and consumer trend uncertainty.
United States Beer Market Report Scope:
| Report Features | Details |
|---|---|
| Base Year of the Analysis | 2025 |
| Historical Period | 2020-2025 |
| Forecast Period | 2026-2034 |
| Units | Billion USD |
| Scope of the Report | Exploration of Historical Trends and Market Outlook, Industry Catalysts and Challenges, Segment-Wise Historical and Future Market Assessment:
|
| Product Types Covered | Standard Lager, Premium Lager, Specialty Beer, Others |
| Packagings Covered | Glass, PET Bottle, Metal Can, Others |
| Productions Covered | Macro-Brewery, Micro-Brewery, Others |
| Alcohol Contents Covered | High, Low, Alcohol-Free |
| Flavors Covered | Flavored, Unflavored |
| Distribution Channels Covered | Supermarkets and Hypermarkets, On-Trades, Specialty Stores, Convenience Stores, Others |
| Regions Covered | Northeast, Midwest, South, West |
| Companies Covered | Anheuser-Busch InBev, Molson Coors Beverage Company, Constellation Brands, Boston Beer Company, Heineken USA, Pabst Brewing Company, Diageo Beer Company USA, etc. |
| Customization Scope | 10% Free Customization |
| Post-Sale Analyst Support | 10-12 Weeks |
| Delivery Format | PDF and Excel through Email (We can also provide the editable version of the report in PPT/Word format on special request) |
Key Benefits for Stakeholders:
- IMARC’s industry report offers a comprehensive quantitative analysis of various market segments, historical and current market trends, market forecasts, and dynamics of the United States beer market from 2020-2034.
- The research report provides the latest information on the market drivers, challenges, and opportunities in the United States beer market.
- Porter's five forces analysis assists stakeholders in assessing the impact of new entrants, competitive rivalry, supplier power, buyer power, and the threat of substitution. It helps stakeholders to analyze the level of competition within the United States beer industry and its attractiveness.
- The competitive landscape allows stakeholders to understand their competitive environment and provides an insight into the current positions of key players in the market.
Frequently Asked Questions About the United States Beer Market Report
The United States beer market reached USD 109.35 Billion in 2025, reflecting consistent demand from mainstream lager consumption, craft beer premiumization, and the growing on-trade recovery following the post-pandemic normalization.
The market is projected to reach USD 132.99 Billion by 2034, growing at a CAGR of 2.20% during 2026-2034, driven by premiumization, craft beer expansion, non-alcoholic beer growth, and e-commerce channel development.
Standard lager leads with a 46.8% product type share in 2025, driven by the commanding brand strength of Budweiser, Coors Light, and Miller Lite, which maintain ubiquitous retail presence and strong sports occasion associations.
Glass packaging dominates at 41.6% in 2025, preferred for premium, craft, and imported beers where bottle presentation signals quality. Metal cans at 34.8% are the fastest-growing format driven by sustainability and portability.
The West leads with a 29.6% regional share in 2025, driven by California's craft brewery density, Pacific Northwest premium beer culture, and Colorado's central role in the US craft beer movement.
Leading companies include Anheuser-Busch InBev, Molson Coors Beverage Company, Constellation Brands, The Boston Beer Company, Heineken USA, Pabst Brewing Company, and Diageo Beer Company USA.
Key consumption occasions include sports viewing, casual dining, outdoor and recreational events, on-trade bar and restaurant consumption, home entertainment, and the growing craft brewery taproom experience economy.
The health and wellness trend is driving growth in low-calorie lagers, low-alcohol variants, and non-alcoholic beer, while putting volume pressure on mainstream standard lager. Non-alcoholic beer grew over 30% in 2024, attracting a new sober-curious consumer demographic.
Craft beer is independently produced in smaller volumes, emphasizing unique flavors, local ingredients, and brewing artistry. Standard lager is mass-produced by macro-breweries at scale, prioritizing consistency, distribution reach, and price accessibility over flavor complexity.
Need more help?
- Speak to our experienced analysts for insights on the current market scenarios.
- Include additional segments and countries to customize the report as per your requirement.
- Gain an unparalleled competitive advantage in your domain by understanding how to utilize the report and positively impacting your operations and revenue.
- For further assistance, please connect with our analysts.
 Request Customization
 Speak to an Analyst
 Request Brochure
 Inquire Before Buying
Benefits of Customization
- Personalize this research
- Triangulate with your data
- Get data as per your format and definition
- Gain a deeper dive into a specific application, geography, customer, or competitor
- Any level of personalization
Get in Touch With Us
UNITED STATES
Phone: +1-201-971-6302
INDIA
Phone: +91-120-433-0800
UNITED KINGDOM
Phone: +44-753-714-6104
Email: [email protected]
Client Testimonials


.webp)


