
United States Digital OOH Advertising Market Size, Share, Trends and Forecast by Format Type, Application, End Use Industry, and Region, 2026-2034
United States Digital OOH Advertising Market Size, Share, Trends & Forecast (2026-2034)
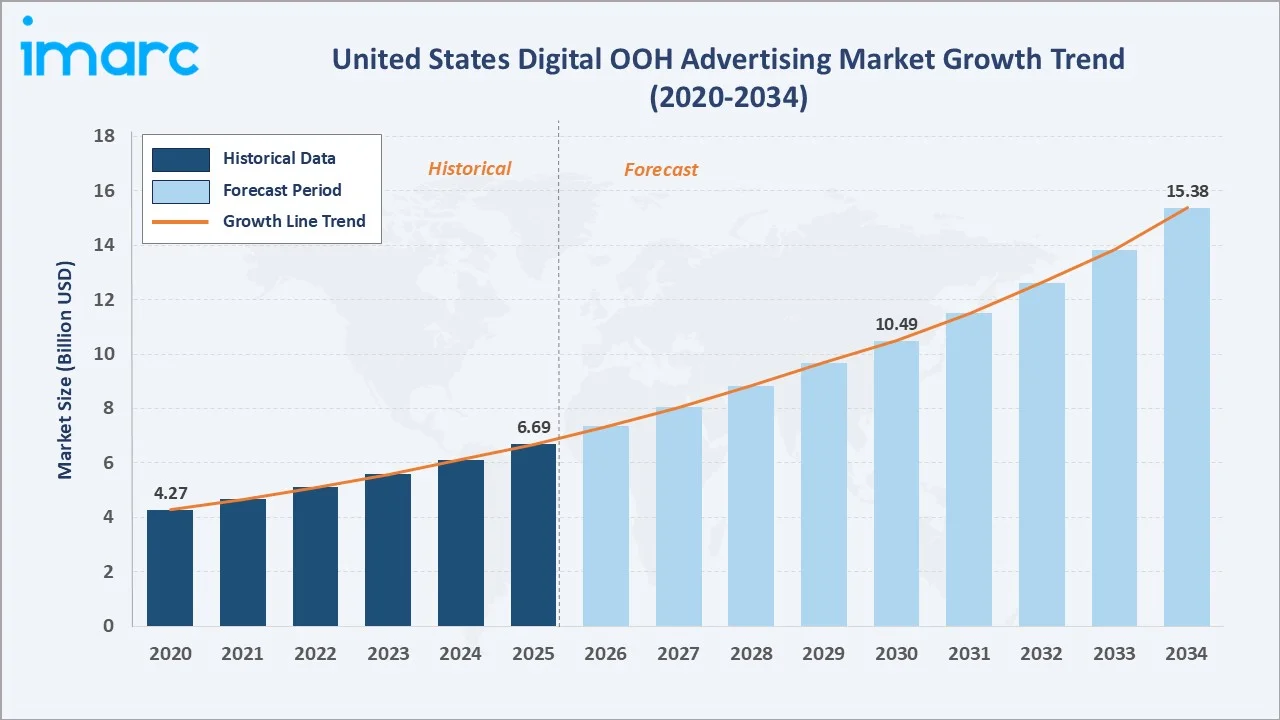
The United States digital OOH advertising market reached USD 6.69 Billion in 2025 and is projected to reach USD 15.38 Billion by 2034, growing at a CAGR of 9.40% during 2026-2034. The rapid adoption of programmatic digital OOH, enabling data-driven audience targeting, urban smart city infrastructure investment accelerating digital screen deployment, brands shifting advertising budgets from traditional to measurable digital formats, and AI-powered creative optimization improving DOOH campaign performance are the primary growth catalysts.
Market Snapshot
|
Metric |
Value |
|
Market Size (2025) |
USD 6.69 Billion |
|
Forecast Market Size (2034) |
USD 15.38 Billion |
|
CAGR (2026-2034) |
9.40% |
|
Base Year |
2025 |
|
Historical Period |
2020-2025 |
|
Forecast Period |
2026-2034 |
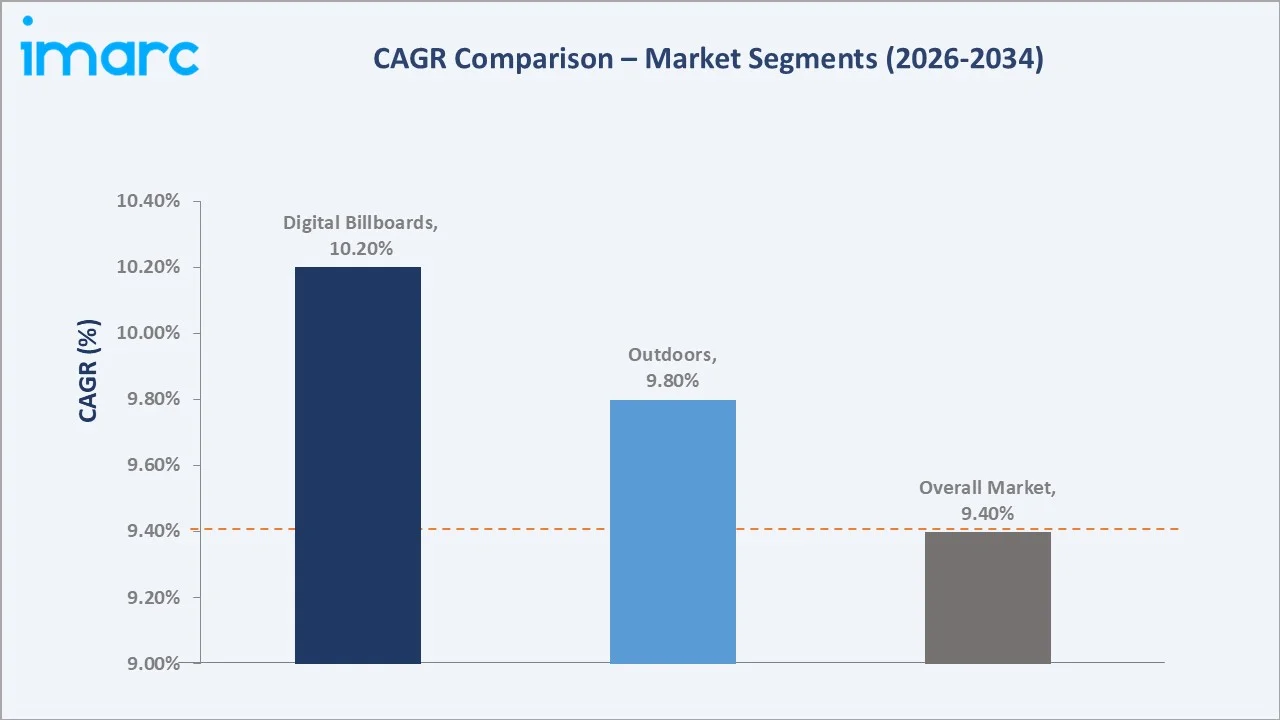
The South leads regionally with a 34.1% market share in 2025, driven by the region’s large highway corridor Digital OOH inventory across Texas, Florida, Georgia, and North Carolina, strong retail and quick-service restaurant advertiser demand, and growing smart city digital infrastructure investment. Digital billboards command the dominant 41.6% format share, reflecting the primacy of large-format roadside digital displays as the highest-reach and most visible digital OOH format across the US market. Outdoor at 68.7% reflects the primacy of roadside, transit, and street-level digital OOH placements as the core US digital OOH inventory category.
To get more information on this market, Request Sample
The United States digital OOH market is driven by three structural demand forces: the programmatic revolution enabling real-time, data-driven digital OOH audience buying that has made the format competitive with digital media on targeting precision; the ongoing conversion of the massive US traditional OOH billboard and transit display installed base from static to digital formats that creates organic revenue growth from higher rates per face; and the brand shift toward out-of-home advertising as a brand-safe, unskippable, and increasingly measurable advertising channel as digital media faces ad blocking, cookie deprecation, and platform brand safety concerns.
Executive Summary
The United States digital out-of-home advertising market is experiencing robust growth, driven by the convergence of programmatic technology enabling data-driven audience buying, the rapid digital conversion of the US’s extensive static OOH billboard and transit display network, and brands’ growing appreciation for digital OOH’s unique combination of mass reach, location relevance, brand safety, and increasing measurability. The market was valued at USD 6.69 Billion in 2025 and is forecast to reach USD 15.38 Billion by 2034, growing at a CAGR of 9.40%.
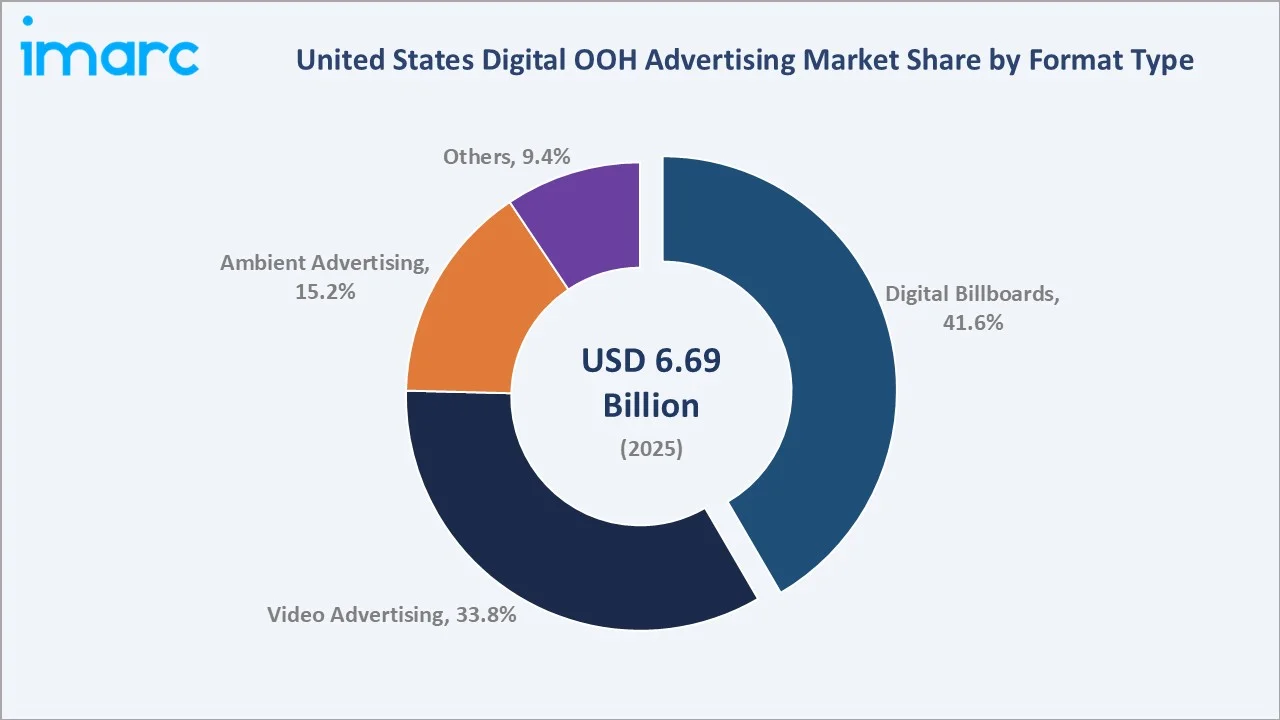
Digital billboards account for 41.6% of the format type segment in 2025, representing the primary driver of digital OOH revenue growth as roadside digital billboard conversion from static vinyl continues across major US highways, arterial roads, and urban corridors. Video advertising at 33.8% encompasses large-format video screens in high-footfall locations, including Times Square, sports stadiums, shopping centers, and major transit hubs. Outdoor at 68.7% encompasses roadside, transit, and street-level digital OOH placements, while indoor at 31.3% covers retail, airport, sports venue, and office building digital screen networks.
The South leads regionally at 34.1%, driven by its combination of the largest US highway digital OOH corridor inventory, strong retail and QSR advertiser demand, and growing smart city digital screen infrastructure investment. Key players compete across inventory scale, programmatic capability, data and audience analytics, and creative technology platform depth.
Key Market Insights
|
Insight |
Data |
||
|
Largest Format Type |
Digital Billboards – 41.6% share (2025) |
||
|
Second Largest Format Type |
Video Advertising – 33.8% share (2025) |
||
|
Largest Application |
Outdoor – 68.7% share (2025) |
||
|
Second Largest Application |
Indoor – 31.3% share (2025) |
||
|
Leading Region |
South – 34.1% share (2025) |
||
|
Top Companies |
Lamar Advertising Company, OUTFRONT Media Inc., JCDecaux SE, Broadsign International Holding Company |
||
Key Analytical Observations Supporting The Above Data:
- Digital billboards at 41.6% (2025) lead the format segment because large-format roadside digital displays generate the highest CPM rates, the widest reach per face, and the most compelling visual impact of any OOH format. Lamar Advertising’s 3,800+ digital billboard displays, Clear Channel’s Radar data-enabled digital network, and the ongoing conversion of static billboard faces to digital across every US market are collectively sustaining digital billboard revenue as the largest and fastest-growing digital OOH format category.
- Video advertising at 33.8% (2025) reflects the premium value of full-motion video digital OOH placements in iconic locations, including Times Square, sports stadium video boards, shopping center digital networks, and major transit hub video screens. The motion capability of video digital OOH enables advertising creative executions that deliver equivalent impact to television commercials in high-footfall public environments.
- Outdoor at 68.7% (2025) dominates the application segment as the US digital OOH market’s core revenue base is in roadside highway billboards and transit advertising, the two largest US OOH advertising format categories, both of which are outdoor placements. The scale of the US highway system and the enormous volume of daily vehicle traffic, creating roadside billboard audience impressions, ensure outdoor digital OOH maintains its dominant share through 2034.
- The South’s 34.1% share (2025) reflects the region’s position as the largest US population region, the highest highway vehicle miles travelled of any US region, creating maximum billboard impression delivery, and the concentration of the US QSR, retail, and entertainment advertiser categories that are the highest-spending DOOH verticals.
United States Digital OOH Advertising Market Overview
Digital out-of-home advertising encompasses all forms of advertising media delivered via digital screens in publicly accessible locations, including digital billboards, transit digital displays, street furniture screens, airport digital networks, sports venue video boards, retail digital networks, and any location-based digital display delivering advertising content to audiences in out-of-home environments. The US digital OOH market is the world’s largest national digital OOH market by revenue, reflecting the country’s extensive highway billboard inventory, the world’s most commercially developed transit advertising ecosystem, and the most sophisticated programmatic advertising infrastructure in any OOH market globally.
Macroeconomic drivers include the Out of Home Advertising Association of America (OAAA) reporting US OOH advertising revenue growing at its fastest sustained rate in two decades, with digital OOH now representing over 35% of total US OOH revenue and growing; and the US advertising market’s structural shift toward addressable, measurable, and brand-safe media formats creating structural digital OOH tailwinds as brands diversify from social media and programmatic digital display channels facing brand safety, fraud, and consumer privacy headwinds.
Market Dynamics
To evaluate market opportunities, Request Sample
Market Drivers
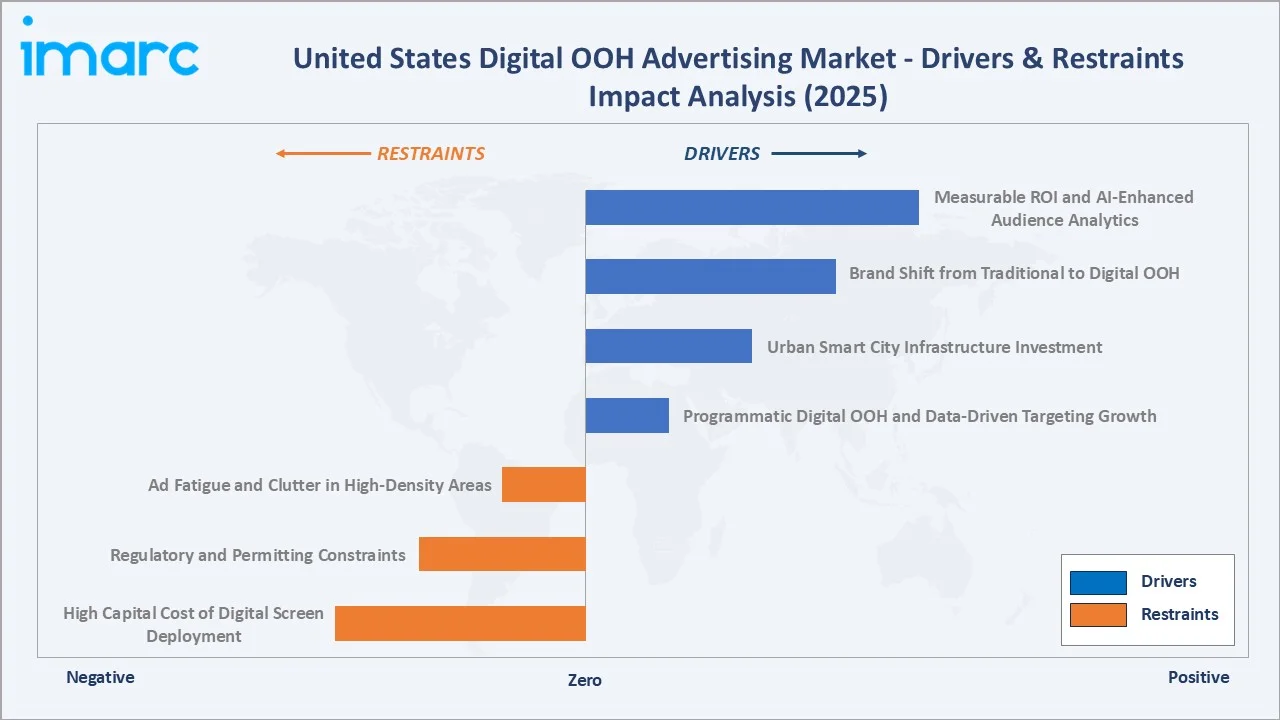
- Programmatic Digital OOH and Data-Driven Targeting Growth: The adoption of programmatic technology in digital OOH advertising has fundamentally transformed the format from a traditional mass-reach media buy to a data-addressable, real-time-optimized advertising channel. Programmatic digital OOH platforms enable brands to purchase digital OOH impressions in real time based on audience demographic data, location context, weather conditions, time of day, and proximity to retail locations.
- Urban Smart City Infrastructure Investment: US cities’ smart city transformation programs are deploying digital screens across public infrastructure, including bus shelters, kiosks, wayfinding systems, and urban panels as part of connected city initiatives that simultaneously serve civic communication and generate advertising revenue through media owner partnerships.
- Brand Shift from Traditional to Digital OOH: The advertising industry’s structural migration from traditional media to digital formats is now benefiting digital OOH as brands that have progressively reduced television, print, and radio budgets are allocating a portion of their freed budget to digital OOH as a brand-safe, unskippable, and increasingly measurable complement to their digital advertising mix.
- Measurable ROI and AI-Enhanced Audience Analytics: The integration of mobile location data, retail transaction data, and audience measurement technologies into digital OOH attribution modelling is progressively enabling DOOH advertisers to measure campaign impact on footfall, online search behavior, and purchase conversion with increasing accuracy.
Market Restraints
- High Capital Cost of Digital Screen Deployment: Converting static billboard or transit advertising faces to digital requires significant capital investment in LED display panels, power infrastructure, content management systems, and structural modifications. A single large-format digital billboard conversion can cost USD 200,000–500,000, and the US’s approximately 354,000 traditional billboard faces represent a capital conversion program of immense scale.
- Regulatory and Permitting Constraints: The US OOH industry operates under a complex patchwork of federal, state, and local regulations that significantly constrain digital OOH expansion. The Highway Beautification Act restricts new billboard construction along interstate highways, local zoning ordinances in many municipalities limit digital screen brightness, motion, and new permit issuance, and some cities have maintained restrictions on new billboard construction that limit digital OOH inventory expansion in otherwise high-value markets.
- Ad Fatigue and Clutter in High-Density Areas: In high-density urban markets with heavy digital OOH screen concentration, the proliferation of digital displays risks reducing individual screen impact as audiences become habituated to the medium. Times Square’s extreme digital display density has created an environment where individual advertiser messages compete intensely for limited consumer attention, reducing the marginal value of additional screen capacity in the most saturated US digital OOH markets.
Market Opportunities
- Retail Media Network Digital OOH Integration: The explosion of retail media networks is creating a new high-growth indoor digital OOH segment that delivers location-specific advertising to shoppers at the point of purchase decision. Retail media digital OOH combines first-party shopper data, purchase attribution, and last-mile advertising reach in a format that delivers measurable conversion impact unachievable by any other digital OOH category.
- Contextual and Dynamic Creative Optimization: AI-powered dynamic creative optimization for digital OOH is enabling advertisers to deploy multiple contextually relevant creative executions that automatically adjust based on real-time data inputs, including weather, time of day, local events, and audience demographics. McDonald’s temperature-responsive digital OOH creative serving hot coffee messages in cold weather and cold beverage messages in warm weather, and the ability to swap creative in real time based on audience measurement, are creating new premium digital OOH campaign formats that command higher CPMs than static creative executions.
Market Challenges
- Cookie Deprecation and Cross-Channel Measurement Standardization: While digital OOH benefits from advertisers' concerns about cookie deprecation in digital display, its own lack of standardized impression and attribution measurement limits its competitiveness in performance advertising budgets. The absence of universal digital OOH impression and attribution measurement standards equivalent to digital media’s viewability and conversion tracking frameworks limits digital OOH’s competitiveness in performance advertising budget allocation, requiring the industry to standardize measurement methodologies across the fragmented US media owner landscape.
- Content Relevance and Creative Adaptation Requirements: Effective digital OOH advertising requires creative assets specifically designed for the medium’s unique characteristics, including extended viewing distance, brief dwell time in transit environments, and the outdoor ambient lighting conditions that affect screen legibility. Many advertisers repurpose television or digital display creative for digital OOH without format-specific adaptation, reducing campaign effectiveness and limiting the perceived value of DOOH as an advertising medium, creating an ongoing advertiser education and creative quality challenge for media owners.
Emerging Market Trends
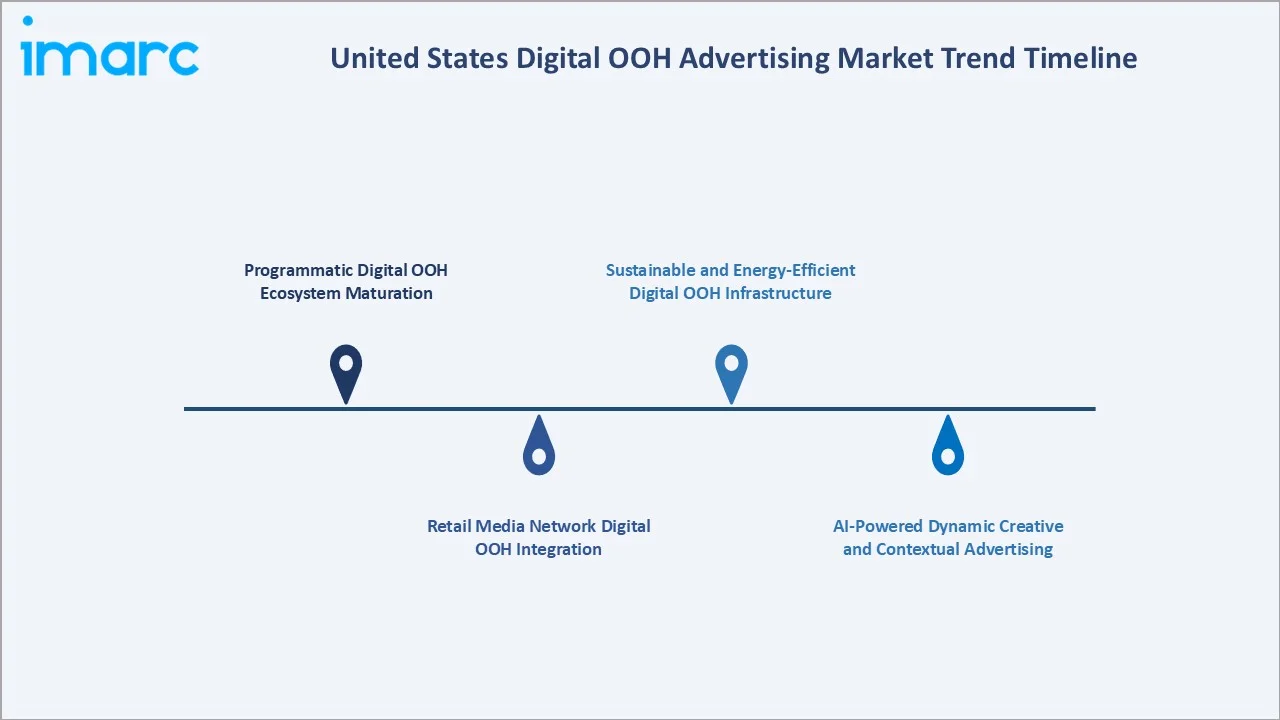
1. Programmatic Digital OOH Ecosystem Maturation
The US programmatic digital OOH ecosystem is maturing rapidly, with major DSPs including The Trade Desk and Google DV360, integrating digital OOH inventory alongside digital media for unified cross-channel programmatic campaign execution. Supply-side platforms, including Vistar Media, Place Exchange, and Broadsign Connect, are aggregating digital OOH inventory from multiple media owners into single programmatic marketplaces accessible to digital media buyers, removing the traditional manual buying process that had limited digital OOH’s accessibility to digital-first media planners.
2. Retail Media Network Digital OOH Integration
The integration of digital OOH advertising into retail media networks is the most transformative structural development in indoor digital OOH advertising, with Walmart’s digital screen network, Target's Roundel in-store digital advertising network, and Amazon’s Fresh grocery digital screens each creating closed-loop advertising ecosystems that combine first-party purchase data with physical screen placement at the point of purchase. These retail media digital OOH networks are attracting CPG advertiser budgets previously allocated to shopper marketing and in-store promotions, creating a structurally new digital OOH revenue category with above-market growth rates.
3. AI-Powered Dynamic Creative and Contextual Advertising
AI-powered creative management platforms are enabling digital OOH advertisers to deploy dynamic creative systems that automatically generate and serve contextually optimized ad versions based on real-time environmental and audience data inputs. Weather-triggered creative, event-proximity creative, and audience-demographic-responsive messaging are transitioning from premium campaign innovations to programmatic digital OOH standard capabilities accessible to brands of all scales.
4. Sustainable and Energy-Efficient Digital OOH Infrastructure
US digital OOH operators are investing in energy-efficient LED display technologies and renewable energy integration for their digital screen networks, responding to brand advertiser sustainability requirements and operating cost reduction objectives. Lamar Advertising’s solar-powered digital billboard program and JCDecaux SE’s smart city infrastructure, designed to energy performance standards, exemplify the industry’s sustainability investment trend that is becoming a brand advertiser procurement requirement in US RFP processes.
Industry Value Chain Analysis
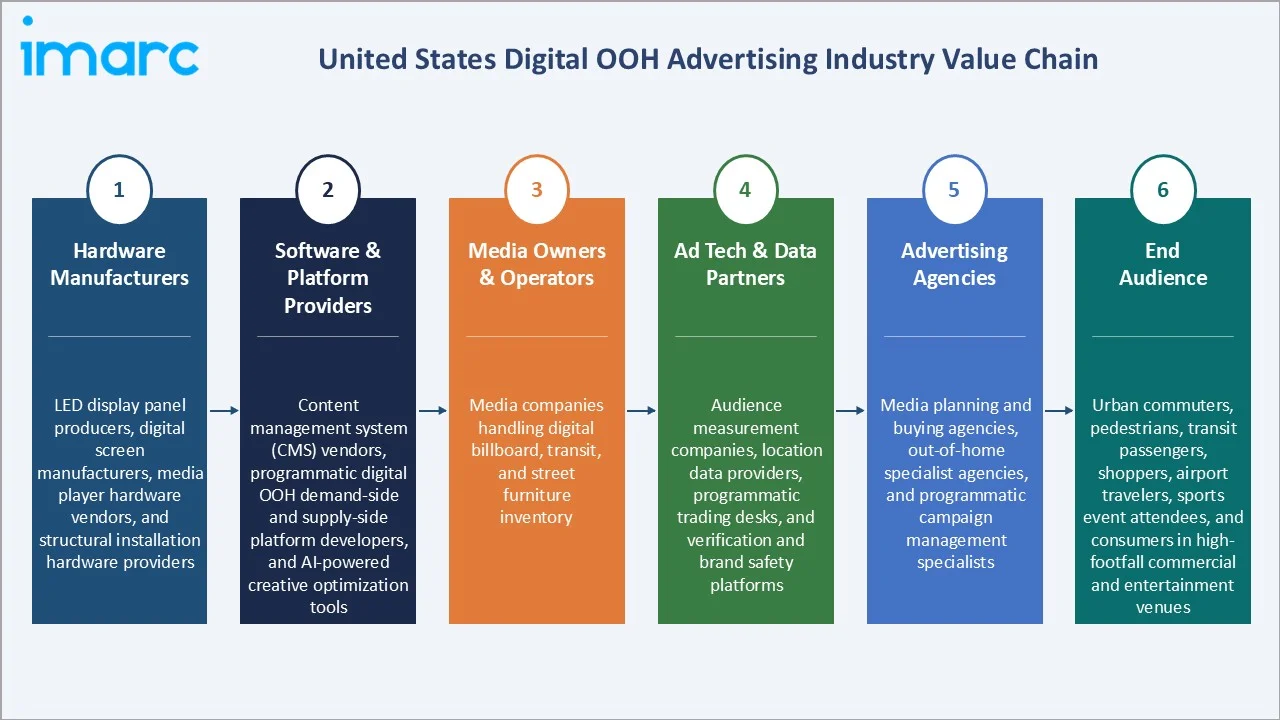
The US digital OOH advertising value chain spans from hardware manufacturers producing the digital display infrastructure through software platform providers enabling content management and programmatic trading, media owner operators managing the screen networks, ad tech and data partners enabling audience targeting, advertising agencies creating and placing campaigns, brand advertisers funding the ecosystem, and ultimately the audiences whose attention generates the advertising value that underpins DOOH revenue.
|
Stage |
Key Players / Examples |
|
Hardware Manufacturers |
LED display panel producers, digital screen manufacturers, media player hardware vendors, and structural installation hardware providers |
|
Software & Platform Providers |
Content management system (CMS) vendors, programmatic digital OOH demand-side and supply-side platform developers, and AI-powered creative optimization tools |
|
Media Owners & Operators |
Media companies handling digital billboard, transit, and street furniture inventory |
|
Ad Tech & Data Partners |
Audience measurement companies, location data providers, programmatic trading desks, and verification and brand safety platforms |
|
Advertising Agencies |
Media planning and buying agencies, out-of-home specialist agencies, and programmatic campaign management specialists |
|
End Audience |
Urban commuters, pedestrians, transit passengers, shoppers, airport travelers, sports event attendees, and consumers in high-footfall commercial and entertainment venues |
Technology Landscape in the United States Digital OOH Advertising Industry
LED Display Technology
LED display technology is the foundational hardware enabling the US digital OOH ecosystem, with continuous improvements in pixel pitch, brightness, energy efficiency, and lifespan. The decline in LED display panel manufacturing costs, estimated to have fallen 80%+ over the past decade, has been the primary enabler of digital billboard conversion economics, making it financially viable to convert static billboard faces generating USD 1,000–5,000 per month in rental revenue to digital faces generating USD 10,000–50,000+ per month through multi-advertiser rotation.
Programmatic and Ad Tech Platforms
The programmatic digital OOH technology stack encompasses supply-side platforms (SSPs) aggregating and selling digital OOH screen inventory, demand-side platforms (DSPs) enabling advertisers to purchase impressions across multiple media owner networks, data management platforms (DMPs) enabling audience segment targeting, and measurement platforms validating campaign delivery and attributing audience responses.
Audience Measurement and Attribution Technology
Mobile location data is the foundational data source for US digital OOH audience measurement, enabling media owners to estimate audience volumes, demographic composition, and dwell times at screen locations without privacy-invasive individual tracking. Post-exposure attribution using mobile location data to track audience movement patterns after digital OOH exposure, footfall measurement linking digital OOH campaign flight periods to retail location visits, and online search lift measurement attributing search behavior changes to digital OOH campaigns are progressively making it accountable for performance outcomes beyond traditional reach and frequency metrics.
Market Segmentation Analysis
The report covers the following segments:
|
Segment Category |
Leading Segment |
Market Share |
Year |
|
Format Type |
Digital Billboards |
41.6% |
2025 |
|
Application |
Outdoor |
68.7% |
2025 |
|
End Use Industry |
Retail |
🔒 |
2025 |
|
Region |
South |
34.1% |
2025 |

By Format Type
Digital Billboards lead with a 41.6% share of the market in 2025. Large-format digital billboards positioned along US highways, urban arterials, and major traffic corridors generate the highest single-face audience reach of any digital OOH format, with a single high-traffic digital billboard in a major US metro market delivering 100,000–500,000+ weekly impressions.
To access detailed market analysis, Request Sample
Video advertising at 33.8% encompasses full-motion video digital OOH screens in premium locations, including iconic Times Square displays, sports stadium and arena video boards, shopping center digital networks, and major transit hub concourse screens. Ambient advertising at 15.2% covers street furniture, including digital bus shelters, urban kiosks, and city panel networks.
By Application
Outdoor leads with a 68.7% share in 2025, reflecting the primacy of roadside digital billboard advertising as the anchor of Lamar Advertising, Clear Channel Outdoor, and Outfront Media’s revenue bases. Transit advertising, including bus shelters, commuter rail platforms, subway stations, and airport displays, represents the second-largest outdoor digital OOH category, with New York’s MTA transit network, Chicago’s CTA, and major US airport digital advertising networks generating premium inventory that commands the highest US outdoor DOOH CPMs outside of iconic special sites.
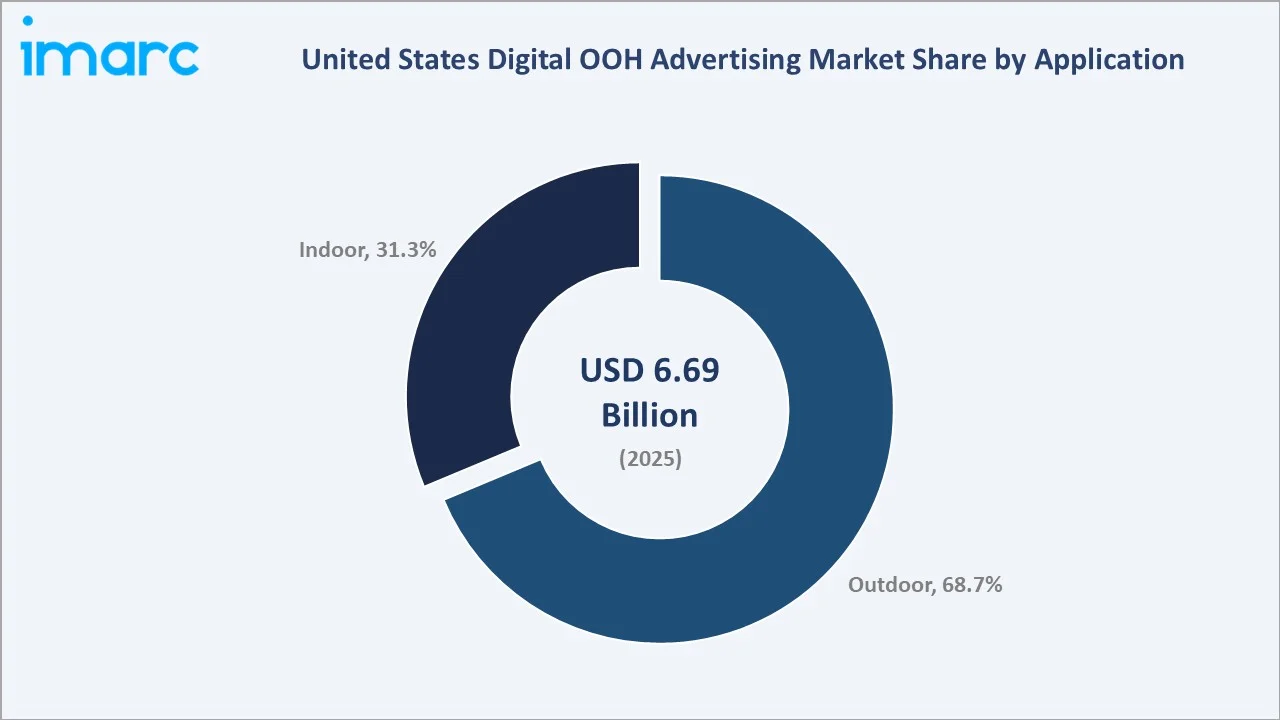
Indoor at 31.3% share (2025) encompasses retail digital screen networks, sports and entertainment venue digital boards, office building lobby screens, healthcare facility digital displays, and restaurant digital menu boards. Indoor digital OOH’s share is growing at above-market rates, driven by retail media network digital screen investment, sports venue digital infrastructure upgrade cycles, and the expansion of digital menu board advertising programs at quick-service restaurant chains.
Regional Market Insights
The South’s dominant position (34.1%, 2025) reflects the region’s position as the largest US population region, combined with the highest highway vehicle miles travelled, creating the largest outdoor digital OOH audience impression delivery of any US region. Texas alone represents one of the largest individual US state OOH markets, with the Dallas, Houston, San Antonio, and Austin metro areas each supporting substantial digital billboard networks.
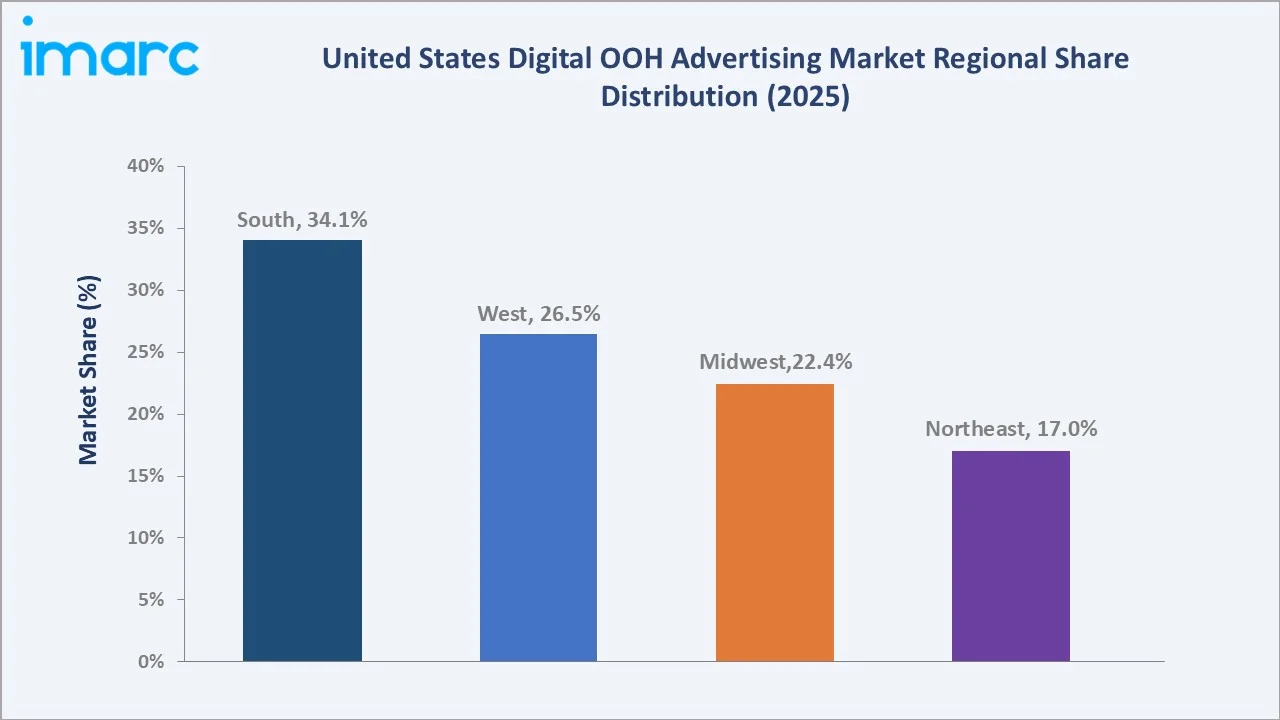
The West at 26.5% is driven by California’s large and technology-sophisticated advertising market, premium digital OOH inventory in Los Angeles’ Sunset Strip and San Francisco’s urban corridors, and the concentration of technology company advertisers comfortable with data-driven programmatic digital OOH buying.
|
Region |
Share (2025) |
Key Growth Drivers |
|
South |
34.1% |
Largest US population region with the highest highway corridor DOOH inventory, strong retail and quick-service restaurant advertiser base, major entertainment and sports event venue concentration, and growing smart city infrastructure investment |
|
West |
26.5% |
California’s large advertising market and technology-forward media ecosystem, high-traffic urban digital OOH corridors in Los Angeles and San Francisco, and technology company advertiser demand for addressable audience targeting |
|
Midwest |
22.4% |
Strong highway and interstate corridor DOOH inventory, major sports venue and entertainment district digital screen networks, growing programmatic DOOH adoption by regional retailers and QSR chains, and urban transit digital screen expansion |
|
Northeast |
17.0% |
Highest-value DOOH inventory concentration, including Times Square New York, premium transit advertising in the New York City subway and commuter rail, and concentration of financial services and media company advertisers |
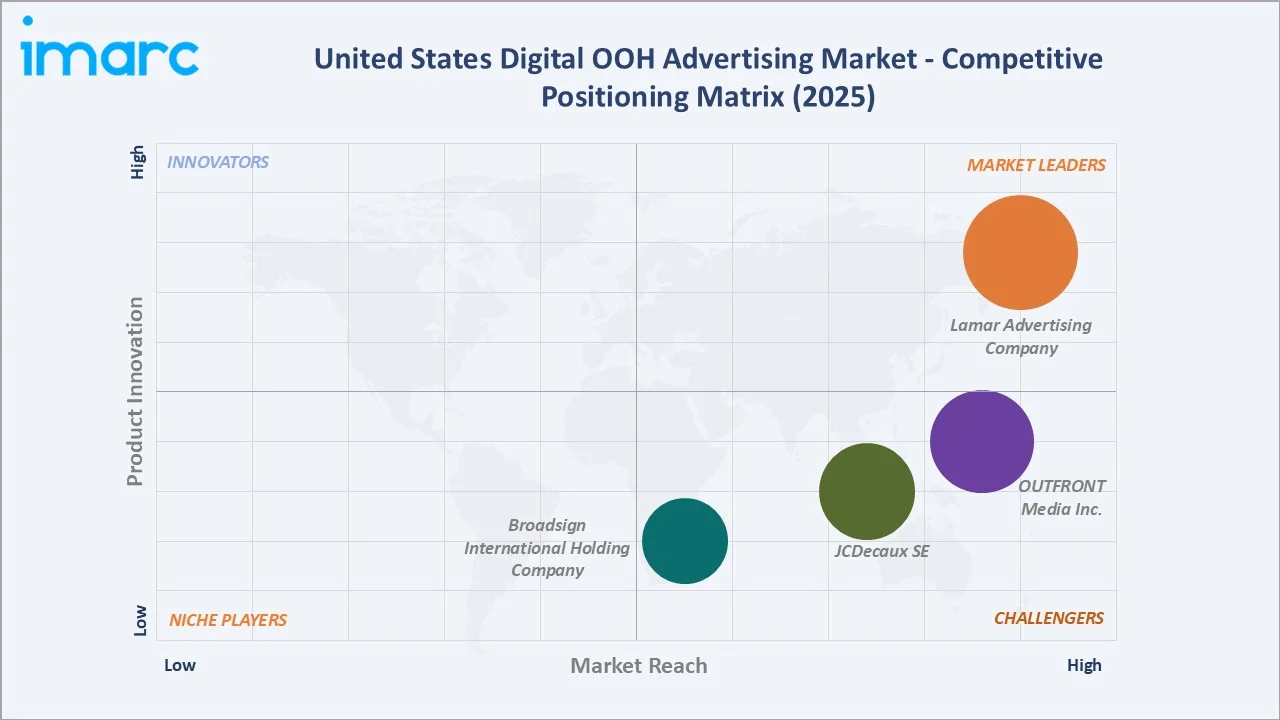
Competitive Landscape
The United States digital OOH advertising market exhibits moderate concentration, with the top US-focused operators collectively controlling approximately 65–70% of total US OOH revenues and a somewhat smaller share of digital OOH specifically due to JCDecaux’s premium airport and transit positions and the growing indoor digital OOH market served by independent networks.
|
Company Name |
Key Formats |
Market Position |
Core Strength |
|
Lamar Advertising Company |
Digital Billboards, Programmatic, Airport, Transit |
Market Leader |
One of the largest US digital OOH inventory by screen count; strong highway corridor and interstate network dominance |
|
OUTFRONT Media Inc. |
Digital Place-based, Digital Street Furniture, Digital Transit, Digital Billboards |
Strong Challenger |
Strong US transit advertising leadership; urban market focus; MTA New York transit partnership |
|
JCDecaux SE |
Airports, Private Aviation, Billboards, MallScape, Street Furniture |
Strong Challenger |
Premium US airport and transit location inventory; smart city digital infrastructure partnerships |
|
Broadsign International Holding Company |
Broadsign Connect |
Challenger |
Leading programmatic digital OOH software platform powering thousands of screens across multiple media owner networks |
The competitive dynamics are evolving as programmatic technology lowers the barrier to aggregated multi-network buying, enabling brands to reach audiences across multiple operators’ screens through single programmatic transactions. This aggregation capability is both democratizing digital OOH access for smaller advertisers and creating pressure for operators to differentiate on data, audience quality, and premium location access rather than pure inventory scale.
Key Company Profiles
Lamar Advertising Company
Lamar Advertising Company is one of the largest US outdoor advertising companies by digital screen count, with advertising displays across the United States. The company’s digital OOH strategy focuses on systematic digital conversion of its extensive traditional billboard portfolio in high-traffic markets, proprietary audience analytics, and direct advertiser relationships with national and regional brand advertisers.
- Portfolio: digital billboards, digital transit shelter displays, and digital airport advertising; SmartBrief audience analytics; Lamar Direct programmatic buying platform; airport digital advertising.
- Recent Developments: In May 2025, Lamar Advertising Company entered a year-long partnership with the Imagination Library, donating digital billboard space across the U.S. to promote childhood literacy and increase awareness of the free book-gifting program. The campaign aims to expand enrollment and support early reading development for children and families nationwide.
- Strategic Focus: Digital billboard conversion in high-traffic markets; programmatic digital OOH audience data enhancement; airport and transit digital network expansion; SmartBrief analytics deepening for advertiser ROI demonstration.
JCDecaux SE
JCDecaux SE is one of the global leaders in outdoor advertising with significant US market presence across premium airport, transit, and street furniture digital OOH categories. The company’s US strategy focuses on premium urban and travel environment locations where its smart city infrastructure and data-enabled audience targeting create differentiated value versus highway-focused US operator competitors.
- Portfolio: US airport advertising programs at major international airports, transit shelter and street furniture digital networks in select US cities, and smart city digital screen infrastructure programs.
- Recent Developments: In February 2026, JCDecaux SE launched the world’s first global programmatic digital OOH media solution, expanding beyond airports into street, transport, and retail environments. The platform enables real-time campaign activation across 30,000+ digital screens in over 35 markets through a single access point.
- Strategic Focus: Premium US airport and transit location inventory expansion; smart city digital infrastructure partnerships; programmatic digital OOH platform integration; sustainability-certified digital OOH infrastructure offering.
Market Concentration Analysis
The United States digital OOH market exhibits high concentration in outdoor large-format billboard advertising, top players collectively hold approximately 65–70% of market revenue, and moderate-to-low concentration in indoor, place-based, and emerging digital OOH categories, where hundreds of independent operators compete across retail, healthcare, sports, and entertainment venue networks.
The outdoor concentration is reinforced by regulatory barriers to new competitor entry and the capital-intensive nature of existing operator infrastructure that creates high barriers to replication. The programmatic digital OOH layer is creating a more competitive dynamic at the campaign buying level, where aggregators and SSPs enable advertisers to reach audiences across multiple operator networks simultaneously, reducing individual operator pricing power for non-premium inventory.
Investment & Growth Opportunities
Fastest Growing Segments
Programmatic digital OOH (~15%+ annual transaction volume growth), retail media network indoor digital OOH (~12–15% CAGR), and sports venue digital advertising represent the highest-growth investment vectors within the US digital OOH market through 2034. Video Advertising format is growing at above-market rates, driven by premium venue screen investment and the superior creative impact of full-motion video DOOH versus static digital billboard formats.
Emerging Trends
Several structural trends are creating new investment opportunities in the market through 2034. Programmatic digital OOH’s rapid maturation is enabling brands to activate digital OOH inventory in real time through the same trading desks used for digital display and connected TV, fundamentally expanding the advertiser base beyond traditional OOH buyers to include digital-native performance advertisers who previously considered DOOH unmeasurable.
AI-powered contextual dynamic creative is enabling new premium digital OOH campaign formats that deliver weather-responsive, event-triggered, and audience-segment-responsive creative executions, creating revenue premium above static digital OOH creative placements. EV charging station digital screen networks are emerging as a new high-dwell-time digital OOH format with captive, engaged audience characteristics and growing national scale as EV adoption accelerates across the US market.
Technology Investment Trends
- Programmatic DSP integration investment is the highest-priority technology allocation for major US digital OOH operators investing in making their full digital inventory accessible to The Trade Desk, Google DV360, and Amazon DSP programmatic buyers as a structural channel for incremental revenue from digital media buyers.
- Audience measurement and attribution platform investment is attracting both media owner and ad tech sector investment as standardized digital OOH measurement equivalents to digital media viewability and conversion tracking become competitive requirements for inclusion in performance advertising budget allocations.
Future Market Outlook (2026-2034)
The United States digital OOH advertising market is positioned for exceptional growth through 2034. From USD 6.69 Billion in 2025, the market is projected to reach USD 15.38 Billion by 2034, representing total incremental value creation of USD 8.69 Billion at a CAGR of 9.40%.
This growth is underpinned by the ongoing digital conversion of the US’s large static OOH billboard and transit display installed base, the maturation of programmatic digital OOH as a standard advertising channel in digital media buying stacks, and the structural shift of advertising budgets toward brand-safe, unskippable, and publicly contextually relevant formats as digital media faces increasing privacy regulation and consumer trust challenges.
The digital OOH market’s revenue composition will continue shifting toward programmatic transactions, data-enhanced inventory, and indoor retail media formats as the market matures. Premium outdoor locations and iconic urban sites will maintain pricing power and above-market CPM rates, while standardized highway billboard inventory will face increasing programmatic commoditization.
Research Methodology
Primary Research
Primary research comprised structured interviews with over 60 industry participants in 2024–2025, including digital OOH media owner executives, programmatic digital OOH technology platform founders, advertising agency OOH planning specialists, brand advertiser media directors, and digital OOH audience measurement technology providers. Expert input validated market sizing, segment growth rates, and regional demand estimates.
Secondary Research
Secondary research encompassed digital OOH operator annual reports and investor presentations, Out of Home Advertising Association of America (OAAA) quarterly revenue reports, DPAA Digital Place-Based Advertising Association research, Magna Global advertising forecast data, eMarketer US advertising spending projections, Vistar Media and Place Exchange programmatic digital OOH transaction data, and industry publications including Billboard Insider, AdAge, Campaign US, and OAAA research publications.
Forecasting Models
Market size estimations were derived using top-down and bottom-up forecasting, incorporating US OOH total market revenue data and digital share projections, media owner digital inventory conversion rate modelling, programmatic digital OOH transaction growth projections, advertiser segment spending trend analysis, and regional market development pattern data.
Report Coverage:
| Report Features | Details |
|---|---|
| Base Year of the Analysis | 2025 |
| Historical Period | 2020-2025 |
| Forecast Period | 2026-2034 |
| Units | Billion USD |
| Scope of the Report | Exploration of Historical and Forecast Trends, Industry Catalysts and Challenges, Segment-Wise Historical and Predictive Market Assessment:
|
| Format Types Covered | Digital Billboards, Video Advertising, Ambient Advertising, Others |
| Applications Covered | Outdoor, Indoor |
| End Use Industries Covered | Retail, Recreation, Banking, Transportation, Education, Others |
| Region Covered | Northeast, Midwest, South, West |
| Companies Covered | Lamar Advertising Company, OUTFRONT Media Inc., JCDecaux SE, Broadsign International Holding Company, etc. |
| Customization Scope | 10% Free Customization |
| Post-Sale Analyst Support | 10-12 Weeks |
| Delivery Format | PDF and Excel through Email (We can also provide the editable version of the report in PPT/Word format on special request) |
Frequently Asked Questions About the United States Digital OOH Advertising Market Report
The United States digital OOH advertising market reached USD 6.69 Billion in 2025 and is projected to reach USD 15.38 Billion by 2034.
The market is expected to grow at a CAGR of 9.40% during 2026-2034, driven by programmatic DOOH adoption, urban smart city digital infrastructure investment, brand budget shifts toward brand-safe measurable formats, and AI-enhanced audience targeting capabilities.
The South leads with a 34.1% share in 2025, driven by the largest US population base, the highest highway vehicle miles travelled, creating maximum billboard impression delivery, strong retail and QSR advertiser demand, and growing smart city digital screen investment across Texas, Florida, Georgia, and North Carolina.
Digital billboards lead with a 41.6% share in 2025, reflecting the primacy of large-format roadside digital displays as the highest-reach DOOH format and the most economically compelling digital conversion opportunity from traditional static billboard inventory.
Outdoor leads with a 68.7% share in 2025, reflecting the dominance of roadside digital billboards and transit advertising as the core US DOOH revenue categories and the extensive highway system creating large outdoor audience impression volumes.
Some of the key players include Lamar Advertising Company, OUTFRONT Media Inc., JCDecaux SE, and Broadsign International Holding Company.
Key drivers include programmatic digital OOH enabling data-driven audience targeting, urban smart city infrastructure investment deploying new digital screen inventory, measurable ROI through mobile attribution technology, and AI-powered dynamic creative optimization.
Key opportunities include programmatic digital OOH platform development and inventory aggregation, retail media network indoor digital OOH screen infrastructure, sports venue digital board upgrade programs, AI-powered contextual dynamic creative platforms, and audience measurement and attribution technology for digital OOH campaign accountability.
Need more help?
- Speak to our experienced analysts for insights on the current market scenarios.
- Include additional segments and countries to customize the report as per your requirement.
- Gain an unparalleled competitive advantage in your domain by understanding how to utilize the report and positively impacting your operations and revenue.
- For further assistance, please connect with our analysts.
 Request Customization
 Speak to an Analyst
 Request Brochure
 Inquire Before Buying
Benefits of Customization
- Personalize this research
- Triangulate with your data
- Get data as per your format and definition
- Gain a deeper dive into a specific application, geography, customer, or competitor
- Any level of personalization
Get in Touch With Us
UNITED STATES
Phone: +1-201-971-6302
INDIA
Phone: +91-120-433-0800
UNITED KINGDOM
Phone: +44-753-714-6104
Email: [email protected]
Client Testimonials


.webp)


