
United States Graph Database Market Size, Share, Trends and Forecast by Component, Type of Database, Analysis Type, Deployment Model, Application, Industry Vertical, and Region, 2026-2034
United States Graph Database Market Size and Share:
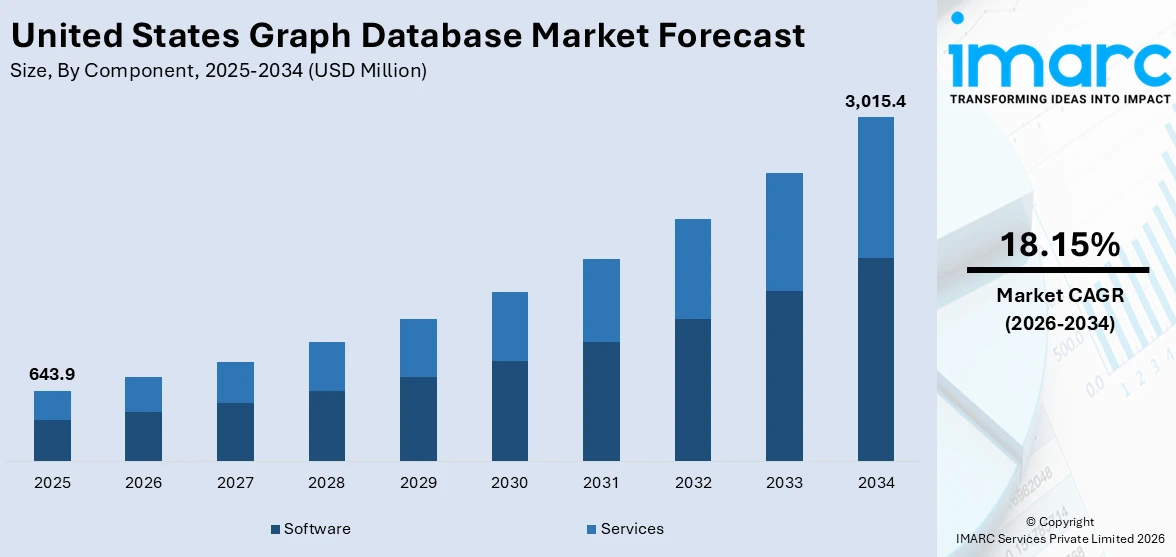
The United States graph database market size was valued at USD 643.9 Million in 2025. Looking forward, IMARC Group estimates the market to reach USD 3,015.4 Million by 2034, exhibiting a CAGR of 18.15% from 2026-2034. The widespread adoption of graph databases is driving market growth across the United States, primarily due to their significant advantages over traditional legacy database systems. These are higher computing, better storage, quicker and more dynamic indexing, and sophisticated querying for complex relationships. Graph databases manage interlinked data with higher speed and scalability and are therefore perfect for contemporary applications such as recommendation engines, fraud detection, and network analysis driving the United States graph database market share further. Their capability to provide real-time insights is driving demand in various industries.
|
Report Attribute
|
Key Statistics
|
|---|---|
|
Base Year
|
2025 |
|
Forecast Years
|
2026-2034
|
|
Historical Years
|
2020-2025
|
| Market Size in 2025 | USD 643.9 Million |
| Market Forecast in 2034 | USD 3,015.4 Million |
| Market Growth Rate (2026-2034) | 18.15% |
As organizations increasingly rely on data to guide strategic decision-making, the demand for advanced analytics software is experiencing rapid and substantial growth. Graph databases are stepping forward as a compelling answer, providing immediate analysis of intricate, interrelated information. They excel in use cases like fraud prevention, recommendation systems, and social network analysis. In contrast to conventional relational databases, graph databases are 1,000 times as quick in retrieving complex relationships, which allows organizations to detect new patterns and insights with unparalleled velocity. This efficiency facilitates more tailor-made customer experiences as well as more efficient operations, and graph databases prove to be an invaluable asset in industries such as finance, healthcare, and e-commerce. With increasing demand for real-time actionable intelligence, graph databases are evolving into a backbone of contemporary data infrastructure.
To get more information on this market Request Sample
The integration of graph databases with artificial intelligence (AI) and machine learning (ML) technologies is accelerating their adoption in the U.S. market. Graph databases enhance ML models by providing richer context and relationship-based data structures, improving both accuracy and interpretability. Use cases include knowledge graphs, natural language processing, and recommendation systems. Tech giants and startups alike leverage graph-based AI to create smarter applications that understand user behavior and complex connections. As AI/ML become central to innovation in industries like cybersecurity, biotech, and logistics, the demand for graph databases as a foundational infrastructure continues to rise.
United States Graph Database Market Trends:
Expansion of Knowledge Graphs in Enterprise Applications
Knowledge graphs are becoming increasingly integral to enterprise data strategies, enabling companies to link disparate data sources into relevant, connected insights. Graph databases fuel these knowledge graphs through the storage and querying of relationships between entities at scale. Organizations use them to facilitate semantic search, customer 360 degrees, and smart chatbots. As digital transformation drives increasingly more business forward, more organizations are leveraging knowledge graphs to enhance decision-making, data discovery, and personalization. This trend is particularly visible in industries such as healthcare, finance, and technology, where data is immense and highly interconnected. The increasing demand for explainable AI and contextual intelligence is also adding fuel to the adoption of knowledge graphs powered by graphs.
Increasing Relevance of Graph Analytics in Cybersecurity and Fraud Detection
Graph analytics has become essential in cybersecurity and fraud prevention because it uncovers hidden patterns and anomalies within interconnected data that traditional methods often miss. By modeling relationships between users, devices, transactions, and behaviors, graph databases enable security teams to detect suspicious connections in real time. In financial services, graph-based systems can identify fraudulent rings and abnormal transaction flows quickly, enhancing fraud detection effectiveness. Similarly, cybersecurity platforms use graph structures to map and analyze attack vectors, improving threat intelligence and response. Organizations adopting graph analytics have reported up to a 50% increase in fraud detection rates, highlighting its impact. The rising frequency and complexity of cyber threats and financial fraud are driving businesses to invest heavily in graph technologies as part of proactive risk mitigation and security strategies.
Rise of Multi-Model and Cloud-Native Graph Database Solutions
Graph databases have matured from appliance-like on-premises tools into cloud-native, multi-model, scalable platforms supporting multiple data types, such as graph, document, key-value, and relational models in one system. This single-platform approach maximizes flexibility and makes it easier to manage data for enterprises of any size. Cloud-native deployments provide better scalability, lower cost, and more convenient integration with other cloud-based services. Core platforms facilitate seamless ingestion, storage, and real-time analysis of huge volumes of data, enabling AI and machine learning workloads. The cloud-first approach propels adoption in industries that are agility- and digital-transformation-driven, making leading graph database capabilities more accessible and fueling innovation in the finance, healthcare, and technology industries.
United States Graph Database Industry Segmentation:
IMARC Group provides an analysis of the key trends in each segment of the United States graph database market, along with forecast at the regional, and country levels from 2026-2034. The market has been categorized based on component, type of database, analysis type, deployment model, application, and industry vertical.
Analysis by Component:
- Software
- Services
Graph database software consists of graph database management systems and analytical software that facilitates storing, querying, and visualizing complicated relationships in data. It fuels market growth by facilitating real-time intelligence, AI integration, and multi-model capabilities, accelerating and streamlining data analysis across industries.
Additionally, the services include consulting, implementation, integration, and support for graph database solutions. The services facilitate organizations in tailoring deployments, guaranteeing seamless integration into existing systems, and maximizing performance, thus driving adoption by minimizing complexity and making graph technology easy to use for businesses.
Analysis by Type of Database:
- Relational (SQL)
- Non-Relational (NoSQL)
Relational databases organize data into tables with predefined schemas, using SQL for queries. Though traditional and widely used, they struggle with complex relationship queries, limiting efficiency in connected data scenarios compared to graph databases, especially for real-time analytics and dynamic data models.
Besides this, the NoSQL databases, including graph databases, store data flexibly without fixed schemas, handling diverse data types like documents, key-value pairs, and graphs. They excel at managing complex relationships and large-scale, unstructured data, offering better scalability and performance for modern applications like fraud detection and social networks.
Analysis by Analysis Type:
- Path Analysis
- Connectivity Analysis
- Community Analysis
- Centrality Analysis
Path analysis examines the routes or connections between nodes in a graph to identify the shortest or most efficient paths. It’s crucial for applications like supply chain optimization, fraud detection, and network routing, helping uncover how entities are linked and how information or influence flows through networks.
In line with this, the connectivity analysis assesses how nodes are linked within a graph, measuring the strength and existence of connections. It helps identify isolated nodes, network robustness, and potential vulnerabilities, playing a key role in cybersecurity, infrastructure planning, and social network monitoring.
Moreover, the community analysis detects groups or clusters of nodes with dense interconnections within a graph. It reveals hidden structures, such as social circles or fraud rings, enabling targeted marketing, anomaly detection, and understanding collective behaviors within networks.
Also, the centrality analysis identifies the most influential or important nodes within a graph based on metrics like degree, closeness, or betweenness centrality. It’s vital for pinpointing key influencers, critical infrastructure points, or major communication hubs in networks.
Analysis by Deployment Model:
- On-premises
- Cloud-based
On-premises deployment involves hosting graph databases within an organization’s own infrastructure. It offers greater control, security, and customization but requires higher upfront investment and maintenance. Suitable for industries with strict data privacy regulations or where low latency and direct hardware access are critical.
Apart from this, the cloud-based deployment provides scalable, flexible access to graph databases via cloud service providers. It reduces infrastructure costs, enables rapid deployment, and supports real-time analytics with seamless integration into other cloud services. Ideal for businesses seeking agility, cost-efficiency, and easy scalability across distributed teams.
Analysis by Application:
Access the comprehensive market breakdown Request Sample
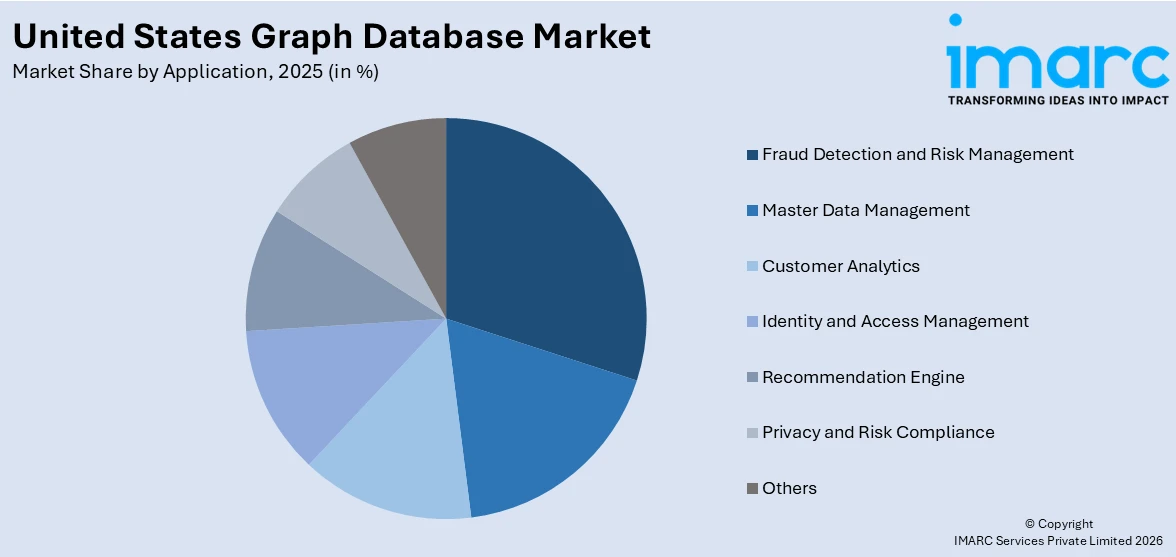
- Fraud Detection and Risk Management
- Master Data Management
- Customer Analytics
- Identity and Access Management
- Recommendation Engine
- Privacy and Risk Compliance
- Others
Based on the United States graph database market outlook the graph databases identify complex fraud patterns by analyzing relationships between transactions, users, and devices in real time. This helps detect suspicious activities quickly, reducing financial losses and improving risk mitigation strategies in sectors like finance and insurance.
Concurrently, the master data management create a single, consistent view of critical business entities. This improves data quality, accuracy, and governance, enabling better decision-making and operational efficiency across enterprises.
Also, by mapping customer interactions, preferences, and relationships, graph databases enable deeper insights into behavior and sentiment. This supports personalized marketing, improved customer experience, and enhanced loyalty programs.
Furthermore, the Identity and Access Management aligns with the complex relationships between users, roles, and permissions. It ensures secure, flexible access control by quickly detecting anomalies and preventing unauthorized access across IT environments.
Besides this, the graph databases power recommendation systems by analyzing connections between users, products, and behaviors. This delivers personalized suggestions that enhance user engagement and drive sales in e-commerce, streaming, and social platforms.
Likewise, graph databases track data lineage and relationships to ensure compliance with privacy regulations. They help organizations monitor sensitive data usage, enforce policies, and reduce regulatory risks effectively.
However, the other applications include supply chain optimization, network and IT operations, knowledge graphs, and social network analysis. Graph databases enable these diverse uses by efficiently handling interconnected, complex datasets.
Analysis by Industry Vertical:
- BFSI
- Retail and E-Commerce
- IT and Telecom
- Healthcare and Life Science
- Government and Public Sector
- Media and Entertainment
- Manufacturing
- Transportation and Logistics
- Others
Based on the United States graph database market forecast, the graph databases help banks and financial institutions detect fraud, manage risk, and analyze complex customer relationships. They improve compliance, enhance customer insights, and support real-time decision-making in a highly regulated environment.
In line with this, the retailers and e-commerce use graph databases for personalized recommendations, inventory management, and customer behavior analysis. They enable dynamic pricing, targeted marketing, and efficient supply chain management, enhancing overall customer experience and operational efficiency.
Moreover, the graph technology supports network management, fault detection, and customer analytics in IT and telecom sectors. It helps model complex infrastructure relationships and optimize service delivery, boosting operational reliability and customer satisfaction.
Besides this, the graph databases integrate patient data, research, and treatment pathways, facilitating precision medicine and clinical decision support. They improve disease modeling, drug discovery, and patient care coordination in this data-intensive sector.
Likewise, the governments leverage graph databases for fraud detection, public safety, intelligence analysis, and digital services. These tools enhance data transparency, inter-agency collaboration, and efficient resource management.
Furthermore, the media and entertainment power content recommendations, audience segmentation, and social network analysis. They help personalize user experiences, optimize content delivery, and identify trends in a competitive digital landscape.
Also, the manufacturers utilize graph technology for supply chain optimization, predictive maintenance, and quality control. It enables real-time monitoring of equipment and better collaboration across production networks.
Apart from this, the graph databases improve route optimization, fleet management, and supply chain visibility. They help manage complex logistics networks, reducing costs and enhancing delivery efficiency.
Meanwhile, the other industries adopting graph databases include education, energy, and real estate, leveraging them for knowledge management, smart grids, and property analytics, demonstrating the technology’s broad applicability.
Regional Analysis:
- Northeast
- Midwest
- South
- West
The Northeast hosts a dense concentration of financial institutions, tech startups, and healthcare organizations, driving strong demand for graph databases. The region benefits from advanced infrastructure and skilled talent, fostering innovation in AI, cybersecurity, and data analytics.
In addition to this, the Midwest’s growing manufacturing, logistics, and healthcare sectors are increasingly adopting graph technologies to optimize operations and supply chains. Investments in smart city initiatives and digital transformation fuel United States graph database market growth across this traditionally industrial region.
Moreover, the South is experiencing rapid expansion in technology, finance, and telecommunications industries. Cloud adoption and government initiatives supporting digital infrastructure boost demand for scalable graph database solutions, particularly in urban hubs like Atlanta and Dallas.
Similarly, the West, including Silicon Valley, is a major innovation hub with leading cloud providers and tech giants driving graph database advancements. Strong venture capital presence and a focus on AI, biotech, and e-commerce accelerate adoption in this highly competitive region.
Competitive Landscape:
The U.S. graph database market competitive landscape is marked by fierce innovation, varied features, and growing specialization. The market consists of both traditional database providers venturing into graph technology and startups with graph-based solutions only. Competition revolves around scalability, performance, simplicity, cloud integration, and AI and analytics workload support. Open-source platforms also have an important presence, with flexibility and community-based development. As real-time relationship analysis demand increases by industries, vendors are distinguishing themselves by adding cutting-edge features such as visualization capabilities, support for multiple models, and integration with enterprise systems. This rapidly changing landscape creates ongoing innovation and strategic alliances to win market share.
The report provides a comprehensive analysis of the competitive landscape in the United States graph database market with detailed profiles of all major companies.
Latest News and Developments:
- May 2025: Neo4j launched the Neo4j Aura Graph Analytics, a brand-new serverless solution with zero ETL (extract, load, transfer) that can be seamlessly integrated with any data source. The solution unlocks deeper intelligence and achieves 2X more insight precision and quality than traditional analytics, bringing the power of graph analytics to individuals of all skill levels.
- February 2025: Valkyrie launched the first-ever knowledge graph database to the Moon. This innovative database, chosen for its advanced data compression and potential to support transparent AI infrastructure, was deployed aboard Intuitive Machine's IM-2 Mission from Kennedy Space Center. In collaboration with Lonestar Data Holdings and the Harvard Smithsonian Center for Astrophysics, the mission aims to establish lunar data centers capable of secure, off-world data storage and processing.
- January 2025: TigerGraph introduced Savanna, a cloud-based graph database that can process massive volumes of related data rapidly in order to support AI and analytics applications. Now widely accessible, Savanna is the latest development in TigerGraph's cloud-native database technology.
- September 2024: Neo4j revealed that its Aura cloud database management system (DBMS) portfolio received a significant makeover, making it much simpler for businesses to test, develop, and expedite graph deployment for any workload or use case. The news coincides with the increasing demand and growth for Neo4j's cloud service and the crucial role graph databases play in GenAI and advanced analytics applications.
- April 2024: Neo4j entered into a partnership with Google Cloud to introduce novel GraphRAG features for GenAI use cases. This collaboration aims to enable developers to swiftly employ GraphRAG strategies with knowledge graph databases to anchor LLMs for precision, context, and explainability, improving overall GenAI innovation.
United States Graph Database Market Report Scope:
| Report Features | Details |
|---|---|
| Base Year of the Analysis | 2025 |
| Historical Period | 2020-2025 |
| Forecast Period | 2026-2034 |
| Units | Million USD |
| Scope of the Report | Exploration of Historical and Forecast Trends, Industry Catalysts and Challenges, Segment-Wise Historical and Predictive Market Assessment:
|
| Components Covered | Software, Services |
| Types of Database Covered | Relational (SQL), Non-Relational (NoSQL) |
| Analysis Types Covered | Path Analysis, Connectivity Analysis, Community Analysis, Centrality Analysis |
| Deployment Models Covered | On-premises, Cloud-based |
| Applications Covered | Fraud Detection and Risk Management, Master Data Management, Customer Analytics, Identity and Access Management, Recommendation Engine, Privacy and Risk Compliance, Others |
| Industry Verticals Covered | BFSI, Retail and E-Commerce, IT and Telecom, Healthcare and Life Science, Government and Public Sector, Media and Entertainment, Manufacturing, Transportation and Logistics, Others |
| Regions Covered | Northeast, Midwest, South, West |
| Customization Scope | 10% Free Customization |
| Post-Sale Analyst Support | 10-12 Weeks |
| Delivery Format | PDF and Excel through Email (We can also provide the editable version of the report in PPT/Word format on special request) |
Key Benefits for Stakeholders:
- IMARC’s industry report offers a comprehensive quantitative analysis of various market segments, historical and current market trends, market forecasts, and dynamics of the United States graph database market from 2020-2034.
- The research report provides the latest information on the market drivers, challenges, and opportunities in the United States graph database market.
- Porter's five forces analysis assist stakeholders in assessing the impact of new entrants, competitive rivalry, supplier power, buyer power, and the threat of substitution. It helps stakeholders to analyze the level of competition within the United States graph database industry and its attractiveness.
- Competitive landscape allows stakeholders to understand their competitive environment and provides an insight into the current positions of key players in the market.
Frequently Asked Questions About the United States Graph Database Market Report
The United States graph database market was valued at USD 643.9 Million in 2025.
The United States graph database market is projected to exhibit a CAGR of 18.15% during 2026-2034, reaching a value of USD 3,015.4 Million by 2034.
The U.S. graph database market is driven by the growing volume and complexity of interconnected data, rising demand for real-time analytics, and increasing adoption of AI and machine learning. Additionally, cloud-based solutions offer scalability and flexibility, enabling businesses across industries to enhance fraud detection, customer insights, and decision-making.
Need more help?
- Speak to our experienced analysts for insights on the current market scenarios.
- Include additional segments and countries to customize the report as per your requirement.
- Gain an unparalleled competitive advantage in your domain by understanding how to utilize the report and positively impacting your operations and revenue.
- For further assistance, please connect with our analysts.
 Request Customization
 Speak to an Analyst
 Request Brochure
 Inquire Before Buying
Benefits of Customization
- Personalize this research
- Triangulate with your data
- Get data as per your format and definition
- Gain a deeper dive into a specific application, geography, customer, or competitor
- Any level of personalization
Get in Touch With Us
UNITED STATES
Phone: +1-201-971-6302
INDIA
Phone: +91-120-433-0800
UNITED KINGDOM
Phone: +44-753-714-6104
Email: [email protected]
Client Testimonials


.webp)


