
United States Green Cement Market Report by Product Type (Fly Ash-Based, Slag-Based, Limestone-Based, Silica Fume-Based, and Others), End Use Industry (Residential, Non-Residential, Infrastructure), and Region 2026-2034
United States Green Cement Market Size, Share & Analysis:
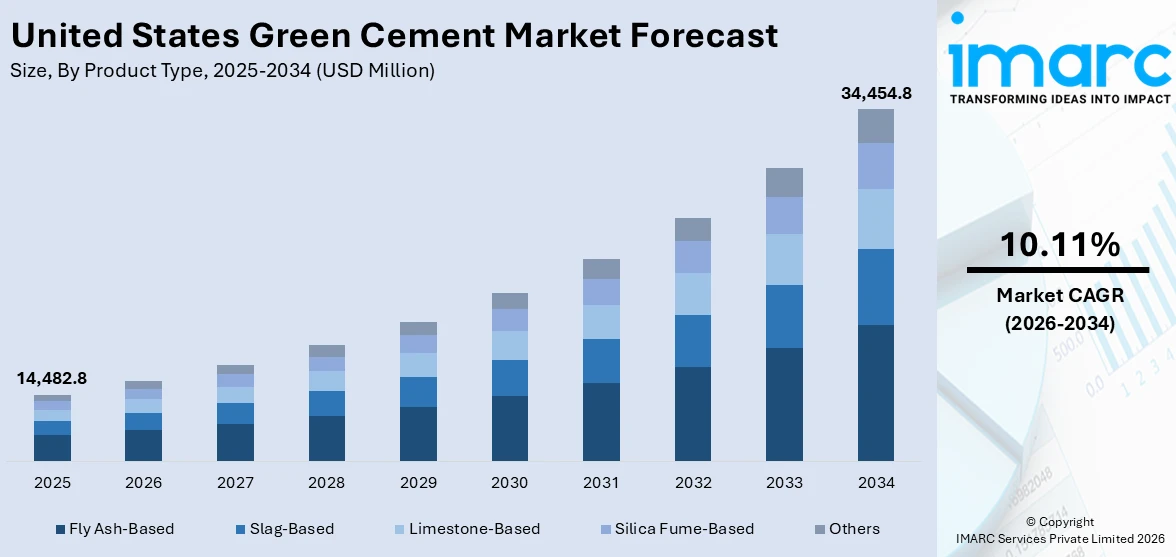
The United States green cement market size reached USD 14,482.8 Million in 2025. Looking forward, IMARC Group expects the market to reach USD 34,454.8 Million by 2034, exhibiting a growth rate (CAGR) of 10.11% during 2026-2034. The market is driven by growing environmental regulations, increasing demand for sustainable construction, and rising awareness of carbon emissions from traditional cement. Government incentives and LEED certification standards encourage eco-friendly building materials. Additionally, advancements in green cement technologies and a surge in infrastructure redevelopment projects further support United States green cement market share. As climate change concerns intensify, construction companies are shifting toward low-carbon alternatives, making green cement a critical component of sustainable development strategies across the nation.
United States Green Cement Market Analysis:
- Growth Drivers: Growing environmental awareness, supportive government policies, emphasis on green buildings, corporate sustainability commitments, and innovations in cement manufacturing techniques are driving United States green cement market demands for eco-friendly cement across residential and commercial sectors.
- Market Trends: Manufacturers are exploring carbon-neutral technologies, alternative raw materials, and digital monitoring systems. Circular economy models, eco-certifications, and sustainable construction practices are shaping how green cement is produced and applied.
- Challenges: High production costs, lack of standardized regulations, resistance from traditional builders, limited raw material availability, and slow adaptation of green codes hinder rapid adoption of sustainable cement solutions
- Market Opportunities: There is rising interest in public-private collaborations, eco-compliant infrastructure projects, and investments in green construction. Companies are developing novel low-carbon formulas and targeting government contracts for sustainable building initiatives.
|
Report Attribute
|
Key Statistics
|
|---|---|
|
Base Year
|
2025
|
|
Forecast Years
|
2026-2034
|
|
Historical Years
|
2020-2025
|
|
Market Size in 2025
|
USD 14,482.8 Million |
|
Market Forecast in 2034
|
USD 34,454.8 Million |
| Market Growth Rate 2026-2034 | 10.11% |
Green cement is a vital ingredient utilized in the construction industry that provides a cleaner alternative to traditional cement. It is economical to produce as it is prepared using various industrial by-products such as fly ash, furnace slag, aluminosilicate, and other recycled industrial waste. These materials lower the energy consumption and further increase the product’s strength and durability. In the United States, green cement is extensively used in the construction industry as a part of sustainable architectural projects due to the production of less carbon dioxide and the usage of less energy during its production as compared to Portland cement.
To get more information on this market Request Sample
The United States represents the largest market for green cement in the North American region. It is primarily driven by a significant rise in environmental concerns, resulting in an increased effort to reduce carbon emissions from the country. Various initiatives taken by the government and regulatory bodies, such as the United States Environmental Protection Agency (EPA), have created awareness among individuals about constructing environmentally safe buildings. Besides this, the leading players across the country are heavily investing in maintaining their competence with other emerging economies of the world. They are also developing advanced technologies to produce more energy-efficient and improved product variants such as ultra-high-strength concrete.
United States Green Cement Market Trends:
Stringent Environmental Policies & Incentives
Policy and government regulations have an important role to play in driving green cement forward in the U.S. Federal and state governments are leading the way in promoting sustainable building through incentives, procurement requirements, and environmental compliance regulations. These guidelines are inspiring cement manufacturers to move towards low-emission production processes and greener mix designs. Green building codes and certifications are increasingly necessitating the adoption of low-carbon materials, which is driving mandatory demand throughout infrastructure and public sector construction. Financing of cleaner industrial technologies, in the form of subsidies and pilot schemes, encourages firms to invest in greener cement manufacturing. This policy environment encourages innovation and speeds up market change, providing green cement with a competitive advantage. Public authorities and local governments are also giving preference to environmentally friendly suppliers, reinforcing the requirement for sustainable options within the construction value chain. All these regulatory drivers are combining to form a long-term basis for the adoption of green cement solutions thereby supporting the United States green cement market growth.
Technological Innovation & SCM Adoption
Technological advancements are transforming the way cement is manufactured and utilized in building. Businesses are creating substitute materials and methods that decrease environmental footprints without compromising or enhancing functionality. One of the key developments is substituting conventional cement components with naturally occurring substances or industrial waste products, which greatly decrease emissions. New manufacturing technologies enable producers to maximize energy efficiency and reduce waste during processing. Carbon-reducing technologies like mineralization, carbon capture, and electrochemical cement are also increasingly supported by government and private capital. Smart manufacturing equipment, automation, and analytics are enhancing quality control and efficiency of green cement manufacturing. These technologies are not only eco-friendly but also enable cost optimization and scale-up. By integrating alternative resources and clean technologies, the cement industry is shifting toward a competitive and sustainable future, which assists in achieving both environmental and building requirements.
Rising Demand for Sustainable Construction
Construction is increasingly focusing on sustainable materials and practices, generating high demand for green cement. Developers, builders, and architects are embracing eco-friendly practices to fulfill market demands and regulatory requirements. Public and private developments now increasingly have sustainability standards in material sourcing, driving the move towards low-carbon options. Green building standards and environmentally sound design concepts are compelling businesses to analyze their global footprint during the construction phase. Businesses and consumers alike are increasingly aware of the advantages of sustainable buildings, including increased energy efficiency and lower long-term expenditure. This change in mentality shapes purchasing habits, which in turn puts pressure on suppliers to provide environmentally friendly solutions. Consequently, green cement is being incorporated in increasing residential, commercial, and infrastructure projects. This change in attitude and trend guarantees frequent prospects for sustainable cement technology in the United States green cement market analysis.
Key Market Segmentation:
IMARC Group provides an analysis of the key trends in each sub-segment of the United States green cement market report, along with forecasts at the country and regional level from 2026-2034. Our report has categorized the market based on product type and end use industry.
Breakup by Product Type:
- Fly Ash-Based
- Slag-Based
- Limestone-Based
- Silica Fume-Based
- Others
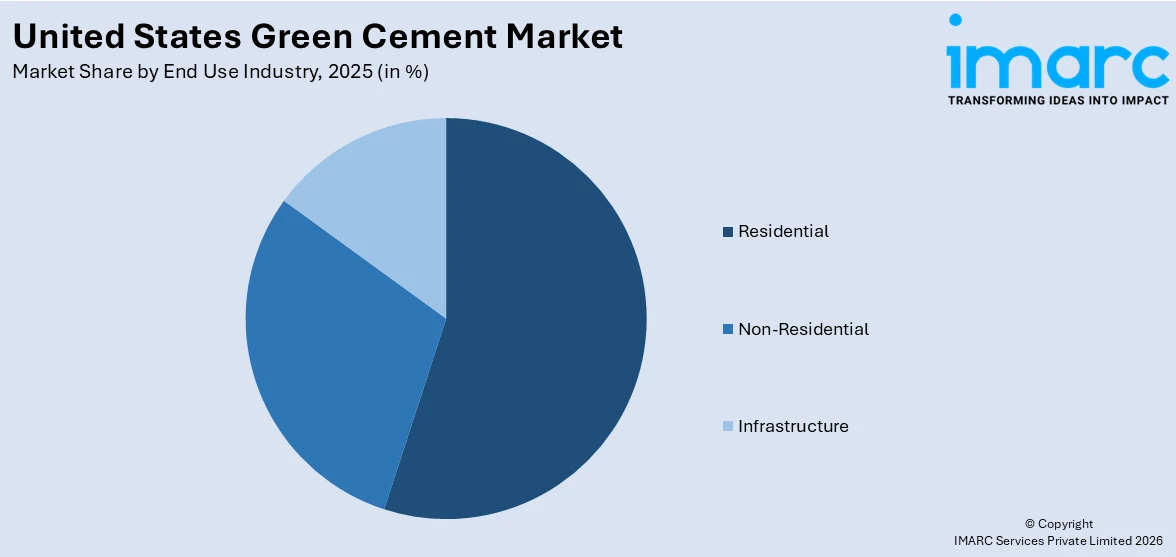
Breakup by End Use Industry:
Access the comprehensive market breakdown Request Sample
- Residential
- Non-Residential
- Infrastructure
Breakup by Region:
- Northeast
- Midwest
- South
- West

Competitive Landscape:
The competitive landscape of the industry has also been examined along with the profiles of the key players.
Latest News and Developments:
- In May 2025, Microsoft partnered with low-carbon cement startup Sublime Systems to cut emissions from its data center construction. The unique deal lets Microsoft claim emissions reductions even if it doesn’t directly use the cement, which Sublime can sell elsewhere. This move targets Microsoft’s Scope 3 emissions—over 96% of its carbon footprint—and supports its goal to become carbon-negative by 2030, marking a significant step toward greener infrastructure development.
- In January 2025, Hoffmann Green Cement Technologies expanded its licensing agreement with Hoffmann Green USA to now cover 25 eastern U.S. states. The deal includes an €8 million entry fee and grants exclusive rights for technology and industrial transfer. Hoffmann Green USA can sub-license within these United Statess, with ongoing talks underway. The agreement also includes fixed and variable royalties based on cement sales, supporting broader adoption of low-carbon cement solutions.
Report Coverage:
| Report Features | Details |
|---|---|
| Base Year of the Analysis | 2025 |
| Historical Period | 2020-2025 |
| Forecast Period | 2026-2034 |
| Units | Million USD |
| Segment Coverage | Product Type, End Use Industry, Region |
| Region Covered | Northeast, Midwest, South, West |
| Customization Scope | 10% Free Customization |
| Post-Sale Analyst Support | 10-12 Weeks |
| Delivery Format | PDF and Excel through Email (We can also provide the editable version of the report in PPT/Word format on special request) |
Frequently Asked Questions About the United States Green Cement Market Report
The green cement market in the United States was valued at USD 14,482.8 Million in 2025.
The United States green cement market is projected to exhibit a CAGR of 10.11% during 2026-2034, reaching a value of USD 34,454.8 Million by 2034.
Key factors driving the United States green cement market include strict environmental regulations, growing demand for sustainable construction, corporate climate goals, government incentives, and technological innovations. Increased focus on reducing carbon emissions in infrastructure and the rising adoption of low-carbon materials across the building sector further support market growth.
Need more help?
- Speak to our experienced analysts for insights on the current market scenarios.
- Include additional segments and countries to customize the report as per your requirement.
- Gain an unparalleled competitive advantage in your domain by understanding how to utilize the report and positively impacting your operations and revenue.
- For further assistance, please connect with our analysts.
 Request Customization
 Speak to an Analyst
 Request Brochure
 Inquire Before Buying
Benefits of Customization
- Personalize this research
- Triangulate with your data
- Get data as per your format and definition
- Gain a deeper dive into a specific application, geography, customer, or competitor
- Any level of personalization
Get in Touch With Us
UNITED STATES
Phone: +1-201-971-6302
INDIA
Phone: +91-120-433-0800
UNITED KINGDOM
Phone: +44-753-714-6104
Email: [email protected]
Client Testimonials


.webp)


