
United States Green Packaging Market Size, Share, Trends and Forecast by Packaging Type, End Use Industry, and Region, 2026-2034
United States Green Packaging Market Size, Share, Trends & Forecast (2026-2034)
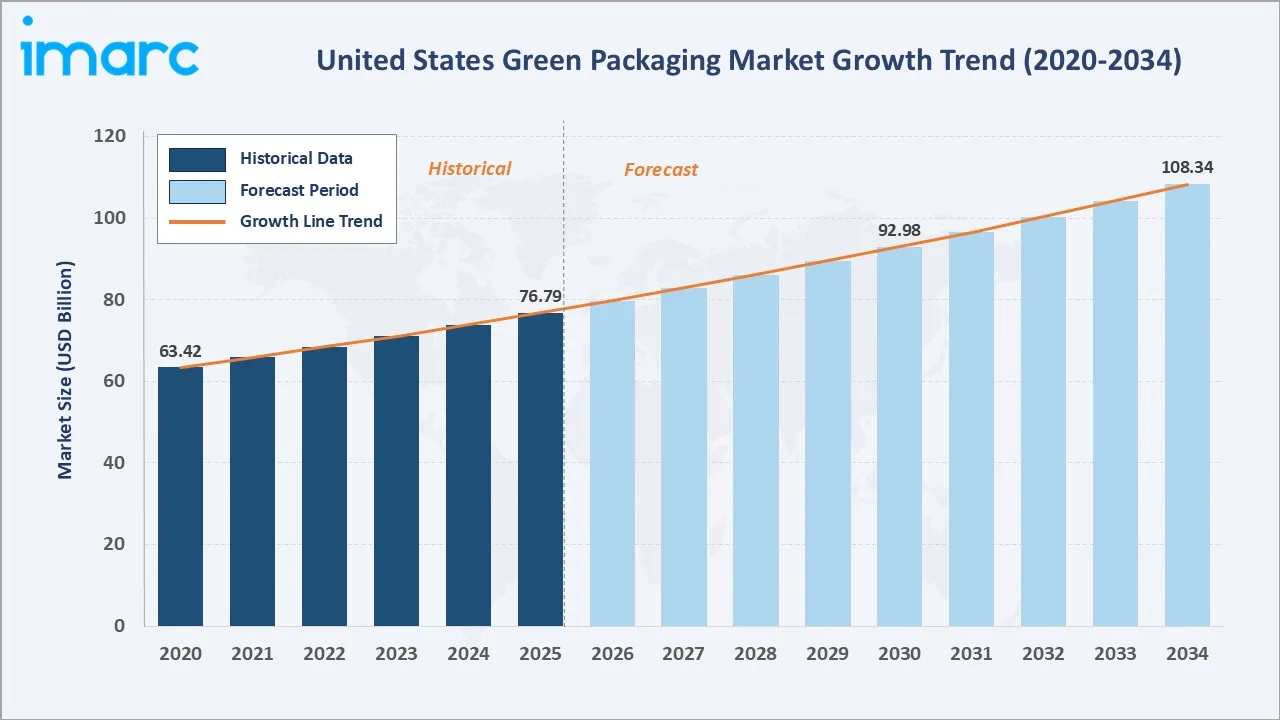
The United States green packaging market reached USD 76.79 Billion in 2025 and is projected to reach USD 108.34 Billion by 2034, growing at a CAGR of 3.90% during 2026-2034. The market is driven by rising environmental awareness, strict sustainability regulations, and strong consumer demand for eco-friendly packaging. Younger consumers show a stronger willingness to pay extra for sustainable options, with about 49% of Gen Z and 47% of Millennials open to spending more on eco-friendly packaging, compared to 41% of Gen X and 37% of Baby Boomers. Recycled content packaging leads at 46.7% packaging type share. The food industry dominates end use at 34.8%. The West region commands 28.6% of market revenues.
Market Snapshot
|
Metric |
Value |
|
Market Size (2025) |
USD 76.79 Billion |
|
Forecast Market Size (2034) |
USD 108.34 Billion |
|
CAGR (2026-2034) |
3.90% |
|
Base Year |
2025 |
|
Historical Period |
2020-2025 |
|
Forecast Period |
2026-2034 |
|
Largest Packaging Type |
Recycled Content Packaging (46.7%, 2025) |
|
Largest End Use Industry |
Food Industry (34.8%, 2025) |
|
Leading Region |
West (28.6%, 2025) |
The market expanded from USD 63.42 Billion in 2020 to USD 76.79 Billion in 2025, anchored at USD 92.98 Billion in 2030, and forecast to reach USD 108.34 Billion by 2034. The COVID-19 e-commerce surge created structural demand for sustainable protective packaging, while state-level plastic bans permanently elevated green packaging specification requirements, establishing regulatory-backed demand floors that are independent of short-term consumer sentiment cycles.
To get more information on this market, Request Sample
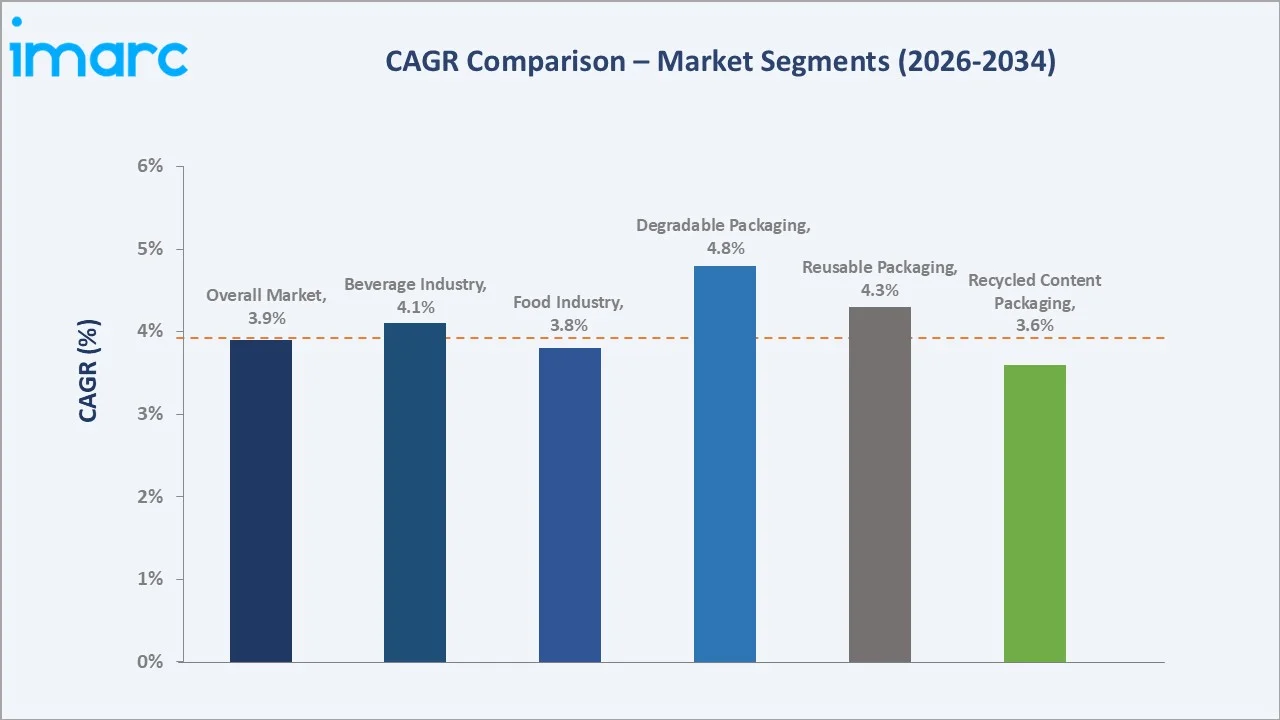
Degradable packaging grows fastest at ~4.8% CAGR (2026-2034), driven by composting infrastructure expansion and foodservice bans on non-compostable packaging in US municipalities. Reusable packaging grows at ~4.3% CAGR as reuse program scale-up demonstrates commercial viability. Recycled content grows at ~3.6% CAGR as the baseline volume leader, sustaining steady year-over-year expansion through mandatory minimum recycled content requirements.
Executive Summary
The US green packaging market reached USD 76.79 Billion in 2025, the world's largest national sustainable packaging market, driven by the most comprehensive state-level single-use plastic legislation framework and the strongest consumer sustainability premium willingness among major developed nations. The market is projected to reach USD 108.34 Billion by 2034 at 3.90% CAGR.
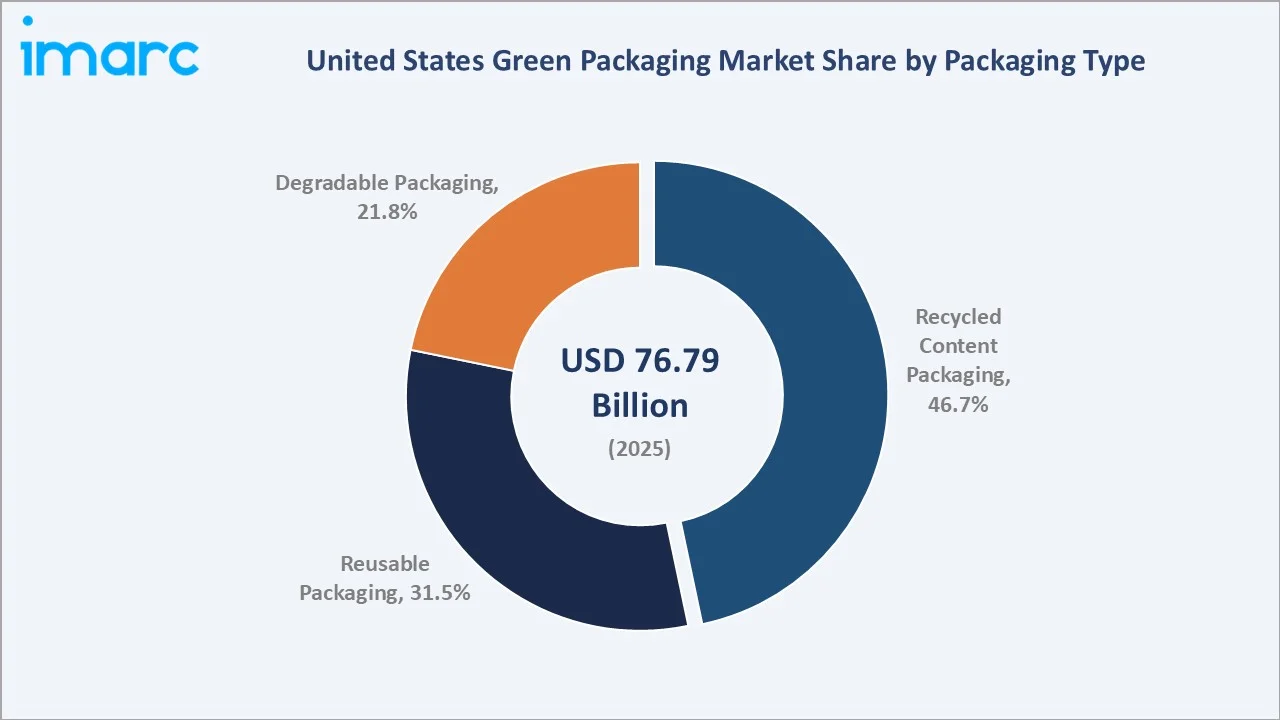
Recycled content packaging leads at 46.7% (2025), anchored by recycled corrugated cardboard, rPET beverage bottles, and recycled-content plastic film. Reusable packaging at 31.5% serves industrial, commercial, and emerging consumer reuse formats. Degradable packaging at 21.8% serves foodservice compostable packaging, the fastest-growing packaging format, as the US municipalities mandate compostable food service containers. The food industry at 34.8% leads the end-use industry, and the West at 28.6% leads regionally through California's regulatory leadership.
Key Market Insights
|
Insight |
Data |
|
Largest Packaging Type |
Recycled Content Packaging - 46.7% share (2025) |
|
Largest End Use Industry |
Food Industry - 34.8% market share (2025) |
|
Leading Region |
West - 28.6% market share (2025) |
Key Analytical Observations Supporting the Above Data:
- Recycled Content Packaging at 46.7% anchored by recycled corrugated near-universal US adoption: Recycled corrugated board accounts for the largest single green packaging volume in the US, with an average recycled content.
- Food Industry at 34.8% driven by retailer sustainability codes and consumer demand: The US food industry is the single largest green packaging end-use industry, as major food brands accelerate sustainable packaging transitions under investor ESG pressure and retailer supplier requirements.
- West at 28.6% driven by California's regulatory leadership establishing national packaging standards: California's SB 54 (Plastic Pollution Prevention and Packaging Producer Responsibility Act), mandates that by 2032, 100% single-use packaging must be recyclable or compostable, with 65% recycled and a 25% reduction in usage compared to 2023 levels, is the most stringent US state packaging regulation and effectively sets national packaging industry investment standards.
United States Green Packaging Market Overview
The US green packaging market encompasses all packaging that minimizes environmental impact through recycled content, recyclability, compostability, reusability, or bio-based material content, spanning rigid and flexible plastic, paperboard, corrugated, glass, and metal packaging formats across food, beverage, healthcare, personal care, and e-commerce applications.
The ecosystem integrates recycled material suppliers, bio-based material providers, packaging manufacturers, brand owner packaging design teams, logistics and distribution networks, and retail channels serving US consumers. Macroeconomic drivers include California SB 54's 2032 deadline, creating a multi-year capital investment stimulus and the FTC's Green Guides revision, strengthening enforcement against greenwashing claims.
Market Dynamics
To evaluate market opportunities, Request Sample
Market Drivers
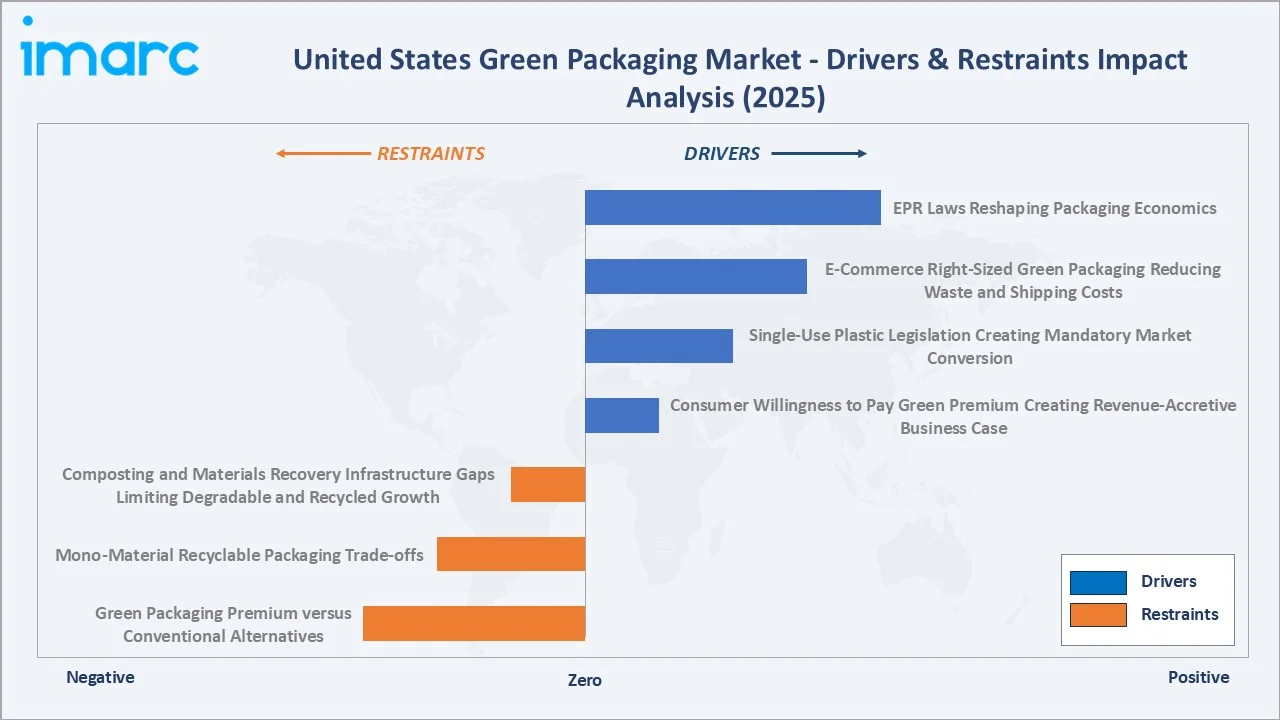
- Consumer Willingness to Pay Green Premium Creating Revenue-Accretive Business Case: Younger consumers show a stronger willingness to pay extra for sustainable options, with about 49% of Gen Z and 47% of Millennials open to spending more on eco-friendly packaging. This creates a compound commercial incentive; green packaging satisfies regulatory requirements and supports premium pricing, accelerating voluntary brand adoption beyond mandated compliance timelines.
- Single-Use Plastic Legislation Creating Mandatory Market Conversion: As of January 2026, 12 US states have enacted statewide bans on single-use plastic bags, including California, Colorado, Connecticut, Delaware, Hawaii, Maine, New Jersey, New York, Oregon, Rhode Island, Vermont, and Washington, creating demand for the green packaging market.
- E-Commerce Right-Sized Green Packaging Reducing Waste and Shipping Costs: Amazon's Frustration-Free Packaging (FFP) certification program drives certified green packaging adoption across its US third-party marketplace sellers.
Market Restraints
- Green Packaging Premium versus Conventional Alternatives: Certified sustainable packaging typically commands a cost premium over conventional equivalents. For price-sensitive CPG categories (private label grocery, commodity household products) and for small and medium-sized brands, this cost premium creates meaningful financial barriers to voluntary adoption beyond regulatory minimums, slowing the pace of overall market conversion.
- Composting and Materials Recovery Infrastructure Gaps Limiting Degradable and Recycled Growth: The US has fewer industrial composting facilities able to process certified compostable packaging, insufficient to serve all US municipalities with compostable food service packaging mandates.
Market Opportunities
- Extended Producer Responsibility (EPR) Legislation Creating Circular Economy Infrastructure Funding: EPR legislation is expected in more US states, creating a systematic funding mechanism for the recycling infrastructure that expands green packaging's addressable market.
- Pharmaceutical Sustainable Packaging Transition Creating High-Value Healthcare Opportunity: The FDA's focus on pediatric drug packaging safety, combined with major pharmaceutical companies' sustainable packaging commitments, is creating demand for sustainable pharmaceutical packaging that meets both performance and sustainability requirements.
Market Challenges
- Mono-Material Recyclable Packaging Performance Trade-offs versus Multi-Layer Conventional: Transitioning to mono-material recyclable packaging from multi-layer conventional laminates typically involves performance trade-offs in barrier properties, shelf life, and moisture resistance.
- rPET and Recycled Fiber Supply Chain Volatility Affecting Pricing Predictability: US rPET supply is structurally constrained, generating insufficient rPET feedstock to support ambitious CPG brand recycled content commitments. rPET price volatility complicates long-term green packaging pricing models.
Emerging Market Trends
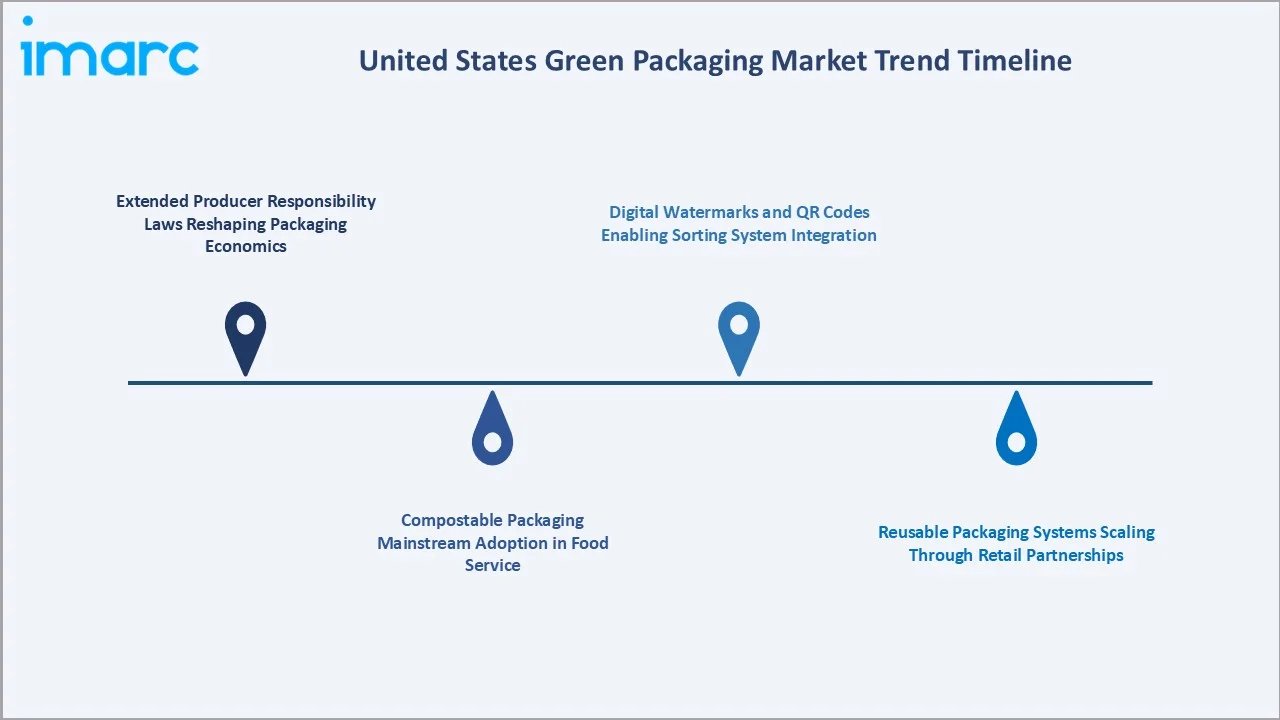
1. Extended Producer Responsibility Laws Reshaping Packaging Economics
Extended Producer Responsibility (EPR) laws are reshaping packaging economics by shifting waste management costs to producers, pushing companies to adopt recyclable, lightweight, and cost-efficient packaging designs. This is emerging as a key trend in the market, accelerating circular economy practices and sustainable material adoption.
2. Compostable Packaging Mainstream Adoption in Food Service
Compostable packaging is gaining mainstream adoption in food service as restaurants and delivery platforms shift toward biodegradable alternatives to meet sustainability goals and regulatory requirements. This shift is supported by rising consumer preference for eco-friendly dining options and expanding composting infrastructure across the US.
3. Reusable Packaging Systems Scaling Through Retail Partnerships
Reusable packaging systems are scaling through retail partnerships as brands collaborate with retailers to introduce refill, return, and reuse models that reduce single-use waste. In August 2025, the Sustainable Packaging Coalition introduced a new initiative through its Store Drop-off Film Recovery Collaborative to create a How2Recycle label that supports multiple collection methods for films and flexible packaging.
4. Digital Watermarks and QR Codes Enabling Sorting System Integration
Digital watermarks and QR codes are improving sorting system integration by enabling automated identification and accurate separation of packaging materials in recycling facilities. This enhances recycling efficiency, supports material traceability, and helps optimize circular packaging systems across the U.S. market.
Industry Value Chain Analysis
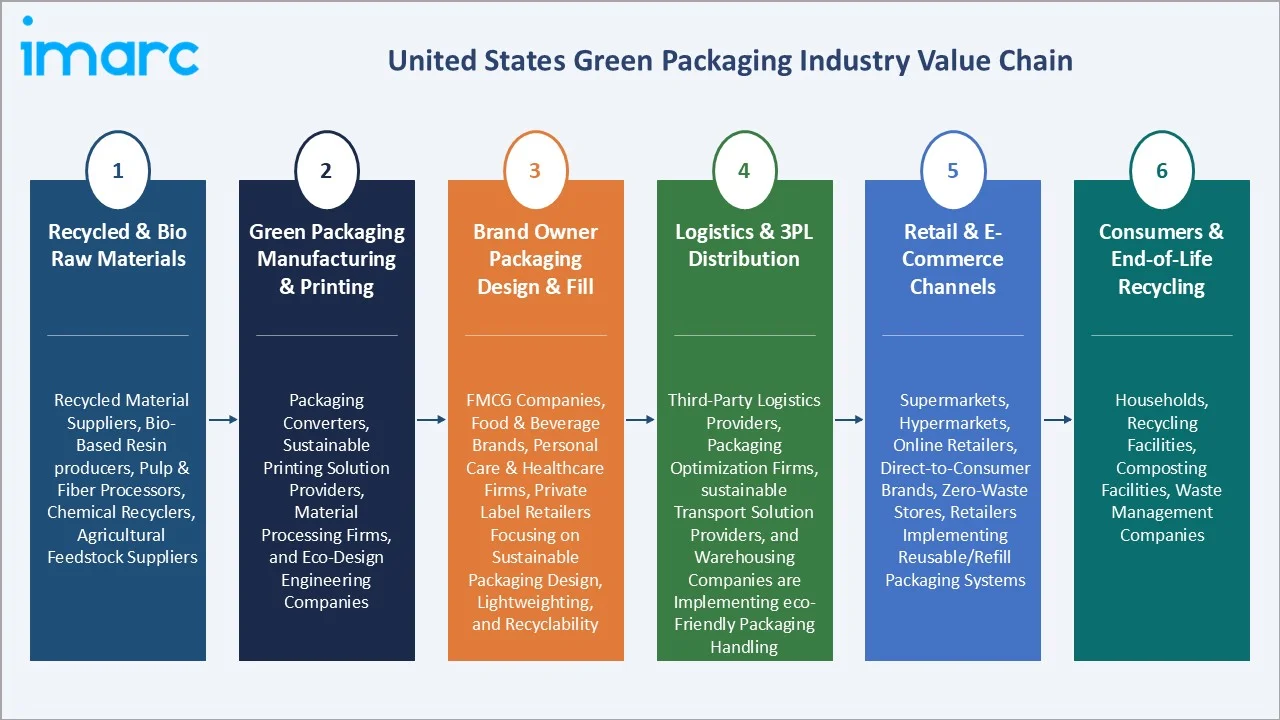
The US green packaging value chain integrates recycled material collection and processing, bio-based raw material production, packaging manufacturing and conversion, brand owner filling and design, logistics, and end-of-life collection and recovery, serving US consumers generating USD 76.79 Billion in sustainable packaging revenues (2025). Packaging manufacturers capture 30-45% gross margins on specialty sustainable products versus 20-30% for commodity conventional packaging.
|
Stage |
Key Participants |
|
Recycled & Bio Raw Materials |
Recycled material suppliers (paper, plastics, metals), bio-based resin producers (PLA, PHA, starch blends), pulp & fiber processors, chemical recyclers, agricultural feedstock suppliers |
|
Green Packaging Manufacturing & Printing |
Packaging converters (flexible, rigid, molded fiber), sustainable printing solution providers (water-based inks, digital printing), material processing firms, and eco-design engineering companies |
|
Brand Owner Packaging Design & Fill |
FMCG companies, food & beverage brands, personal care & healthcare firms, private label retailers focusing on sustainable packaging design, lightweighting, and recyclability |
|
Logistics & 3PL Distribution |
Third-party logistics providers, packaging optimization firms, sustainable transport solution providers, and warehousing companies are implementing eco-friendly packaging handling |
|
Retail & E-Commerce Channels |
Supermarkets, hypermarkets, online retailers, direct-to-consumer brands, zero-waste stores, retailers implementing reusable/refill packaging systems |
|
Consumers & End-of-Life Recycling |
Households, recycling facilities, composting facilities, waste management companies |
The US green packaging value chain's most strategically contested tier is raw material supply; rPET, recycled paperboard fiber, and bio-based polymers are all structurally supply-constrained versus demand growth targets. Packaging manufacturers with backward integration into recycling infrastructure have structural competitive advantages over manufacturers reliant on spot market recycled material procurement in a supply-constrained market.
Technology Landscape in the United States Green Packaging Industry
Mono-Material Recyclable Flexible Packaging Technology
Transitioning flexible packaging from conventional multi-layer laminates (PET/metallized/PE) to mono-material recyclable structures is the US packaging industry's most active R&D area. It also supports lightweight packaging, lower material waste, and brand compliance with recyclability targets and EPR-driven packaging requirements.
Bio-Based and Compostable Polymer Technology
Bio-based and compostable polymer technology enables the shift from fossil-based plastics to renewable materials like PLA, PHA, and starch blends, reducing carbon footprint and landfill dependency. It supports regulatory compliance and rising demand from food service and retail sectors for packaging with improved end-of-life sustainability.
AI-Powered Packaging Design Optimization
Artificial intelligence is transforming US sustainable packaging design, enabling simultaneous optimization of structural performance, material minimization, recyclability, and manufacturing efficiency within compressed design timelines. In October 2025, gCurv introduced its AI-powered sustainability platform, “Packgine,” an enterprise-grade solution built to automate packaging compliance. The platform delivers real-time lifecycle analytics, streamlines regulatory reporting such as EPR, and offers AI-based insights to help brands cut costs, achieve climate targets, and manage complex international packaging regulations.
Market Segmentation Analysis
The report covers the following segments:
|
Segment Category |
Leading Segment |
Market Share |
Year |
|
Packaging Type |
Recycled Content Packaging |
46.7% |
2025 |
|
End Use Industry |
Food Industry |
34.8% |
2025 |
|
Region |
West |
28.6% |
2025 |

By Packaging Type
Recycled content packaging leads at 46.7% market share (2025). This category encompasses recycled corrugated cardboard, rPET beverage bottles, recycled-content glass containers, and recycled aluminum cans. Recycled content packaging grows at ~3.6% CAGR (2026-2034) as state minimum recycled content laws systematically expand mandatory recycled content percentages and material categories, creating guaranteed demand growth independent of brand voluntary commitments.
To access detailed market analysis, Request Sample
Reusable packaging at 31.5% serves industrial returnable packaging (durable plastic totes, crates, pallets) and growing consumer reuse programs. Reusable grows at ~4.3% CAGR driven by retail expansion, corporate return-to-supplier reuse mandates, and B2B industrial packaging reuse systems. Degradable packaging at 21.8% grows fastest at ~4.8% CAGR as composting mandates in municipalities accelerate mass-market certified compostable food service packaging adoption beyond specialist natural food channels.
By End Use Industry
Food industry leads at 34.8% market share (2025). The US food industry, encompassing fresh produce, shelf-stable foods, frozen foods, and food service packaging, generates the largest single green packaging end use, driven by supplier codes requiring sustainable packaging, sustainability standards, and major food brand commitments. Food packaging's sustainability transition is accelerated by consumer-facing sustainability claims directly supporting retail shelf velocity and premium pricing, creating commercial ROI alongside regulatory compliance.
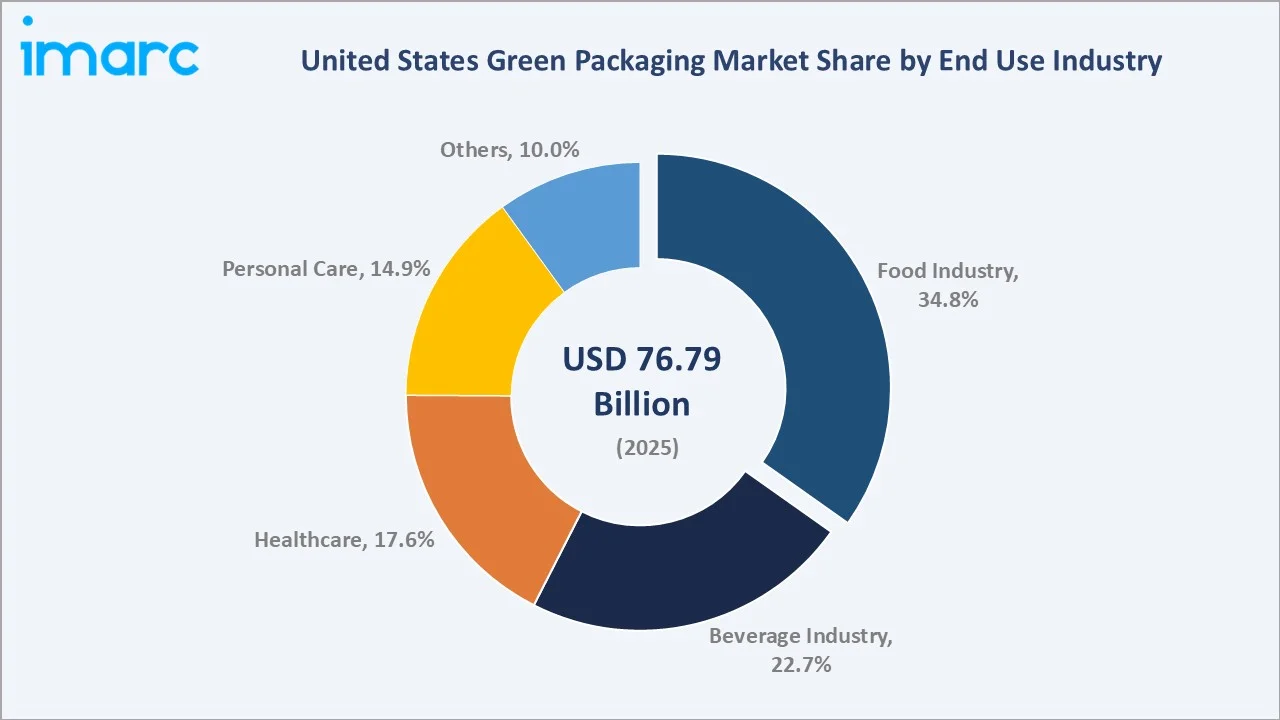
The beverage industry at 22.7% grows at ~4.1% CAGR, as rPET bottle targets escalate. Healthcare at 17.6% is driven by pharmaceutical packaging mandates. Personal care at 14.9% benefits from L'Oréal, Unilever, and P&G sustainable beauty packaging transitions. Others at 10.0% includes e-commerce, pet food, and household products.
Regional Market Insights
|
Region |
Share (2025) |
Key Growth Drivers & Characteristics |
|
West |
28.6% |
Strong environmental regulations and sustainability mandates; high adoption of recyclable and compostable packaging; presence of sustainability-focused brands and tech-driven packaging innovation hubs |
|
South |
26.3% |
Rapid growth in food & beverage and e-commerce sectors; increasing adoption of cost-effective, sustainable packaging; expanding manufacturing base for paper, corrugated, and flexible packaging |
|
Midwest |
23.1% |
Established manufacturing and packaging production hub; strong presence of paper, pulp, and recycled material industries; growing adoption of recycled-content packaging |
|
Northeast |
22.0% |
High consumer awareness and willingness to pay for eco-friendly packaging; strong retail and e-commerce presence; focus on circular economy practices, reuse models, and sustainable material innovation |
The West's 28.6% leadership reflects California's unique position as one of the largest economies. California's SB 54 mandate is generating an opportunity in California-specific sustainable packaging investment, attracting packaging manufacturer capacity expansion to serve the California market.
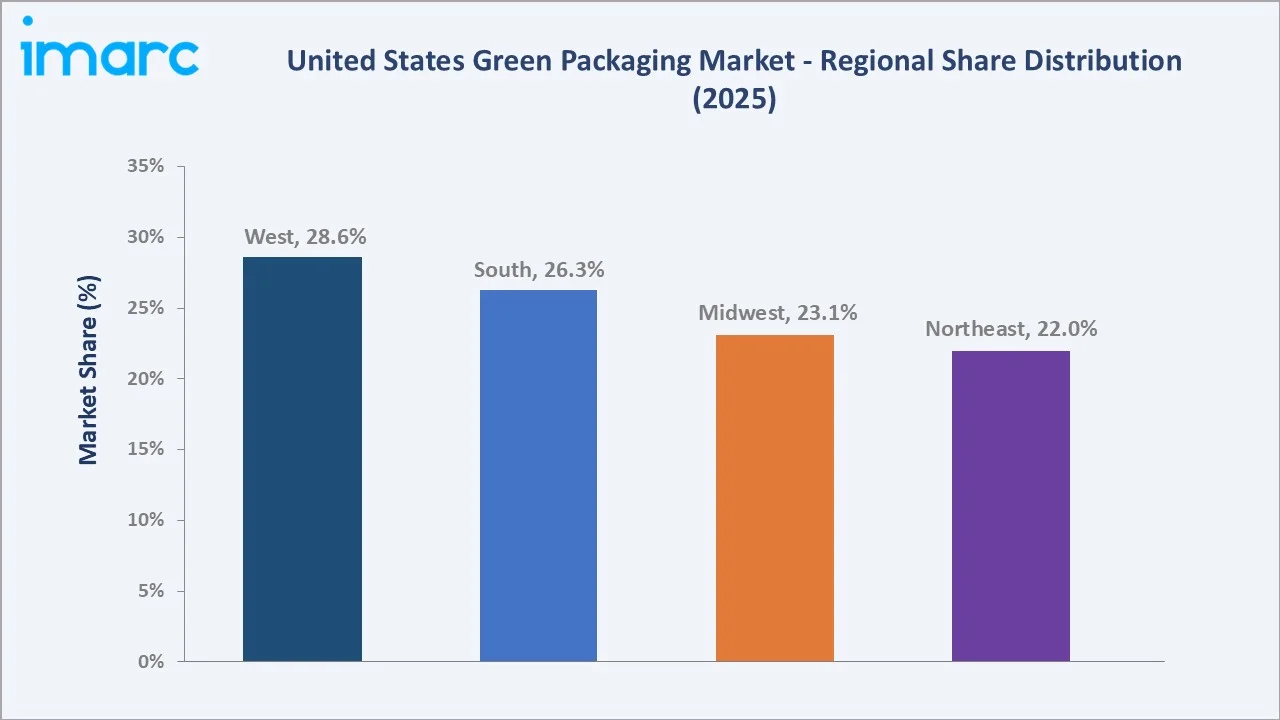
The South's 26.3% is driven by Texas's large food and beverage manufacturing sector represent billions in annual sustainable packaging procurement. The Northeast's 22.0% benefits from New York's packaging initiatives and the highest US per-capita consumer sustainability premium willingness, particularly in New York City and Boston metropolitan markets.
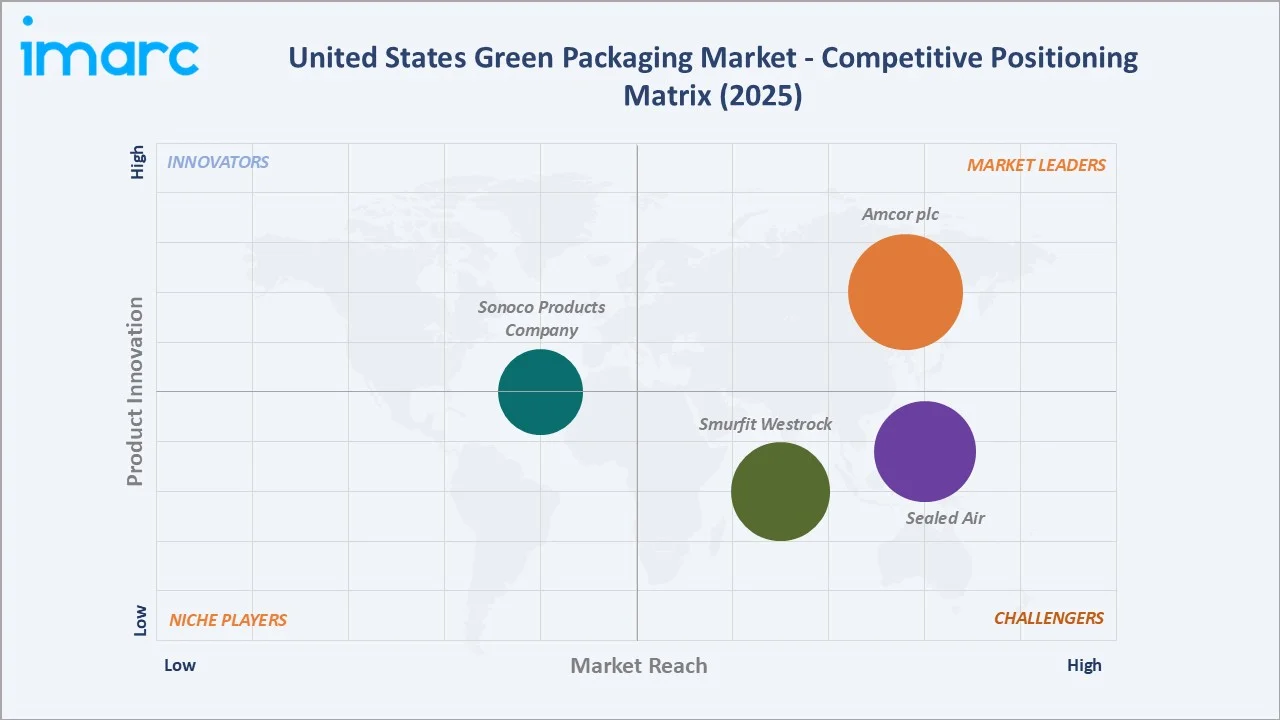
Competitive Landscape
The US green packaging market is moderately concentrated at the tier-1 manufacturer level and highly fragmented below, with hundreds of regional converters, specialty sustainable packaging companies, and bio-based material startups competing in specific material and end-use niches. Market concentration is highest in flexible film packaging and lowest in compostable food service packaging.
|
Company Name |
Brand |
Market Position |
Core Strength |
|
Amcor plc |
AmLite HeatFlex, AmSky, AmPrima, AmFiber |
Market Leader |
Amcor offer a wide variety of options to advance sustainability while meeting consumer-specific packaging needs. |
|
Sealed Air |
BUBBLE WRAP, CRYOVAC, SEALED AIR, AUTOBAG, and LIQUIBOX |
Strong Challenger |
Sealed Air's brands deliver innovative packaging solutions that protect products, extend shelf life, and enhance operational efficiency across various industries. |
|
Smurfit Westrock |
Smurfit Westrock |
Established Player |
Smurfit Westrock offers an extensive portfolio of solutions from corrugated boxes and folding cartons to Bag-in-Box packaging that is designed to promote and protect our customers’ products. |
|
Sonoco Products Company |
Sonoco Paper Can |
Established Player |
From stacked chips to baked beans, Sonoco’s sustainable paper packaging preserves freshness and maintains quality. |
The competitive landscape is being reshaped by EPR legislation, creating structural incentives for recyclable packaging design. Packaging companies with a portfolio breadth covering EPR-compliant alternatives across all material categories are better positioned to maintain customer relationships through regulatory transitions versus specialists in specific packaging formats that may face declining demand as EPR fee structures penalize their core products.
Key Company Profiles
Amcor plc
Amcor is one of the largest flexible packaging companies and the US green packaging market's technology and scale leader.
- Brands: AmLite HeatFlex, AmSky, AmPrima, AmFiber.
- Recent Developments: In April 2025, Amcor plc completed its all-stock merger with Berry Global, strengthening its position in consumer and healthcare packaging. The combination enhances material science and innovation capabilities, unlocking new growth opportunities and generating about $650 million in synergies to drive long-term value.
- Strategic Focus: Merger with Berry Global, creating scale to invest in sustainable packaging R&D; AmFiber paper-based alternative to plastic flexible packaging.
Sealed Air
Sealed Air is the US market leader in protective and food packaging, with its sustainability pledge targeting recyclable or reusable materials across its portfolio.
- Brands: BUBBLE WRAP, CRYOVAC, SEALED AIR, AUTOBAG, and LIQUIBOX.
- Recent Developments: In April 2026, Sealed Air announced the completion of its acquisition by funds affiliated with CD&R. With the completion of the transaction, Sealed Air stockholders are entitled to receive $42.15 in cash for each share of Sealed Air common stock owned as of immediately prior to the effective time of the merger.
- Strategic Focus: Paper-based alternatives to plastic protective packaging, capturing US e-commerce's plastic reduction mandates.
Market Concentration Analysis
The US green packaging market is moderately concentrated at the tier-1 level. Amcor, Sealed Air, and Smurfit Westrock collectively represent approximately 35-40% of US green packaging revenues (2025). The planned Amcor-Berry Global merger will increase concentration significantly in flexible packaging, where the combined entity will hold approximately 40-45% of US sustainable flexible packaging revenues upon completion. Market fragmentation increases dramatically in specialty sustainable packaging segments, compostable food service packaging, bio-based rigid packaging, and reusable packaging systems, where innovation pace and niche expertise create positions for specialized companies. This fragmented innovation tier is where the fastest-growing green packaging segments are developing.
Investment & Growth Opportunities
Fastest Growing Segments
Degradable/compostable packaging (~4.8% CAGR), reusable packaging (~4.3% CAGR), beverage sustainable packaging (~4.1% CAGR), chemical recycling-derived rPET and rPP (~20%+ CAGR from a small base), and paper-based plastic replacement packaging (~8-10% CAGR) represent the US green packaging market's highest-growth investment vectors through 2034. Paper-based alternatives to plastic packaging - driven by single-use plastic restrictions in 12 states and e-commerce void fill substitution - represents the single highest-conviction growth trajectory as fiber packaging performance advances enable plastic replacement across previously infeasible applications.
Investment Themes
- EPR-optimized recyclable flexible packaging: EPR fee structures financially reward recyclable mono-material flexible packaging over conventional multi-layer laminates. Investment in all-PE and all-PP recyclable flexible packaging manufacturing capacity, combined with PE film collection and recycling infrastructure, creates a vertically integrated circular flexible packaging platform positioned to capture the most EPR-impactful packaging transition in the US market.
- Composting infrastructure expansion: The US's limited industrial composting facilities represent a critical constraint on compostable packaging's addressable market. Investment in composting facility development, specifically targeting metro areas with municipal composting mandates and food service compostable packaging ordinances, creates guaranteed feedstock streams from compostable packaging collection programs, enabling compostable packaging market expansion in currently infrastructure-limited markets.
Future Market Outlook (2026-2034)
The US green packaging market is projected to grow from USD 76.79 Billion in 2025 to USD 108.34 Billion by 2034, delivering a 3.90% CAGR over the forecast period. The market's anchor value of USD 92.98 Billion in 2030 reflects a fundamentally transformed US packaging landscape. The Amcor-Berry Global merger alone represents a structural market transformation that will create a sustainable packaging entity with unprecedented investment capacity for the sector's next generation of innovation.
Three structural forces define the US green packaging market's trajectory with exceptional certainty through 2034: California's SB 54 implementation creating mandatory milestone targets that convert all California-sold packaging to recyclable or compostable formats; EPR legislation expansion, creating systematic financial penalties for non-recyclable packaging that accelerate voluntary conversion beyond minimum compliance; and chemical recycling infrastructure scaling unlocking the certified circular polymer supply needed to meet CPG brand recycled content commitments that mechanical recycling alone cannot satisfy.
Research Methodology
Primary Research
Primary research comprised structured interviews with 75+ industry stakeholders (2025), including sustainability directors; packaging R&D leads; EPR program managers; Sustainable Packaging Coalition (SPC) staff and member company representatives; CalRecycle policy analysts; and retail sustainability buyers.
Secondary Research
Secondary research encompassed Sustainable Packaging Coalition State of Sustainability 2025, CalRecycle SB 54 implementation reports, EPA National Overview of Solid Waste and Recycling 2024, NielsenIQ Sustainable Consumer Survey 2024, Plastic Pollution Coalition state legislation tracker, AFPA (American Forest & Paper Association) recycling rate data, FMI food packaging sustainability standards, company sustainability reports, and packaging industry trade publications. Over 120 secondary sources were reviewed.
Forecasting Models
Market revenue forecasts were developed using bottom-up segmental models incorporating packaging type demand scenarios calibrated against state plastic ban implementation timelines, CPG brand sustainable packaging commitment deadlines, Sustainable Packaging Coalition member survey data, and retail channel sustainability code enforcement timelines. Key inputs include California SB 54 milestone targets, EPR state expansion scenarios, chemical recycling capacity expansion forecasts, and CPG brand sustainable packaging commitment implementation schedules through 2034.
United States Green Packaging Market Report Scope:
| Report Features | Details |
|---|---|
| Base Year of the Analysis | 2025 |
| Historical Period | 2020-2025 |
| Forecast Period | 2026-2034 |
| Units | Billion USD |
| Scope of the Report | Exploration of Historical and Forecast Trends, Industry Catalysts and Challenges, Segment-Wise Historical and Predictive Market Assessment:
|
| Packaging Types Covered |
|
| End Use Industries Covered | Food Industry, Beverage Industry, Healthcare Industry, Personal Care Industry, Others |
| Regions Covered | Northeast, Midwest, South, West |
| Companies Covered | Amcor plc, Sealed Air, Smurfit Westrock, Sonoco Products Company |
| Customization Scope | 10% Free Customization |
| Post-Sale Analyst Support | 10-12 Weeks |
| Delivery Format | PDF and Excel through Email (We can also provide the editable version of the report in PPT/Word format on special request) |
Key Benefits for Stakeholders:
- IMARC’s report offers a comprehensive quantitative analysis of various market segments, historical and current market trends, market forecasts, and dynamics of the United States green packaging market from 2020-2034.
- The research study provides the latest information on the market drivers, challenges, and opportunities in the United States green packaging market.
- Porter's five forces analysis assist stakeholders in assessing the impact of new entrants, competitive rivalry, supplier power, buyer power, and the threat of substitution. It helps stakeholders to analyze the level of competition within the United States green packaging industry and its attractiveness.
- Competitive landscape allows stakeholders to understand their competitive environment and provides an insight into the current positions of key players in the market.
Frequently Asked Questions About the United States Green Packaging Market Report
The US green packaging market reached USD 76.79 Billion in 2025, driven by 12-state plastic bans, CPG brand ESG packaging commitments, consumer sustainability premium willingness, and e-commerce sustainable packaging mandates from Amazon and major US retailers.
The market grows at 3.90% CAGR during 2026-2034, reaching USD 108.34 Billion by 2034, driven by California SB 54 implementation, EPR legislation expansion, chemical recycling scale-up, and compostable packaging mandatory adoption in US municipalities.
Recycled content packaging leads at 46.7% (2025), anchored by recycled corrugated cardboard, rPET beverage bottles, and recycled-content glass and aluminum packaging.
Degradable packaging grows fastest at ~4.8% CAGR (2026-2034), driven by US municipalities mandating compostable food service packaging, composting infrastructure expansion funded by EPR legislation.
Food industry leads at 34.8% (2025), driven by Walmart and Target supplier sustainability codes, major food brand ESG packaging commitments, and consumer sustainability premium willingness supporting green packaging premium pricing in retail food categories.
The West leads at 28.6% (2025), driven by California's SB 54 mandate requiring 100% recyclable or compostable packaging by 2032 and plastic ban legislation creating the nation's most comprehensive state regulatory green packaging framework.
Leading companies include Amcor plc, Sealed Air, Smurfit Westrock, Sonoco Products Company, and among others.
The market is projected to reach approximately USD 92.98 Billion by 2030, driven by California SB 54 milestone targets, EPR expansion, chemical recycling plants supplying certified circular polymers, and compostable packaging expansion to US municipal mandates.
California's SB 54 requires 100% recyclable or compostable packaging by 2032, driving California-specific sustainable packaging investment and effectively setting national voluntary packaging standards through the commercial necessity of California compliance for national US brands.
Extended Producer Responsibility (EPR) laws require packaging producers to pay per-ton fees based on recyclability, generating annually for composting and recycling infrastructure, while financially penalizing non-recyclable packaging formats and incentivizing sustainable packaging transitions.
Need more help?
- Speak to our experienced analysts for insights on the current market scenarios.
- Include additional segments and countries to customize the report as per your requirement.
- Gain an unparalleled competitive advantage in your domain by understanding how to utilize the report and positively impacting your operations and revenue.
- For further assistance, please connect with our analysts.
 Request Customization
 Speak to an Analyst
 Request Brochure
 Inquire Before Buying
Benefits of Customization
- Personalize this research
- Triangulate with your data
- Get data as per your format and definition
- Gain a deeper dive into a specific application, geography, customer, or competitor
- Any level of personalization
Get in Touch With Us
UNITED STATES
Phone: +1-201-971-6302
INDIA
Phone: +91-120-433-0800
UNITED KINGDOM
Phone: +44-753-714-6104
Email: [email protected]
Client Testimonials


.webp)


