
United States Microdisplay Market Report by Product (Near-To-Eye (NTE) Devices, Head-Up Display (HUD), Projector, and Others), Technology (Liquid Crystal Display (LCD), Liquid Crystal on Silicon (LCOS), Organic Light-Emitting Diode (OLED), Digital Light Processing (DLP)), Resolution (Lower Than HD, HD, FHD, Higher Than FHD), Brightness (Less Than 500 Nits, 500–1,000 Nits, More Than 1,000 Nits), End User (Consumer, Industrial and Enterprise, Automotive, Military, Defense, and Aerospace, Sports and Entertainment, Retail and Hospitality, Medical, Education, and Others), and Region 2026-2034
United States Microdisplay Size Overview:
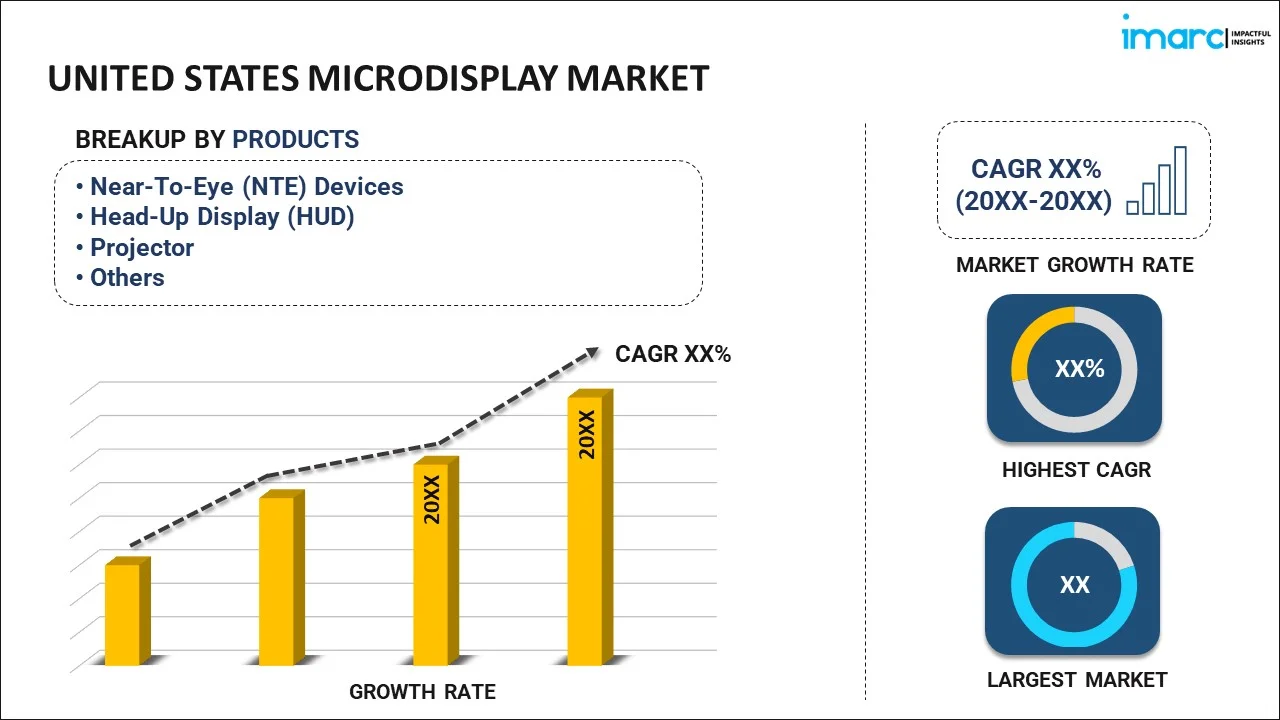
The United States microdisplay market size reached USD 1,130.2 Million in 2025. Looking forward, IMARC Group expects the market to reach USD 4,034.8 Million by 2034, exhibiting a growth rate (CAGR) of 14.73% during 2026-2034.
|
Report Attribute
|
Key Statistics
|
|---|---|
|
Base Year
|
2025
|
|
Forecast Years
|
2026-2034
|
|
Historical Years
|
2020-2025
|
|
Market Size in 2025
|
USD 1,130.2 Million |
|
Market Forecast in 2034
|
USD 4,034.8 Million |
| Market Growth Rate (2026-2034) | 14.73% |
Access the full market insights report Request Sample
A microdisplay refers to a small-sized screen with a diagonal size less than two inches. It is utilized in rear-projection television (TVs), head-mounted displays (HMDs), head-up displays (HUDs), data projector, Near-to-Eye (NTE) devices and viewfinders in digital cameras. A microdisplay can be either transmissive or reflective in type, depending on their mode of transmission of light through the display unit. The transmissive microdisplays are generally used in backlit laptop screens, while the reflective microdisplays are used in Digital Light Processing (DLP) projects.
The United States microdisplay market is primarily driven by the increasing use of microdisplays in various industries such as military and defense, consumer electronics, and healthcare. They are extensively used in these sectors due to their high resolution, excellent picture quality, low power consumption and compact size. The rapid advancements in display technology represent another factor propelling the growth of the market. For instance, next-generation display technologies such as optical waveguides and MEMS-based laser scanning allow HUD manufacturers to reduce the size of HUDs. Furthermore, the increasing popularity of augmented/ virtual reality (AR/VR) enabled devices, coupled with the development of high-definition and ultra-high-definition microdisplay screens, have also increased the demand for microdisplays across the country.
Key Market Segmentation:
IMARC Group provides an analysis of the key trends in each sub-segment of the United States microdisplay market report, along with forecasts at the country and regional levels from 2026-2034. Our report has categorized the market based on product, technology, resolution, brightness and end user.
Breakup by Product:
To get detailed segment analysis of this market Request Sample
- Near-To-Eye (NTE) Devices
- Head-Up Display (HUD)
- Projector
- Others
Breakup by Technology:
- Liquid Crystal Display (LCD)
- Liquid Crystal on Silicon (LCOS)
- Organic Light-Emitting Diode (OLED)
- Digital Light Processing (DLP)
Breakup by Resolution:
- Lower Than HD
- HD
- FHD
- Higher Than FHD

Breakup by Brightness:
- Less Than 500 Nits
- 500–1,000 Nits
- More Than 1,000 Nits
Breakup by End User:
- Consumer
- Industrial and Enterprise
- Automotive
- Military, Defense, and Aerospace
- Sports and Entertainment
- Retail and Hospitality
- Medical
- Education
- Others
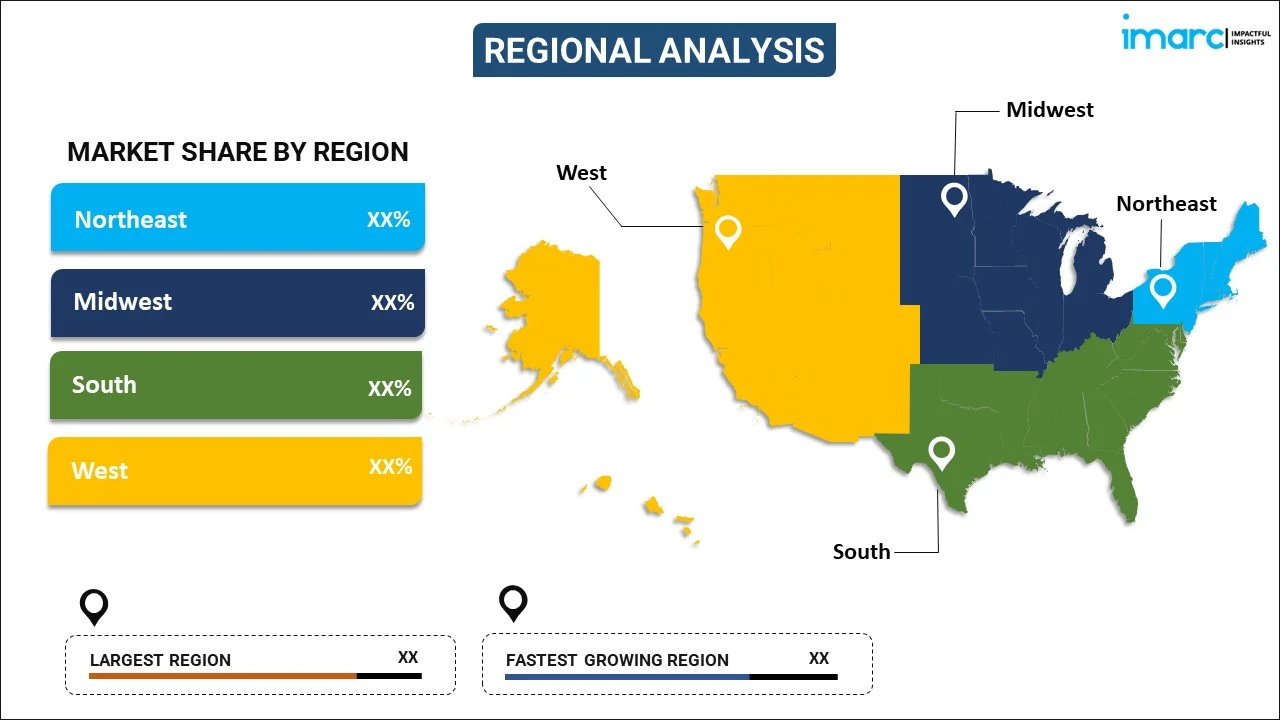
Breakup by Region:
To get detailed regional analysis of this market Request Sample
- Northeast
- Midwest
- South
- West
Competitive Landscape:
The competitive landscape of the industry has also been examined along with the profiles of the key players.
Report Coverage:
| Report Features | Details |
|---|---|
| Base Year of the Analysis | 2025 |
| Historical Period | 2020-2025 |
| Forecast Period | 2026-2034 |
| Units | Million USD |
|
Scope of the Report
|
Exploration of Historical and Forecast Trends, Industry Catalysts and Challenges, Segment-Wise Historical and Predictive Market Assessment:
|
| Products Covered | Near-To-Eye (NTE) Devices, Head-Up Display (HUD), Projector, Others |
| Technologies Covered | Liquid Crystal Display (LCD), Liquid Crystal on Silicon (LCOS), Organic Light-Emitting Diode (OLED), Digital Light Processing (DLP) |
| Resolutions Covered | Lower Than HD, HD, FHD, Higher Than FHD |
| Brightness Covered | Less Than 500 Nits, 500–1,000 Nits, More Than 1,000 Nits |
| End Users Covered | Consumer, Industrial and Enterprise, Automotive, Military, Defense, and Aerospace, Sports and Entertainment, Retail and Hospitality, Medical, Education, Others |
| Regions Covered | Northeast, Midwest, South, West |
| Customization Scope | 10% Free Customization |
| Post-Sale Analyst Support | 10-12 Weeks |
| Delivery Format | PDF and Excel through Email (We can also provide the editable version of the report in PPT/Word format on special request) |
Key Questions Answered in This Report:
- How has the United States microdisplay market performed so far and how will it perform in the coming years?
- What has been the impact of COVID-19 on the United States microdisplay market?
- What are the key regional markets?
- What is the breakup of the market based on the product?
- What is the breakup of the market based on the technology?
- What is the breakup of the market based on the resolution?
- What is the breakup of the market based on the brightness?
- What is the breakup of the market based on the end user?
- What are the various stages in the value chain of the industry?
- What are the key driving factors and challenges in the industry?
- What is the structure of the United States microdisplay market and who are the key players?
- What is the degree of competition in the industry?
Need more help?
- Speak to our experienced analysts for insights on the current market scenarios.
- Include additional segments and countries to customize the report as per your requirement.
- Gain an unparalleled competitive advantage in your domain by understanding how to utilize the report and positively impacting your operations and revenue.
- For further assistance, please connect with our analysts.
 Request Customization
 Speak to an Analyst
 Request Brochure
 Inquire Before Buying
Benefits of Customization
- Personalize this research
- Triangulate with your data
- Get data as per your format and definition
- Gain a deeper dive into a specific application, geography, customer, or competitor
- Any level of personalization
Get in Touch With Us
UNITED STATES
Phone: +1-201-971-6302
INDIA
Phone: +91-120-433-0800
UNITED KINGDOM
Phone: +44-753-714-6104
Email: [email protected]
Client Testimonials


.webp)


