
United States Real Estate Market Size, Share, Trends and Forecast by Property, Business, Mode, and Region, 2026-2034
United States Real Estate Market Size, Share, Trends & Forecast (2026-2034)
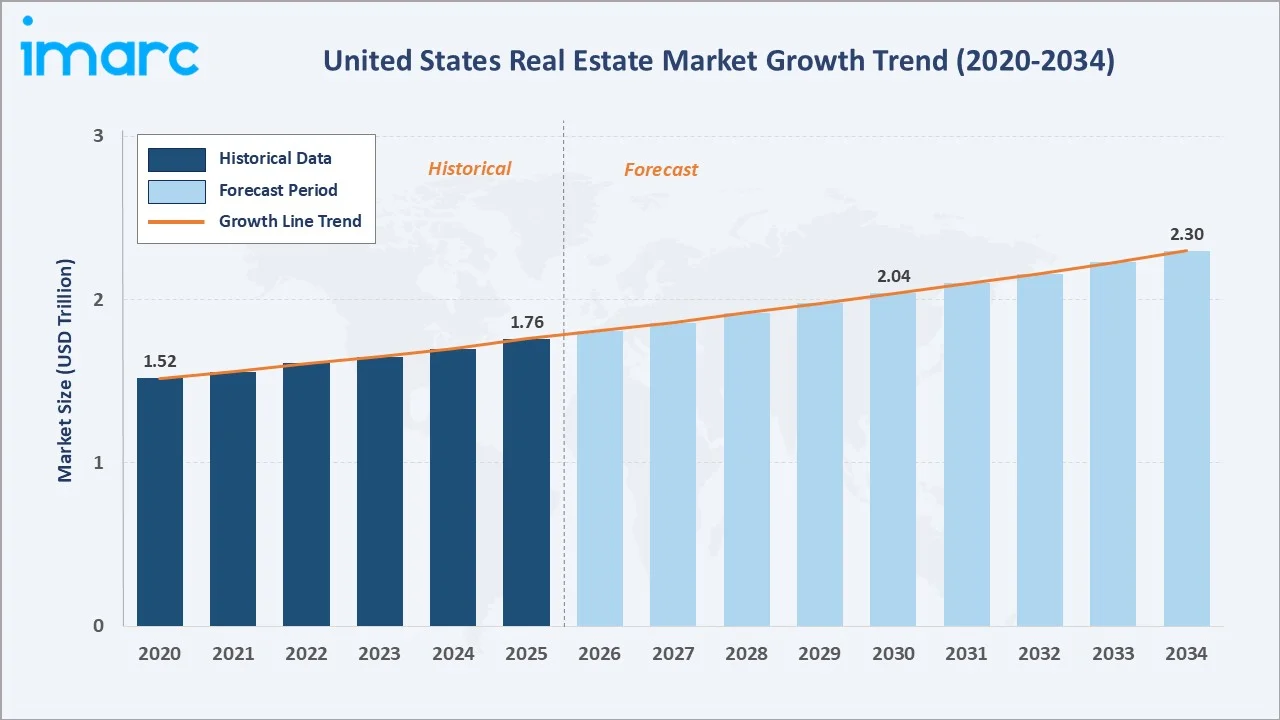
The United States real estate market size was valued at USD 1.76 Trillion in 2025 and is projected to reach USD 2.30 Trillion by 2034, exhibiting a CAGR of 2.98% during 2026-2034. Rising adaptive reuse of commercial properties, rapid expansion of single-family build-to-rent communities, and deep integration of artificial intelligence across property operations are together driving United States real estate market growth. Sales transactions dominate with a 62.8% share in 2025, while the offline mode of engagement accounts for 71.5% of the national market. The South region leads with a 38.9% share in 2025, supported by strong in-migration and pro-business policy environments.
Market Snapshot
|
Metric |
Value |
|
Market Size (2025) |
USD 1.76 Trillion |
|
Forecast Market Size (2034) |
USD 2.30 Trillion |
|
CAGR (2026-2034) |
2.98% |
|
Base Year |
2025 |
|
Historical Period |
2020-2025 |
|
Forecast Period |
2026-2034 |
|
Largest Region |
South (38.9% share, 2025) |
|
Fastest Growing Region |
South |
|
Leading Business Segment |
Sales (62.8%, 2025) |
|
Leading Mode |
Offline (71.5%, 2025) |
The chart below tracks United States real estate market value from 2020 to 2034, capturing post-pandemic housing recovery, rate-cycle adjustments, and PropTech-driven expansion shaping the forecast path.
To get more information on this market, Request Sample
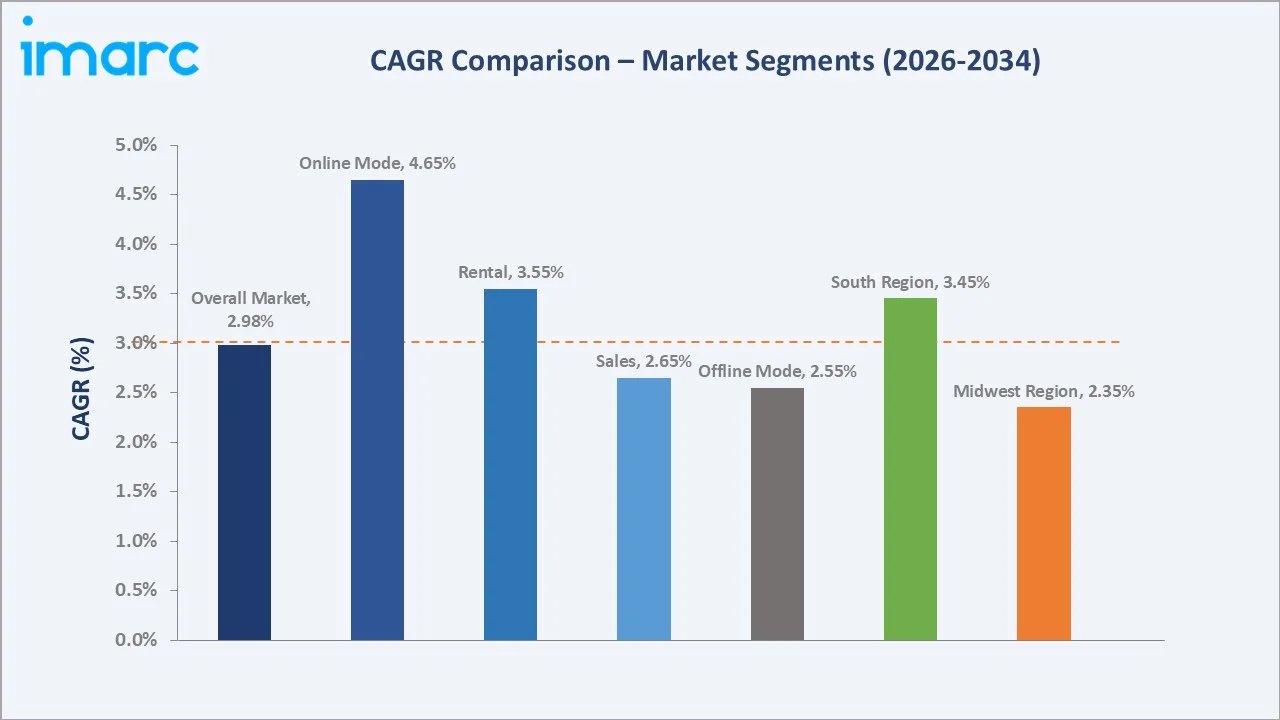
CAGR comparison highlights Sales transactions and Offline engagement as the dominant growth contributors in the United States real estate market through 2034, with online channels accelerating fastest.
Executive Summary
The United States real estate market is being reshaped by hybrid work, demographic rebalancing, and rapid digitization of property transactions. Valued at USD 1.76 Trillion in 2025, it is projected to reach USD 2.30 Trillion by 2034, at a 2.98% CAGR. Elevated rates during 2022-2024 tempered transaction volumes, yet structural demand from millennials, Sun Belt migration, and institutional capital continued to anchor long-term value expansion.
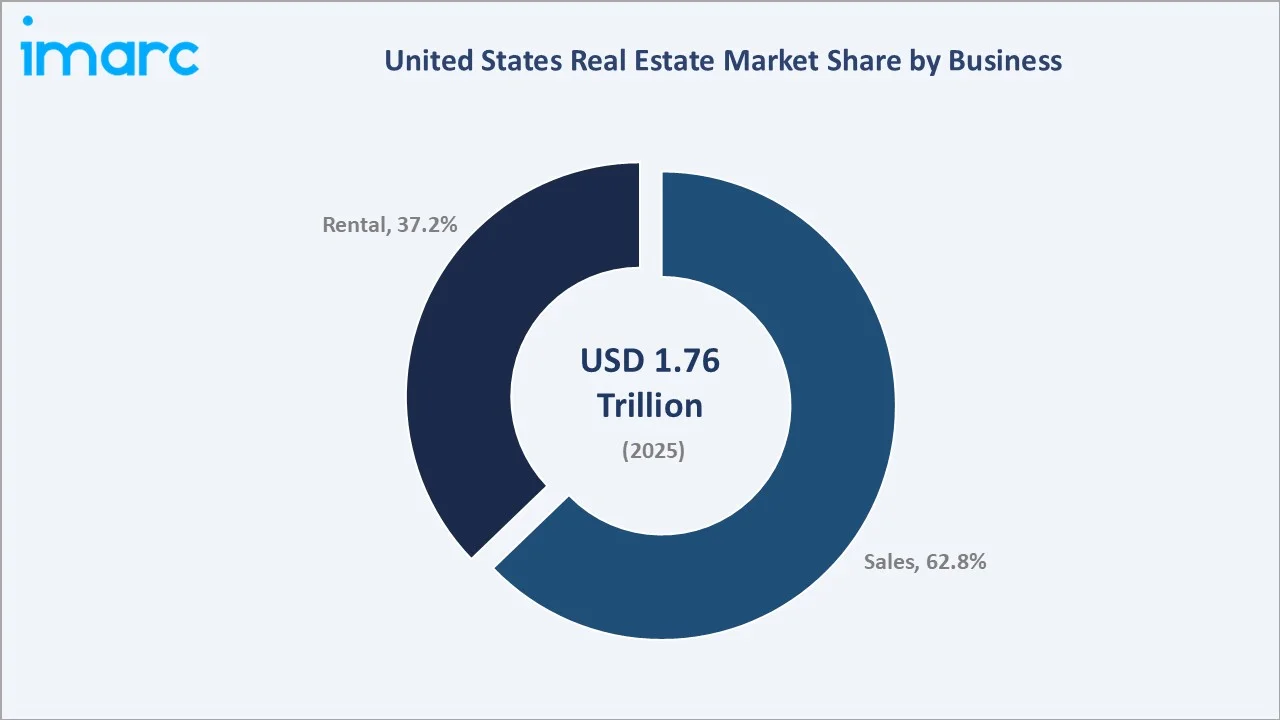
Sales lead with a 62.8% share in 2025, supported by steady residential turnover and commercial repricing, while rentals hold 37.2% on build-to-rent expansion. Offline channels account for 71.5% of revenue, and online platforms capture 28.5%, growing fastest via AI listings, virtual tours, and blockchain transactions. The South leads regions with a 38.9% share, followed by West (24.6%), Northeast (20.3%), and Midwest (16.2%).
Key Market Insights
|
Insight |
Data |
|
Largest Business Segment |
Sales - 62.8% share (2025) |
|
Second Business Segment |
Rental - 37.2% share (2025) |
|
Leading Mode |
Offline - 71.5% share (2025) |
|
Fastest-Growing Mode |
Online - 28.5% share (2025) |
|
Leading Region |
South - 38.9% revenue share (2025) |
|
Second Region |
West - 24.6% revenue share (2025) |
|
Top Companies |
CBRE, Compass, Anywhere, Keller Williams Realty, LLC, RE/MAX LLC. |
Key Analytical Observations Supporting the Above Data:
- Sales dominance at 62.8% in 2025 reflects deep transactional liquidity across residential and commercial assets, with existing home sales averaging nearly 4 million units annually.
- Rental at 37.2% in 2025 captures the structural affordability shift, with the United States median home price near USD 412,000 in 2024 and single-family build-to-rent starts reaching record highs.
- Offline channels at 71.5% in 2025 remain dominant in the United States, as most property transactions rely on agents for negotiations, inspections, and legal processes, with over 85–90% of buyers and sellers using brokerage services, particularly in high-value deals.
- Online penetration at 28.5% in 2025 is increasing rapidly in the United States, driven by strong traffic on platforms like Zillow, Redfin, and Realtor.com, alongside continued multi-billion-dollar global PropTech investments.
- South's 38.9% dominance in 2025 reflects its status as the largest U.S. region, supported by strong migration to Texas and Florida, along with favorable tax policies and ongoing corporate relocations, despite moderating growth.
United States Real Estate Market Overview
United States real estate includes the development, buying, selling, leasing, and management of residential, commercial, industrial, and land properties. The market comprises developers, REITs, brokerages, mortgage lenders, title insurers, PropTech firms, and institutional investors, operating under federal guidelines alongside diverse state and local regulations.
The industry spans single-family housing, multifamily apartments, offices, warehouses, retail centers, and raw land. Growth is driven by population migration into Sun Belt metros, remote-work-led suburban expansion, interest rate normalization, infrastructure spending under the IIJA, and the structural shift toward professionally managed rental housing.
Market Dynamics
To evaluate market opportunities, Request Sample
Market Drivers
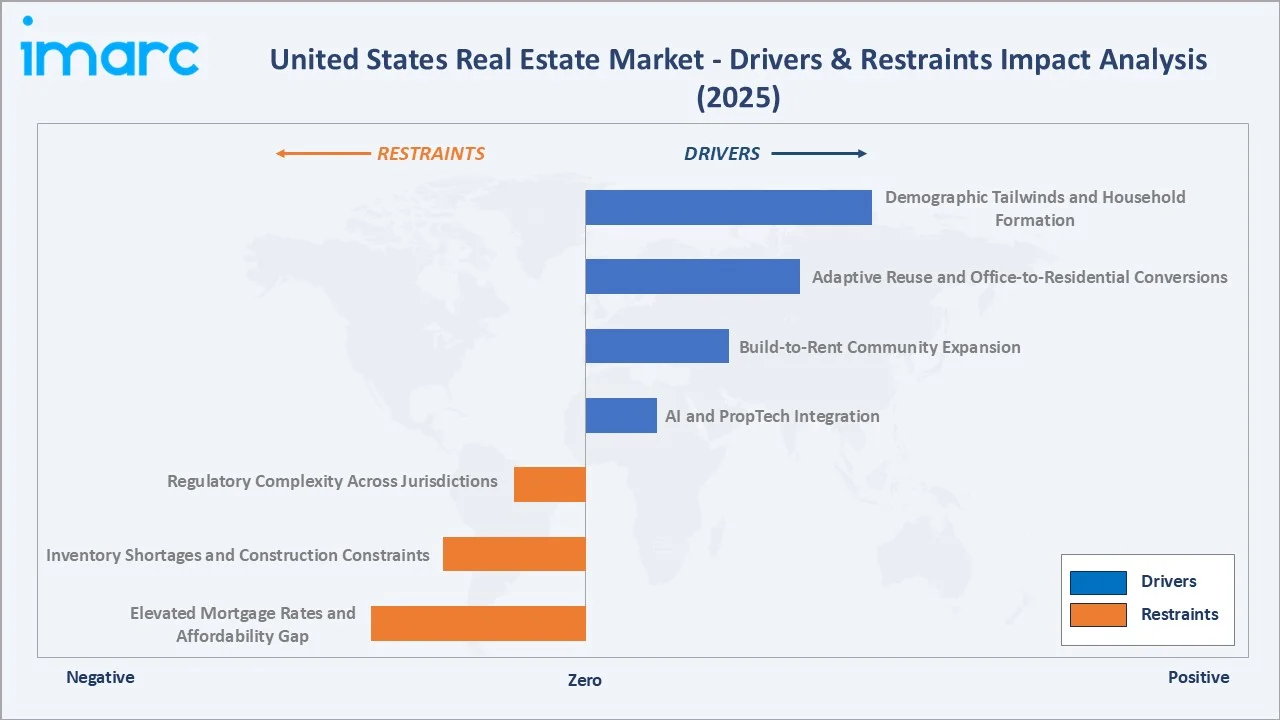
- Demographic Tailwinds and Household Formation: Millennials remain the largest homebuying cohort, supporting demand. The U.S. Census Bureau indicates strong household formation trends in recent years, net household formation averaged 1.5 million annually during 2022-2024.
- Adaptive Reuse and Office-to-Residential Conversions: Office-to-residential conversions are accelerating due to remote work trends. CBRE Group reports a growing pipeline of conversion projects, with a majority focused on multifamily housing, though exact project counts fluctuate by period.
- Build-to-Rent Community Expansion: Institutional investment in build-to-rent (BTR) housing is expanding across U.S. Sun Belt markets, driven by affordability constraints and rental demand. Firms like Invesco and Hunt Companies are actively funding single-family rental platforms.
- AI and PropTech Integration: Adoption of AI, automated valuation models, and digital platforms is improving real estate decision-making. CoreLogic provides nationwide property intelligence solutions, though coverage and platform capabilities evolve over time.
Market Restraints
- Elevated Mortgage Rates and Affordability Gap: As interest rates have risen, 30-year-mortgage rates are now expected to be 7.6% at the end of 2023, up from the previous estimate of 7.1%, reducing affordability. The Freddie Mac and National Association of Realtors report weakened affordability and existing home sales near multi-year lows.
- Inventory Shortages and Construction Constraints: Housing supply remains structurally constrained due to labor shortages, high construction costs, and zoning limits. The National Association of Realtors estimates a multi-million unit housing shortfall, while U.S. Census Bureau data shows supply lagging demand.
- Regulatory Complexity Across Jurisdictions: Zoning regulations, rent controls, and environmental approvals vary widely across U.S. cities, extending project timelines and increasing costs. Studies by National Bureau of Economic Research highlight how regulatory barriers significantly delay housing development and constrain supply responsiveness.
Market Opportunities
- Sun Belt Migration and Secondary City Expansion: Sun Belt states including Texas and Florida continue strong domestic migration, boosting housing demand. The U.S. Census Bureau reports these states among the fastest growing, supporting multifamily and rental development.
- Senior Housing and Healthcare Real Estate: Senior housing demand is rising with aging demographics. NIC reports improving occupancy levels, while the 65+ population is projected to expand significantly by 2030.
- Tokenization and Fractional Real Estate Investment: Fractional ownership and blockchain-based platforms are expanding access to real estate investment. Firms like RealT enable small-ticket participation, reflecting growing convergence of fintech and property markets.
Market Challenges
- Commercial Office Distress: National office vacancy hovered near 19% through 2024, with coastal central business districts experiencing further value resets. Loan maturities of over USD 1.5 Trillion in commercial real estate by the end of 2026 create refinancing and valuation pressure.
- Climate Risk and Insurance Cost Escalation: Florida, California, and Gulf Coast markets face rising homeowner insurance premiums and, in some cases, carrier withdrawal. Climate-adjusted underwriting is reshaping investment criteria across coastal and wildfire-exposed portfolios.
- Interest Rate Sensitivity and Cap Rate Repricing: Rising interest rates since 2022 have expanded cap rates and reduced property values, while U.S. commercial real estate transaction volumes declined significantly from 2021 peaks.
Emerging Market Trends
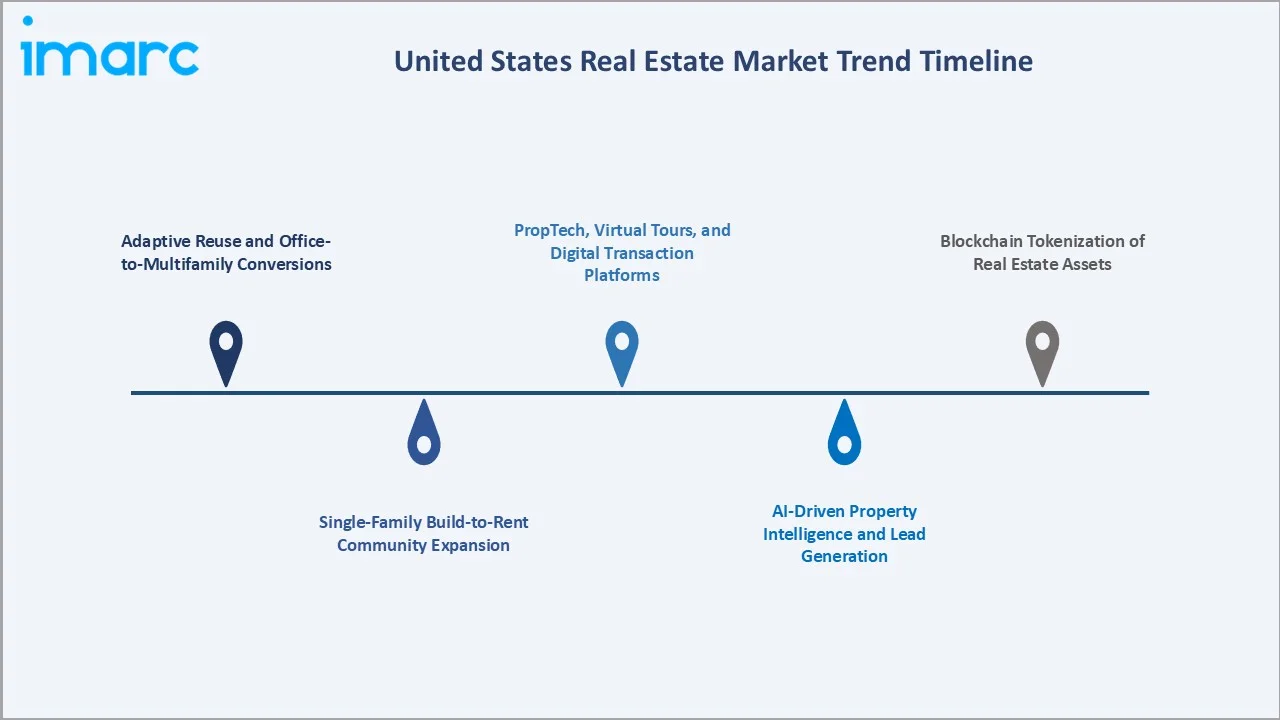
1. Adaptive Reuse and Office-to-Multifamily Conversions
Office-to-residential conversions are accelerating amid high vacancies, with CBRE noting strong growth in adaptive reuse projects, particularly multifamily, reflecting structural shifts in urban real estate demand.
2. Single-Family Build-to-Rent Community Expansion
BTR communities now represent one of the fastest-growing housing categories, with institutional players like Invesco, Hunt Companies, and AVANTA actively capitalizing communities across Texas, Arizona, Georgia, and the Carolinas to serve priced-out renters seeking suburban lifestyles.
3. AI-Driven Property Intelligence and Lead Generation
AI adoption in real estate is rising, with platforms like Realeflow enhancing lead generation, predictive analytics, and operational efficiency across brokerage and investment decision-making processes.
4. PropTech, Virtual Tours, and Digital Transaction Platforms
Virtual walkthroughs, e-signing, and digital closings are now standard across major brokerages. Zillow, Redfin, and Compass are integrating end-to-end home-shopping stacks, reducing transaction friction and widening reach to remote and first-time buyers.
5. Blockchain Tokenization of Real Estate Assets
Real estate tokenization is emerging, enabling fractional ownership through blockchain-based platforms, expanding investor access and liquidity, though adoption remains early-stage and subject to evolving regulatory frameworks.
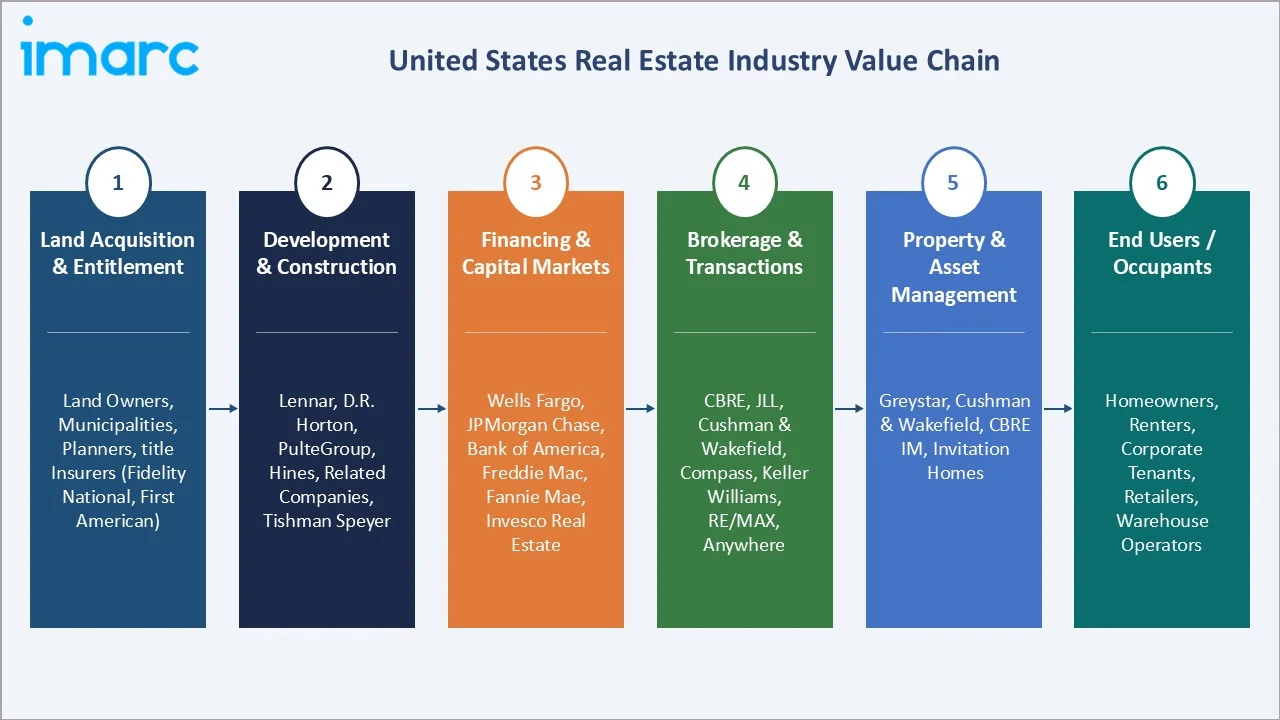
Industry Value Chain Analysis
The United States real estate value chain spans six connected stages, from land acquisition through end-user occupancy. Each stage involves distinct margin structures, capital intensity, and regulatory touchpoints that shape competitive dynamics across property types.
|
Stage |
Key Players / Examples |
|
Land Acquisition & Entitlement |
Land owners, municipalities, planners, title insurers (Fidelity National, First American) |
|
Development & Construction |
Lennar, D.R. Horton, PulteGroup, Hines, Related Companies, Tishman Speyer |
|
Financing & Capital Markets |
Wells Fargo, JPMorgan Chase, Bank of America, Freddie Mac, Fannie Mae, Invesco Real Estate |
|
Brokerage & Transactions |
CBRE, JLL, Cushman & Wakefield, Compass, Keller Williams, RE/MAX, Realogy / Anywhere |
|
Property & Asset Management |
Greystar, Cushman & Wakefield, CBRE IM, Invitation Homes, American Homes 4 Rent |
|
End Users / Occupants |
Homeowners, renters, corporate tenants, retailers, warehouse operators |
Vertically integrated platforms like CBRE and JLL capture the broadest share of value by spanning brokerage, asset management, and capital advisory. Homebuilders such as D.R. Horton and Lennar each delivered over 80,000 homes in FY2024, anchoring supply at the development stage.
Technology Landscape in United States Real Estate
AI-Powered Property Analytics and Valuation
AI-driven automated valuation models and predictive analytics are increasingly used for pricing, risk assessment, and investment screening. Firms like CoreLogic provide nationwide property insights, though claims of near-total coverage and user scale vary by product and dataset.
Virtual Tours, Digital Staging, and Smart Home Connectivity
Virtual tours, AI-based staging, and smart home integrations are widely adopted across U.S. listings. Platforms such as Zillow highlight increased use of 3D tours and digital tools to enhance buyer engagement and remote property discovery.
Blockchain, Tokenization, and Digital Title
Blockchain applications in real estate covering title management, escrow, and fractional ownership are emerging but remain nascent. Industry analyses from Deloitte indicate growing experimentation, though regulatory uncertainty continues to limit large-scale adoption in the United States.
PropTech Lead Generation and Brokerage Automation
PropTech platforms are leveraging AI for predictive lead generation and workflow automation. Solutions from firms like Realeflow support identifying potential sellers and improving marketing efficiency, though specific performance gains vary across brokerage models and market conditions.
Market Segmentation Analysis
The report covers the following segments:
|
Segment Category |
Leading Segment |
Market Share |
Year |
|
Property |
🔒 |
🔒 |
2025 |
|
Business |
Sales |
62.8% |
2025 |
|
Mode |
Offline |
71.5% |
2025 |
|
Region |
South |
38.9% |
2025 |

By Business
Sales transactions hold a 62.8% share in 2025, driven by residential turnover and investment activity. Existing home sales in the United States rose by 1.7% from the previous month to an annualized rate of 4.09 million in February of 2026 and ~668,000 new homes sold, reflecting constrained supply and affordability pressures.
To access detailed market analysis, Request Sample
The Rental segment accounts for 37.2% in 2025, supported by elevated mortgage costs that are keeping more households in lease arrangements. Professionally managed multifamily and single-family build-to-rent communities expanded fastest, with BTR starts reaching record highs across Sun Belt markets during 2024.
By Mode
Offline transactions dominate with a 71.5% share in 2025, reflecting continued reliance on agent-led processes, physical inspections, and legal documentation. Despite rising digital tools, most U.S. home purchases still involve in-person interactions and agent assistance.
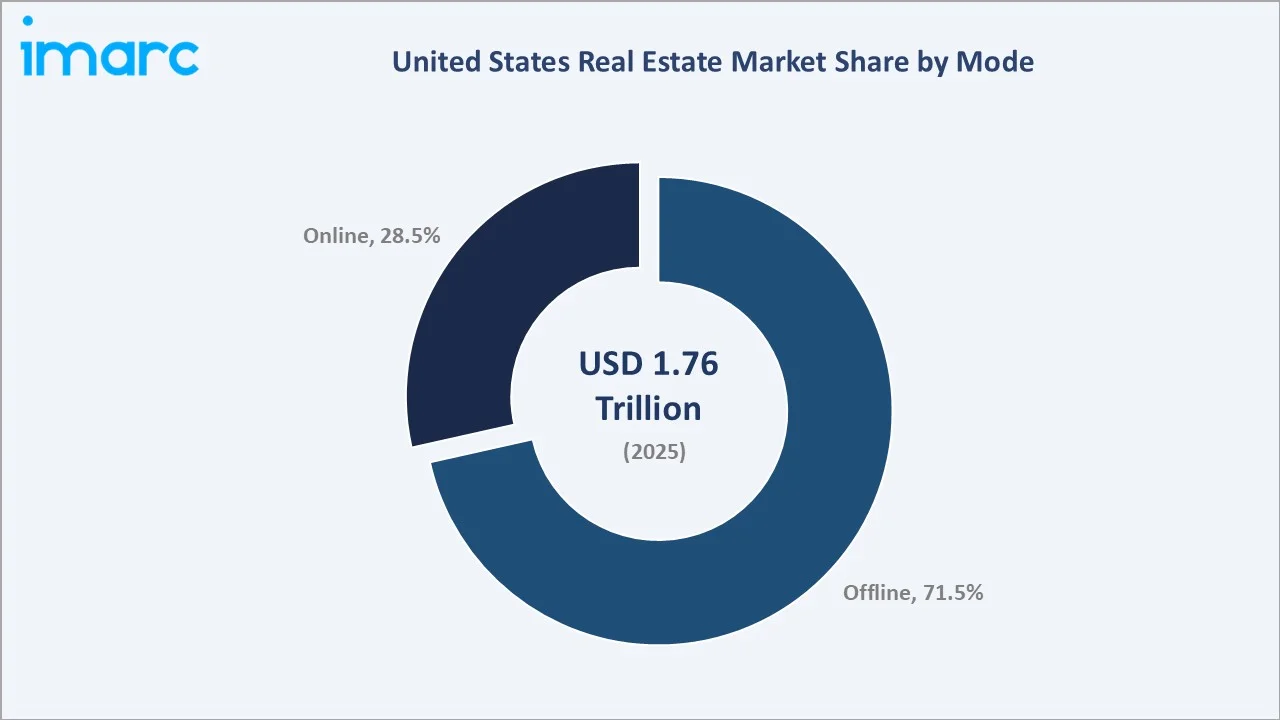
The Online segment holds 28.5% in 2025 and is the fastest-growing mode, driven by platforms like Zillow, Redfin, and Realtor.com. Increasing adoption of virtual tours, digital mortgages, and e-closings is expanding online transactions, particularly among younger and remote buyers.
Regional Market Insights
|
Region |
Share (2025) |
Key Growth Drivers |
|
South |
38.9% |
Texas, Florida, Georgia in-migration; pro-business tax regimes; Sun Belt BTR expansion; corporate HQ relocations |
|
West |
24.6% |
California tech wealth; Seattle and Bay Area employment; luxury coastal residential; industrial logistics near ports |
|
Northeast |
20.3% |
New York, Boston, Philadelphia density; financial services HQs; adaptive reuse of aging office stock |
|
Midwest |
16.2% |
Chicago, Columbus, Minneapolis affordability; logistics and manufacturing demand; stable industrial yields |
The South leads with a 38.9% share in 2025, supported by strong population inflows and housing demand. Data from the U.S. Census Bureau and National Association of Realtors show the region consistently accounts for the largest share of U.S. home sales, driven by migration to states like Texas and Florida.
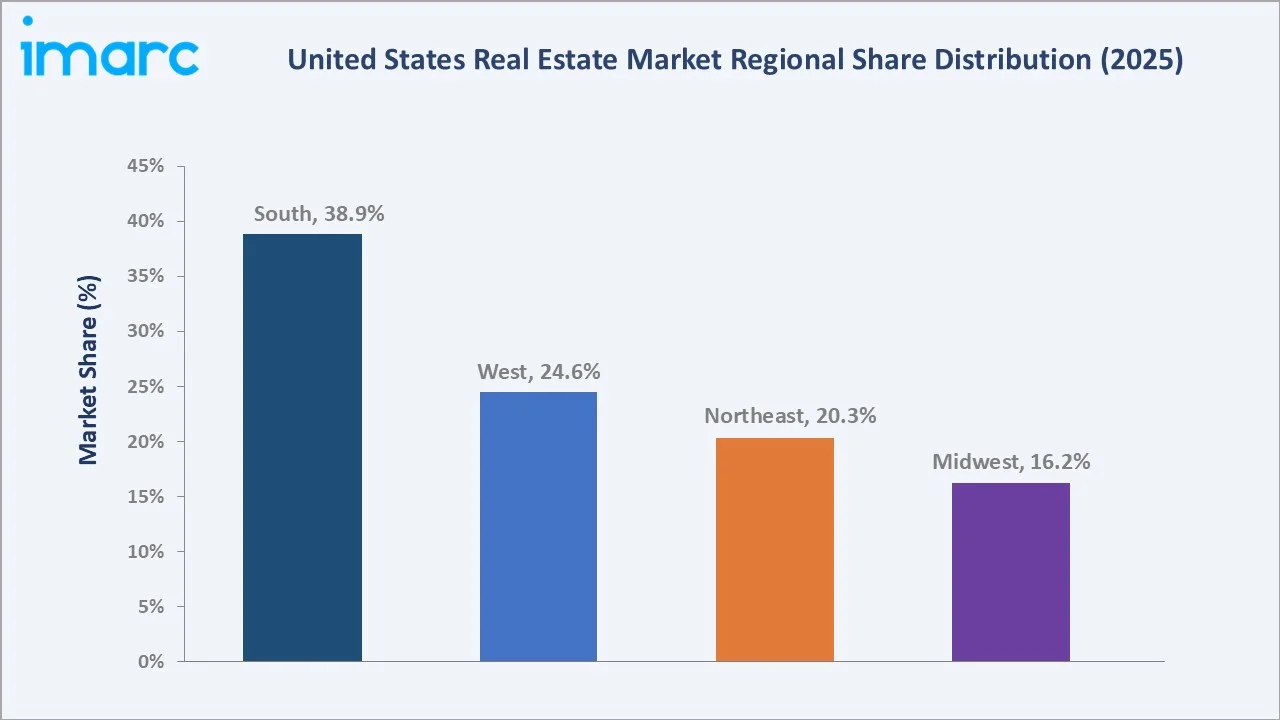
The West holds 24.6% in 2025, anchored by California's USD 3.9 Trillion economy and industrial logistics demand around Los Angeles and Long Beach ports. The Northeast at 20.3% leans on New York, Boston, and Philadelphia corporate density plus adaptive reuse momentum. The Midwest at 16.2% offers affordability-driven multifamily and industrial opportunities across Chicago, Columbus, and Minneapolis.
Competitive Landscape
|
Company Name |
Key Brand |
Market Position |
Core Strength |
|
CBRE |
CBRE / Trammell Crow Company |
Leader |
Global brokerage scale, capital markets, IM |
|
Compass |
Compass |
Leader |
Tech-enabled residential brokerage, agent platform |
|
Anywhere |
Better Homes and Gardens Real Estate, CENTURY 21, Coldwell Banker, Coldwell Banker Commercial, Corcoran, ERA, and Sotheby’s International Realty |
Leader |
Franchise breadth across luxury and mass-market |
|
Keller Williams Realty, LLC |
KW® / KW COMMERCIAL |
Leader |
Largest United States agent network, training-led model |
|
RE/MAX, LLC. |
RE/MAX |
Challenger |
Franchise brokerage, high per-agent productivity |
The United States real estate market remains competitive and fragmented, with the top five brokerages accounting for a meaningful but modest share of total transaction volume. CBRE reported approximately USD 40.6 billion in revenue in FY2025, reinforcing its global leadership across brokerage, capital markets, and investment management services.
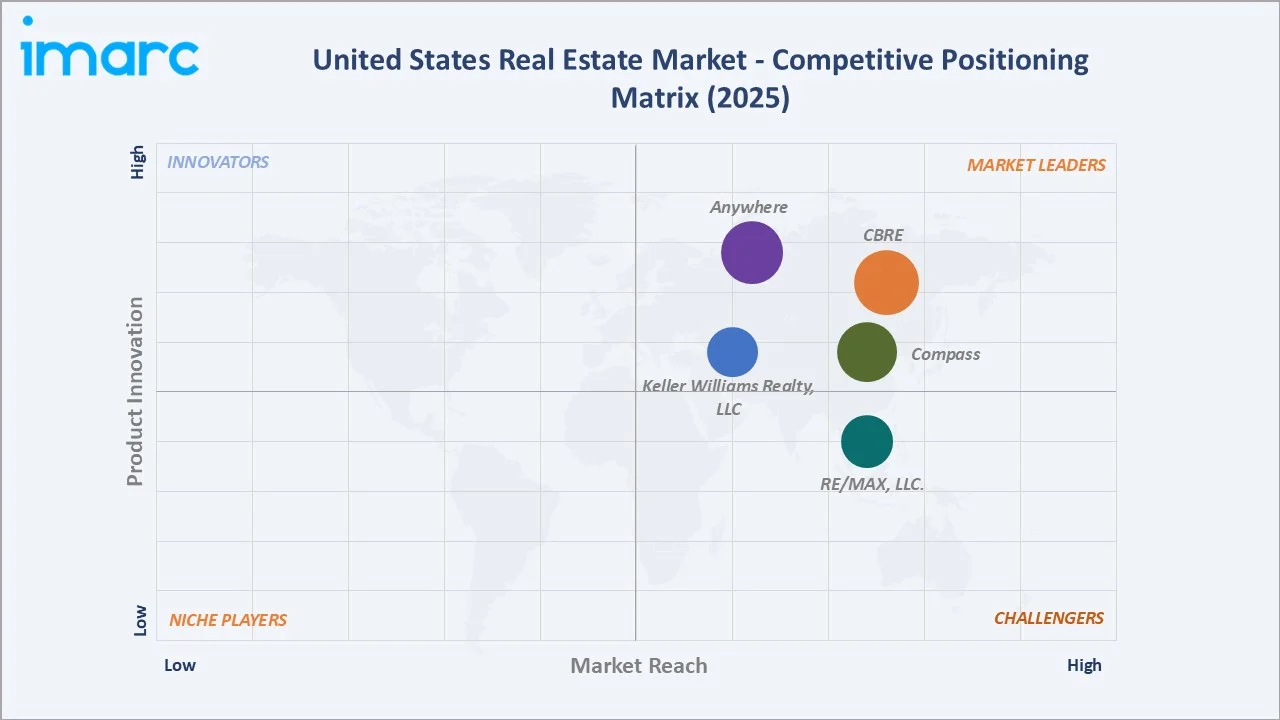
Key Company Profiles
CBRE
CBRE, headquartered in Dallas, is the world’s largest commercial real estate services firm, offering advisory, facilities management, and investment services. It operates globally with 155,000 professionals in over 100 countries, generating strong revenue driven by leasing, outsourcing, and capital markets activity.
- Service Portfolio: Property sales and leasing, capital markets, valuation, facilities management, CBRE IM, and project delivery via Trammell Crow Company.
- Recent Developments: In May 2024, CBRE identified 68 mixed-use districts across 19 U.S. markets, highlighting significant volumes of underutilized office space with strong potential for conversion into residential and other uses amid evolving office demand trends.
- Strategic Focus: Scaling global workplace solutions, capital markets advisory, data center brokerage, and expanding CBRE IM's alternatives platform.
Compass
Compass, headquartered in New York City, is a leading U.S. residential real estate brokerage leveraging a technology-driven platform. The company supports tens of thousands of agents and generates multi-billion-dollar revenue through integrated brokerage, marketing, and transaction services.
- Service Portfolio: Compass offers residential brokerage services, luxury property sales, integrated title and escrow services, mortgage partnerships, and a proprietary agent technology platform designed to streamline marketing, client management, and transaction execution.
- Recent Developments: In December 2024: Compass, agreed to combine with Christie's International Real Estate and @properties in a deal valued at about USD 444 million. The transaction links a major U.S. brokerage with a global luxury network of 100+ affiliates across nearly 50 countries, expanding international reach.
- Strategic Focus: Expanding high-margin title, mortgage, and lead-generation services while deepening luxury reach through the Christie's alliance.
Anywhere
Anywhere, headquartered in Madison, New Jersey, is a leading U.S. residential real estate services company operating a large franchise brokerage network. It supports multiple well-known brands and generates multi-billion-dollar revenue through brokerage, relocation, and transaction-related services.
- Service Portfolio: Anywhere provides residential brokerage through brands like Coldwell Banker, Century 21, Sotheby's International Realty, and ERA Real Estate, along with relocation services via Cartus, title and settlement through Title Resource Group, and mortgage joint ventures.
- Recent Developments: In 2024, Anywhere Real Estate strengthened its digital ecosystem by deploying AI-driven tools across its brands to improve agent productivity and streamline transactions, while Sotheby’s International Realty expanded globally, supporting growth in the luxury residential real estate segment.
- Strategic Focus: Luxury growth, agent productivity tools, and embedding title, mortgage, and closing services into the transaction journey.
Market Concentration Analysis
The United States real estate market is highly fragmented at the transaction level yet moderately concentrated within commercial services. CBRE, Compass, Anywhere, and Keller Williams Realty, LLC together capture an estimated 35-40% of United States commercial real estate services revenue in 2025, driven by scale, capital markets reach, and institutional client penetration.
Residential brokerage remains highly fragmented, with over 1.5 million licensed agents operating across franchise and independent models. Even the largest firms—including Keller Williams Realty, RE/MAX, Compass, eXp Realty.
Consolidation is accelerating via strategic partnerships, exemplified by the Compass-Christie's-@properties alliance announced in December 2024. Technology investment requirements and scale-driven margins continue to pressure smaller operators, while institutional capital entry into single-family rentals is concentrating ownership at the asset level.
Investment & Growth Opportunities
Fastest-Growing Segments
Build-to-rent (BTR), senior housing, and data centers are among the fastest-growing U.S. real estate segments, supported by housing shortages and digital infrastructure demand. Senior housing occupancy reached 86.5% in Q3 2024, reflecting strong recovery and aging demographics. Meanwhile, data center demand has surged to record levels, driven by AI and cloud expansion, with significant hyperscaler leasing in Northern Virginia, Phoenix, Dallas, and Atlanta.
Emerging Sub-Markets
Secondary and high-growth metros such as Nashville, Austin, Raleigh-Durham, Charlotte, Boise, and Tampa are increasingly attracting real estate investment due to strong population inflows, business relocations, and relatively lower land and operating costs. These markets often provide higher yields compared to traditional gateway cities and support expansion across multifamily, industrial, and retail segments, making them key targets for developers and institutional investors.
Venture & Capital Investment Trends
Capital flows into U.S. real estate remain resilient, particularly in PropTech, real estate credit, and alternative asset classes. Investments are increasingly focused on AI-enabled valuation, digital transaction platforms, and operational efficiencies. Institutional investors continue allocating capital toward real estate debt and infrastructure-like assets such as data centers, reflecting long-term confidence despite market volatility and higher interest rates.
Future Market Outlook (2026-2034)
The United States real estate market is projected to expand from USD 1.76 Trillion in 2025 to USD 2.30 Trillion by 2034 at a 2.98% CAGR, representing incremental value creation of roughly USD 540 billion. Growth will be anchored by demographic-led housing demand, Sun Belt migration, commercial repositioning, and AI-enabled operational efficiency across property management and transactions.
Three transformational shifts will reshape the market through 2034. First, AI-native brokerage and lending platforms will compress transaction times and costs. Second, tokenization will broaden retail investor access to commercial and residential assets. Third, climate-adjusted underwriting will redirect capital flows away from high-risk coastal and wildfire-exposed submarkets toward resilient inland locations.
By 2034, the United States real estate industry is expected to complete its transition from a predominantly offline, relationship-driven market into a hybrid digital-physical ecosystem. Operators investing in AI, data infrastructure, sustainability, and integrated financial services are positioned to capture outsized share of the projected value expansion across residential, commercial, and specialized property categories.
Research Methodology
Primary Research
Primary research included structured interviews and surveys conducted during 2024-2025 with United States real estate stakeholders, including senior brokerage executives, REIT portfolio managers, PropTech founders, multifamily operators, mortgage underwriters, and institutional investment officers active across residential, commercial, and industrial asset classes.
Secondary Research
Secondary sources included company filings (CBRE, Compass, Anywhere, Zillow, Redfin), National Association of Realtors (NAR) housing data, United States Census Bureau permits and vacancy series, Federal Reserve mortgage rate releases, NIC senior housing benchmarks, CoreLogic valuation intelligence, and industry publications such as CRE Daily and GlobeSt.
Forecasting Models
Market sizing combined top-down and bottom-up forecasting. Inputs included GDP growth, 30-year mortgage rate paths, household formation, construction permits, existing home sales velocity, and commercial cap rate scenarios under base, optimistic, and conservative macroeconomic assumptions across the 2026-2034 horizon.
United States Real Estate Market Report Scope
| Report Features | Details |
|---|---|
| Base Year of the Analysis | 2025 |
| Historical Period | 2020-2025 |
| Forecast Period | 2026-2034 |
| Units | Trillion USD |
| Scope of the Report |
Exploration of Historical Trends and Market Outlook, Industry Catalysts and Challenges, Segment-Wise Historical and Future Market Assessment:
|
| Properties Covered | Residential, Commercial, Industrial, Land |
| Businesses Covered | Sales, Rental |
| Modes Covered | Online, Offline |
| Regions Covered | Northeast, Midwest, South, West |
| Companies Covered | CBRE, Compass, Anywhere, Keller Williams Realty, LLC, RE/MAX, LLC., etc. |
| Customization Scope | 10% Free Customization |
| Post-Sale Analyst Support | 10-12 Weeks |
| Delivery Format | PDF and Excel through Email (We can also provide the editable version of the report in PPT/Word format on special request) |
Key Benefits for Stakeholders:
- IMARC’s report offers a comprehensive quantitative analysis of various market segments, historical and current market trends, market forecasts, and dynamics of the United States real estate market from 2020-2034.
- The research study provides the latest information on the market drivers, challenges, and opportunities in the United States real estate market.
- Porter's Five Forces analysis assists stakeholders in assessing the impact of new entrants, competitive rivalry, supplier power, buyer power, and the threat of substitution. It helps stakeholders to analyze the level of competition within the United States real estate industry and its attractiveness.
- Competitive landscape allows stakeholders to understand their competitive environment and provides an insight into the current positions of key players in the market.
Frequently Asked Questions About the United States Real Estate Market Report
The United States real estate market was valued at USD 1.76 Trillion in 2025, driven by housing turnover, institutional investment, and rising build-to-rent demand.
The market is projected to reach USD 2.30 Trillion by 2034 at a CAGR of 2.98% during 2026-2034, supported by demographics, migration, and PropTech adoption.
Sales lead with a 62.8% share in 2025, reflecting strong residential turnover and commercial repricing despite elevated mortgage rate conditions.
Offline holds 71.5% share in 2025 because most high-value residential and commercial deals still require physical tours, inspections, and notarized closings.
The South leads with 38.9% in 2025, anchored by Texas, Florida, and Georgia population growth, corporate relocations, and favorable tax and regulatory regimes.
Key drivers include millennial household formation, Sun Belt migration, office adaptive reuse, build-to-rent expansion, AI PropTech, and senior housing demand.
The South remains fastest-growing, led by Texas and Florida in-migration, single-family build-to-rent expansion, and strong Sun Belt employment growth.
Leading companies include CBRE, Compass, Anywhere, Keller Williams Realty, LLC, and RE/MAX LLC.
Online channels held 28.5% share in 2025, led by Zillow, Redfin, Realtor.com, and Opendoor, with AI tours and digital mortgage expanding penetration rapidly.
AI is improving property valuation, lead generation, virtual tours, and predictive maintenance. CoreLogic Araya and Realeflow Leadflow illustrate emerging efficiency benchmarks.
Key challenges include affordability constraints, elevated mortgage rates, commercial office distress, climate-driven insurance pressure, and a persistent housing supply shortfall.
Rental growth is driven by affordability gaps, delayed homeownership, institutional build-to-rent investment, and high mortgage rates keeping households in lease arrangements longer.
Need more help?
- Speak to our experienced analysts for insights on the current market scenarios.
- Include additional segments and countries to customize the report as per your requirement.
- Gain an unparalleled competitive advantage in your domain by understanding how to utilize the report and positively impacting your operations and revenue.
- For further assistance, please connect with our analysts.
 Request Customization
 Speak to an Analyst
 Request Brochure
 Inquire Before Buying
Benefits of Customization
- Personalize this research
- Triangulate with your data
- Get data as per your format and definition
- Gain a deeper dive into a specific application, geography, customer, or competitor
- Any level of personalization
Get in Touch With Us
UNITED STATES
Phone: +1-201-971-6302
INDIA
Phone: +91-120-433-0800
UNITED KINGDOM
Phone: +44-753-714-6104
Email: [email protected]
Client Testimonials




.webp)




.webp)













Related Reports

Choose your plan
*Please note that the prices mentioned below are starting prices for each bundle type. Kindly contact our team for further details.*
Single User License
- 1 User License, Access on 2 Devices
- PDF Report + Excel Dataset (Password Protected)
- Lifetime Access
- No Printing Rights
- 10% Free Report Customization
- 10–12 Weeks of Analyst Support
Five User License
- Access for 5 Users, 2 Devices per User
- PDF Report + Excel Dataset (Password Protected)
- Lifetime Access
- Dedicated Account Manager
- 12–14 Weeks of Analyst Support
- No Printing Rights
- 15% Free Report Customization
- 25% Discount on Your Next Purchase
Corporate User License
- Unlimited User Access (Within Your Organization)
- PDF Report + Excel Dataset
- Lifetime Access
- Dedicated Account Manager
- 14–20 Weeks of Analyst Support
- No Printing Rights
- 20% Free Report Customization
- 30% Discount on Your Next Purchase
Essential Insights
What's included:
3 reports
- Lifetime Access
- PDF Reports
- Excel Datasets
- 2 Weeks of Free Analyst Support
- 2 User Licenses
- Access on 2 Devices
- Printing Rights
- Complimentary PowerPoint (PPT) Version
- Complimentary License Upgrade
Professional Access
What's included:
5 reports
- Lifetime Access
- PDF Reports
- Excel Datasets
- 8 Weeks of Free Analyst Support
- 2 User Licenses
- Access on 2 Devices
- Printing Rights
- Complimentary PowerPoint (PPT) Version
- Complimentary License Upgrade
Business Advantage
What's included:
8 reports
- Lifetime Access
- PDF Reports
- Excel Datasets
- 14 Weeks of Free Analyst Support
- 2 User Licenses
- Access on 2 Devices
- Printing Rights
- Complimentary PowerPoint (PPT) Version
- Complimentary License Upgrade
Enterprise Intelligence
What's included:
10 reports
- Lifetime Access
- PDF Reports
- Excel Datasets
- 20 Weeks of Free Analyst Support
- 2 User Licenses
- Access on 2 Devices
- Printing Rights
- Complimentary PowerPoint (PPT) Version
- Complimentary License Upgrade