
Urea Prices, Trend, Chart, Demand, Market Analysis, News, Historical and Forecast Data Report 2026 Edition
Urea Price Trend, Index and Forecast
Track real-time and historical urea prices across global regions. Updated monthly with market insights, drivers, and forecasts.
Urea Prices July 2026
| Region | Price (USD/KG) | Latest Movement |
|---|---|---|
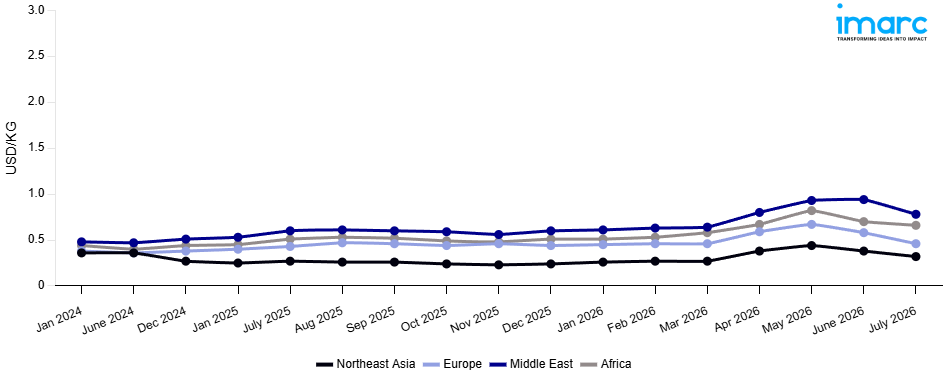
| Northeast Asia | 0.32 | -15.8% ↓ Down |
| Africa | 0.66 | -5.7% ↓ Down |
| Europe | 0.46 | -20.7% ↓ Down |
| Middle East | 0.78 | -17.0% ↓ Down |
Urea Price Index (USD/KG):
The chart below highlights monthly urea prices across different regions.
Get Access to Monthly/Quarterly/Yearly Prices, Request Sample
Market Overview Q1 Ending March 2026
Northeast Asia: The urea prices in Northeast Asia reached 0.27 USD/KG in March 2026. The upward pricing movement registered between December and March 2026 was 12.5%. Increased agricultural requirements in the run up to the spring planting season encouraged active urea procurement from the agricultural and agribusiness communities in key importing countries in the region. Higher natural gas and ammonia feedstock costs in key producing countries supported upward pressure on urea production costs, which in turn sustained upward pressure on regional market prices. Export restrictions from China, due to retention in the home market, supported upward pressure on regional prices as the quarter progressed.
Africa: The urea prices in Africa reached 0.58 USD/KG in March 2026. The upward pricing movement registered between December and March 2026 was 13.7%. Growing agricultural activity across the continent actively drove increased urea procurement from farming and agribusiness sectors during the review period. Higher upstream natural gas and ammonia feedstock costs elevated urea production expenses and contributed to upward movement in prevailing regional prices. Limited import cargo availability from key supplying regions including the Middle East and Eastern Europe tightened supply conditions across the African market. Local currency depreciation in several key importing nations further amplified effective import costs and reinforced the prevailing bullish pricing trajectory.
Europe: The urea prices in Europe reached 0.46 USD/KG in March 2026. The upward pricing movement registered between December and March 2026 was 4.5%. Robust agricultural demand in advance of the upcoming spring planting season continued to underpin active urea buying activity from agricultural regions throughout Europe. Higher natural gas prices throughout Europe contributed to upward pressure on European urea production costs, supporting upward movements in prevailing European market prices. Lower availability of import cargo from key Black Sea and Middle Eastern regions also contributed to tight European supply conditions, supporting prices during this period. Seasonal distributor stock management activity also contributed to maintaining upward momentum in urea prices during this period.
Middle East: The urea prices in the Middle East reached 0.64 USD/KG in March 2026. The upward pricing movement registered between December and March 2026 was 6.7%. Firm export demand from Asian and African importing nations drove active procurement of Middle Eastern urea cargoes and provided consistent support to prevailing price levels. Rising feedstock and operational costs at regional production facilities placed incremental upward pressure on urea production expenses and prevailing market rates throughout the quarter. Tight global urea supply conditions, driven by constrained export volumes from competing regions, reinforced Middle Eastern cargo demand and sustained the bullish pricing trend.
Market Overview Q4 Ending December 2025
Northeast Asia: The urea prices in Northeast Asia reached 0.24 USD/KG in December 2025. The downward pricing movement registered between September and December 2025 was 6.0%. The price decline was primarily driven by weaker seasonal demand from the agricultural sector as the planting season concluded through key consuming markets, significantly moderating fertilizer procurement volumes. Declining upstream natural gas and ammonia feedstock costs further eroded production cost support for regional manufacturers. Elevated inventory levels among major producers intensified competitive discounting strategies to accelerate stock clearance, while surplus production output from expanded domestic capacity amplified supply-side pressure.
Africa: The urea prices in Africa reached 0.51 USD/KG in December 2025. The downward pricing movement registered between September and December 2025 was 2.7%. Due to agricultural consumers delaying purchases in anticipation of more price softening before the following planting cycle, fertilizer procurement activity was muted during the off-season, which is why the price decline was moderate. Comfortable market volumes were maintained by competitively priced import cargoes and sufficient supply availability from domestic producing facilities. Regional pricing support was further weakened by softening international urea benchmark valuations, and the urgency of restocking was lessened by increased inventory positions among major distributors.
Europe: The urea prices in Europe reached 0.44 USD/KG in December 2025. The downward pricing movement registered between September and December 2025 was 5.1%. The notable price correction was primarily due to weaker fertilizer demand during the off-season, as farmers delayed procurement decisions in anticipation of more favorable pricing conditions ahead of the spring application season. Declining natural gas prices, a critical input in ammonia and urea production, substantially lowered manufacturing cost floors across the region. Increased import availability from competitively priced cargoes exerted additional downward pressure on domestic market rates, while surplus inventory positions among major distributors prompted competitive pricing concessions to stimulate order volumes, thereby maintaining persistently bearish market conditions throughout the quarter.
Middle East: The urea prices in the Middle East reached 0.60 USD/KG in December 2025. The downward pricing movement registered between September and December 2025 was 0.4%. A generally stable market situation was reflected in the marginal price reduction, as baseline procurement activity was maintained throughout the quarter by moderate export demand from conventional importing destinations. Access to inexpensive natural gas feedstock gave regional firms a competitive edge, keeping their production margins stable and preventing large price reductions. Consistent offtake fundamentals were maintained by continuous consumption from domestic agricultural and industrial applications, while sufficient production from established facilities ensured comfortable supply availability.
Market Overview Q3 Ending September 2025
Northeast Asia: Urea prices experienced downward pressure. Weak agricultural demand in China and South Korea, combined with subdued industrial consumption in Japan, contributed to the softening trend. On the supply side, Chinese production remained steady, but export availability increased due to lower domestic off-take, putting additional pressure on regional markets. Currency fluctuations against the US dollar, raised import costs but failed to offset the general downward momentum. International freight rates from ports to Southeast Asia also eased, reducing landed costs and intensifying price competition. Moreover, stricter customs checks in South Korea slowed clearance times, affecting supply chain efficiency.
Africa: The region’s demand was primarily shaped by seasonal agricultural cycles, with reduced fertilizer application following peak planting in North and West Africa. Nigeria’s domestic urea production, bolstered by capacity at Dangote’s fertilizer plant, maintained strong supply within the region, limiting the need for imports from the Middle East. However, East African markets such as Kenya continued to rely heavily on imports, with high port handling and logistics costs at Mombasa contributing to elevated landed prices. Currency depreciation in several African economies, including the Nigerian naira and Kenyan shilling, further escalated import costs, partially offsetting the global downward trend. Despite these pressures, robust government subsidy programs in countries like Egypt and Morocco supported farmer accessibility to fertilizers, which stabilized regional consumption. The net effect was a modest softening in overall price trends without significant volatility compared to other regions.
Europe: The demand downturn was linked to subdued agricultural off-take following peak summer usage and weaker industrial demand, particularly in the melamine and resins sector. Supply-side dynamics were influenced by stable production levels in Russia and the resumption of export flows through Black Sea ports, increasing regional availability. However, high natural gas prices, critical for urea production remained a key cost driver, particularly in Western and Central Europe, keeping production costs elevated despite declining end-user demand. Import volumes from North Africa and the Middle East also rose, aided by relatively lower shipping costs, further intensifying competitive pressures. Additionally, compliance with EU’s environmental regulations increased handling and certification expenses for importers. The combined impact of steady supply, rising imports, and muted demand pulled European urea prices downward through Q3 2025.
Middle East: Strong supply from leading producers in Qatar, Saudi Arabia, and the UAE ensured abundant regional availability. Export competitiveness remained intact due to proximity advantages in shipping to both Africa and South Asia, although freight costs to distant destinations like Europe saw marginal easing. Demand-side conditions were muted, as domestic agricultural consumption was seasonally low, leaving most output for exports. Currency stability in the Gulf Cooperation Council (GCC) countries, pegged against the US dollar, ensured minimal import cost fluctuations. However, tightening environmental compliance and stricter customs inspections at certain ports increased handling times, impacting the speed of shipments. Rising domestic logistics expenses also contributed to cost escalations, although these were overshadowed by stable supply and limited demand growth. As a result, Middle Eastern urea prices softened but remained higher than most regions due to sustained export demand.
Urea Price Trend, Market Analysis, and News
IMARC's latest publication, “Urea Prices, Trend, Chart, Demand, Market Analysis, News, Historical and Forecast Data Report 2026 Edition,” presents a detailed examination of the urea market, providing insights into both global and regional trends that are shaping prices. This report delves into the spot price of urea at major ports and analyzes the composition of prices, including FOB and CIF terms. It also presents detailed urea prices trend analysis by region, covering North America, Europe, Asia Pacific, Latin America, and Middle East and Africa. The factors affecting urea pricing, such as the dynamics of supply and demand, geopolitical influences, and sector-specific developments, are thoroughly explored. This comprehensive report helps stakeholders stay informed with the latest market news, regulatory updates, and technological progress, facilitating informed strategic decision-making and forecasting.
.webp)
Urea Industry Analysis
The global urea industry size reached USD 53.49 Billion in 2025. By 2034, IMARC Group expects the market to reach USD 61.08 Billion, at a projected CAGR of 1.49% during 2026-2034. Growth in the global urea market is driven by its critical role in agriculture as a high nitrogen fertilizer, expanding industrial applications in resins, adhesives, and plastics, and growing demand for diesel exhaust fluid (DEF) in automotive emissions control systems.
Latest developments in the Urea industry:
- June 2025: BASF and Yuntianhua completed verification and registration of greenhouse gas emissions reductions resulting from the use of stabilized urea fertilizer containing BASF’s Limus® urease inhibitor. The pilot project in China confirmed reductions of approximately 46,584 metric tons of CO₂ equivalent, independently verified under ISO 14064 standards, with plans for broader rollout.
- June 2022: PT Pupuk Kalimantan Timur (Pupuk Kaltim) declared they were considering a project to establish a factory in West Papua’s Bintuni Bay, Indonesia, that can convert natural gas into urea, ammonia, and methanol.
- May 2022: IFFCO (Indian Farmers' Fertiliser Cooperative Limited) announced business expansion by installing the first IFFCO nano urea (liquid) production unit in Kalol, Gujarat, India, with an investment of INR 175 crore (approximately USD 21.52 million).
Product Description
Urea (chemical formula CO(NH₂)₂) is a crystalline organic compound produced industrially by reacting ammonia with carbon dioxide. It is highly valued for its high nitrogen content, making it the most widely used nitrogen fertilizer globally. Urea is colorless, odorless, and highly soluble in water, characteristics that enhance its efficiency as a soil nutrient. Industrially, it is employed in the manufacture of urea-formaldehyde resins, adhesives, plastics, and coatings. Additionally, urea plays a crucial role in environmental applications, particularly in diesel exhaust fluid (DEF) systems that reduce nitrogen oxide emissions. Its versatility, cost-effectiveness, and essential role in global food security and industrial processes underpin its widespread adoption across multiple sectors.
Report Coverage
| Key Attributes | Details |
|---|---|
| Product Name | Urea |
| Report Features | Exploration of Historical Trends and Market Outlook, Industry Demand, Industry Supply, Gap Analysis, Challenges, Urea Price Analysis, and Segment-Wise Assessment. |
| Currency/Units | US$ (Data can also be provided in local currency) or Metric Tons |
| Region/Countries Covered | The current coverage includes analysis at the global and regional levels only. Based on your requirements, we can also customize the report and provide specific information for the following countries: Asia Pacific: China, India, Indonesia, Pakistan, Bangladesh, Japan, Philippines, Vietnam, Thailand, South Korea, Malaysia, Nepal, Taiwan, Sri Lanka, Hongkong, Singapore, Australia, and New Zealand Europe: Germany, France, United Kingdom, Italy, Spain, Russia, Turkey, Netherlands, Poland, Sweden, Belgium, Austria, Ireland, Switzerland, Norway, Denmark, Romania, Finland, Czech Republic, Portugal and Greece North America: United States and Canada Latin America: Brazil, Mexico, Argentina, Columbia, Chile, Ecuador, and Peru Middle East & Africa: Saudi Arabia, UAE, Israel, Iran, South Africa, Nigeria, Oman, Kuwait, Qatar, Iraq, Egypt, Algeria, and Morocco The list of countries presented is not exhaustive. Information on additional countries can be provided if required by the client. |
| Information Covered for Key Suppliers |
|
| Customization Scope | The report can be customized as per the requirements of the customer |
| Report Price and Purchase Option |
Plan A: Monthly Updates - Annual Subscription
Plan B: Quarterly Updates - Annual Subscription
Plan C: Biannually Updates - Annual Subscription
|
| Post-Sale Analyst Support | 360-degree analyst support after report delivery |
| Delivery Format | PDF and Excel through email (We can also provide the editable version of the report in PPT/Word format on special request) |
Key Benefits for Stakeholders:
- IMARC’s report presents a detailed analysis of urea pricing, covering global and regional trends, spot prices at key ports, and a breakdown of FOB and CIF prices.
- The study examines factors affecting urea price trend, including input costs, supply-demand shifts, and geopolitical impacts, offering insights for informed decision-making.
- The competitive landscape review equips stakeholders with crucial insights into the latest market news, regulatory changes, and technological advancements, ensuring a well-rounded, strategic overview for forecasting and planning.
- IMARC offers various subscription options, including monthly, quarterly, and biannual updates, allowing clients to stay informed with the latest market trends, ongoing developments, and comprehensive market insights. The urea price charts ensure our clients remain at the forefront of the industry.
Frequently Asked Questions About the Urea Price Index Report
The urea prices in July 2026 were 0.32 USD/Kg in Northeast Asia, 0.66 USD/Kg in Africa, 0.46 USD/Kg in Europe, and 0.78 USD/Kg in the Middle East.
The urea prices data is updated on a monthly basis.
We provide the pricing data primarily in the form of an Excel sheet and a PDF.
Yes, our report includes a forecast for urea prices.
The regions covered include North America, Europe, Asia Pacific, Middle East, and Latin America. Countries can be customized based on the request (additional charges may be applicable).
Yes, we provide both FOB and CIF prices in our report.
Need more help?
- Speak to our experienced analysts for insights on the current market scenarios.
- Include additional segments and countries to customize the report as per your requirement.
- Gain an unparalleled competitive advantage in your domain by understanding how to utilize the report and positively impacting your operations and revenue.
- For further assistance, please connect with our analysts.
 Request Customization
 Inquire Before Buying
 Speak to an Analyst
 Request Brochure
Benefits of Customization
- Personalize this research
- Triangulate with your data
- Get data as per your format and definition
- Gain a deeper dive into a specific application, geography, customer, or competitor
- Any level of personalization
Get in Touch With Us
UNITED STATES
Phone: +1-201-971-6302
INDIA
Phone: +91-120-433-0800
UNITED KINGDOM
Phone: +44-753-714-6104
Email: [email protected]
Client Testimonials


.webp)


Related Reports
Why Choose Us
IMARC offers trustworthy, data-centric insights into commodity pricing and evolving market trends, enabling businesses to make well-informed decisions in areas such as procurement, strategic planning, and investments. With in-depth knowledge spanning more than 1000 commodities and a vast global presence in over 150 countries, we provide tailored, actionable intelligence designed to meet the specific needs of diverse industries and markets.
1000
+Commodities
150
+Countries Covered
3000
+Clients
20
+Industry
Robust Methodologies & Extensive Resources
IMARC delivers precise commodity pricing insights using proven methodologies and a wealth of data to support strategic decision-making.
Subscription-Based Databases
Our extensive databases provide detailed commodity pricing, import-export trade statistics, and shipment-level tracking for comprehensive market analysis.
Primary Research-Driven Insights
Through direct supplier surveys and expert interviews, we gather real-time market data to enhance pricing accuracy and trend forecasting.
Extensive Secondary Research
We analyze industry reports, trade publications, and market studies to offer tailored intelligence and actionable commodity market insights.
Trusted by 3000+ industry leaders worldwide to drive data-backed decisions. From global manufacturers to government agencies, our clients rely on us for accurate pricing, deep market intelligence, and forward-looking insights.