
US Ecotourism Market Size, Share, Trends and Forecast by Traveler Type, Age Group, Sales Channel, and Region, 2025-2033
US Ecotourism Market Overview:
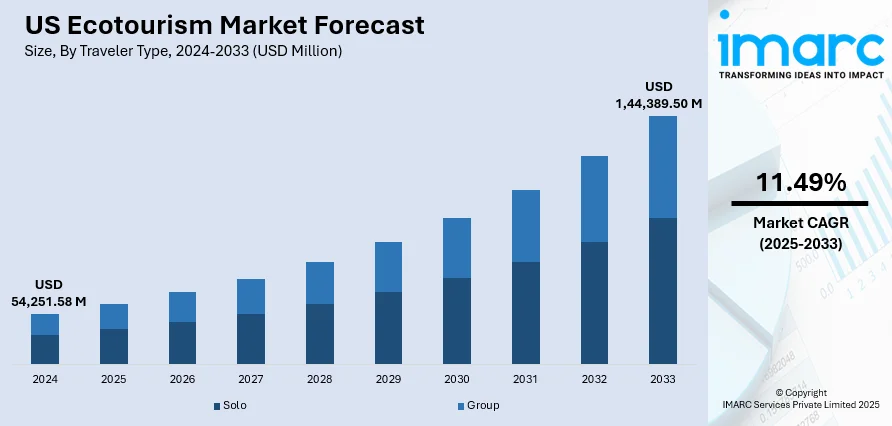
The US ecotourism market size reached USD 54,251.58 Million in 2024. The market is projected to reach USD 1,44,389.50 Million by 2033, exhibiting a growth rate (CAGR) of 11.49% during 2025-2033. The market is propelled by growing consumer awareness of sustainable travel, rising demand for authentic nature-based experiences, and supportive government policies promoting conservation-focused tourism. Moreover, inflating disposable incomes and changing preferences toward responsible travel contribute to the sector’s steady expansion across national parks, wildlife reserves, and rural communities. Apart from this, investments in eco-friendly infrastructure and community-led initiatives further augment the US ecotourism market share.
|
Report Attribute
|
Key Statistics
|
|---|---|
|
Base Year
|
2024
|
|
Forecast Years
|
2025-2033
|
|
Historical Years
|
2019-2024
|
| Market Size in 2024 | USD 54,251.58 Million |
| Market Forecast in 2033 | USD 1,44,389.50 Million |
| Market Growth Rate 2025-2033 | 11.49% |
US Ecotourism Market Trends:
Integration of Technology for Enhanced Ecotourism Experiences
One of the key trends influencing the market is the use of digital tools to enhance the guest experience and support sustainability objectives. Mobile apps now provide instant information on trail conditions, wildlife, and conservation practices, enabling travelers to make choices that inform their travel and reduce their impact. In addition to this, virtual and augmented reality options are also picking up pace, enabling the visitor to experience sensitive ecosystems remotely or enhance on-the-ground visits with immersive, informative overlays. These digital advancements appeal to the younger and digitally inclined visitors. According to industry reports, Millennials and Gen Z account for the largest share of vacation trips in the United States, setting the pace for trends in the leisure travel segment. Over half of the adults in these groups take leisure trips three or more times annually, while roughly 30% make one to two trips per year. Their preference for hassle-free planning and seamless booking drives strong demand for user-friendly mobile applications, which align well with the US ecotourism market’s focus on digital tools for reservations, trail information, and sustainability tips. Moreover, data analytics tools are helping park authorities and private operators monitor visitor flows, optimize resource allocation, and design interventions that protect fragile habitats. Apart from this, contactless payments, online booking systems, and digital visitor passes reduce physical infrastructure needs and streamline operations. This trend demonstrates a clear pivot toward balancing visitor access with ecosystem preservation.
To get more information on this market, Request Sample
Expansion of Green Infrastructure and Low-Impact Transport Options
The expansion of green infrastructure and sustainable transport solutions supported by targeted government initiatives is positively impacting the US ecotourism market growth. For instance, as per industry reports, in 2024, New York is allocating USD 60 Million in grants to support 13 green infrastructure projects across the state. These projects include porous pavement, pocket parks, and tree trenches that help manage stormwater through advanced underground infiltration systems. Such investments not only improve urban resilience but also enhance the appeal of ecotourism sites by creating greener, more accessible spaces for visitors. Moreover, solar-powered facilities, electric vehicle (EV) charging stations within parks, and the electrification of shuttle fleets demonstrate a clear shift toward minimizing tourism’s carbon footprint. In addition, trail connectivity projects and non-motorized transport networks also receive considerable backing, encouraging walking, cycling, and wildlife-friendly transit routes. By easing access through low-impact modes of travel, destinations appeal to visitors seeking responsible experiences. These infrastructure developments are designed not only to limit ecological disturbance but also to deliver long-term cost savings for operators and communities.
US Ecotourism Market Segmentation:
IMARC Group provides an analysis of the key trends in each segment of the market, along with forecasts at the country and regional levels for 2025-2033. Our report has categorized the market based on traveler type, age group, and sales channel.
Traveler Type Insights:
- Solo
- Group
The report has provided a detailed breakup and analysis of the market based on the traveler type. This includes solo and group.
Age Group Insights:
- Generation X
- Generation Y
- Generation Z
A detailed breakup and analysis of the market based on the age group have also been provided in the report. This includes generation X, generation Y, and generation Z.
Sales Channel Insights:
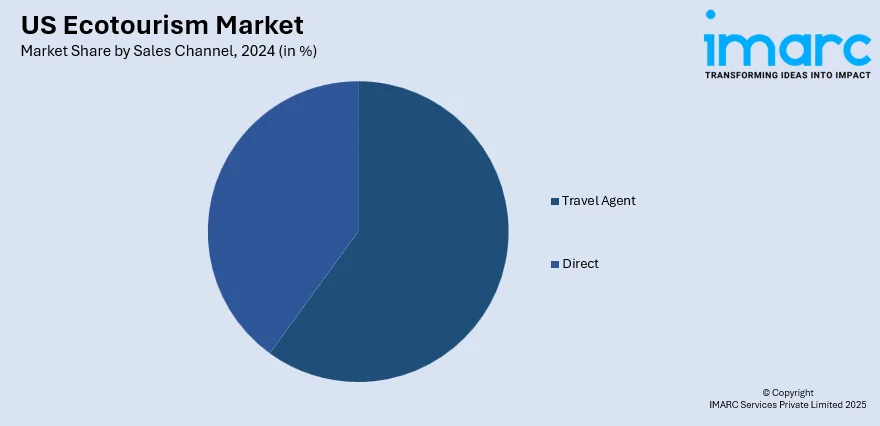
- Travel Agent
- Direct
The report has provided a detailed breakup and analysis of the market based on the sales channel. This includes travel agent and direct.
Regional Insights:
- Northeast
- Midwest
- South
- West
The report has also provided a comprehensive analysis of all the major regional markets, which include Northeast, Midwest, South, and West.
Competitive Landscape:
The market research report has also provided a comprehensive analysis of the competitive landscape. Competitive analysis such as market structure, key player positioning, top winning strategies, competitive dashboard, and company evaluation quadrant has been covered in the report. Also, detailed profiles of all major companies have been provided.
US Ecotourism Market Report Coverage:
| Report Features | Details |
|---|---|
| Base Year of the Analysis | 2024 |
| Historical Period | 2019-2024 |
| Forecast Period | 2025-2033 |
| Units | Million USD |
| Scope of the Report |
Exploration of Historical Trends and Market Outlook, Industry Catalysts and Challenges, Segment-Wise Historical and Future Market Assessment:
|
| Traveler Types Covered | Solo, Group |
| Age Groups Covered | Generation X, Generation Y, Generation Z |
| Sales Channels Covered | Travel Agent, Direct |
| Regions Covered | Northeast, Midwest, South, West |
| Customization Scope | 10% Free Customization |
| Post-Sale Analyst Support | 10-12 Weeks |
| Delivery Format | PDF and Excel through Email (We can also provide the editable version of the report in PPT/Word format on special request) |
Key Questions Answered in This Report:
- How has the US ecotourism market performed so far and how will it perform in the coming years?
- What is the breakup of the US ecotourism market on the basis of traveler type?
- What is the breakup of the US ecotourism market on the basis of age group?
- What is the breakup of the US ecotourism market on the basis of sales channel?
- What is the breakup of the US ecotourism market on the basis of region?
- What are the various stages in the value chain of the US ecotourism market?
- What are the key driving factors and challenges in the US ecotourism market?
- What is the structure of the US ecotourism market and who are the key players?
- What is the degree of competition in the US ecotourism market?
Key Benefits for Stakeholders:
- IMARC’s industry report offers a comprehensive quantitative analysis of various market segments, historical and current market trends, market forecasts, and dynamics of the US ecotourism market from 2019-2033.
- The research report provides the latest information on the market drivers, challenges, and opportunities in the US ecotourism market.
- Porter's five forces analysis assist stakeholders in assessing the impact of new entrants, competitive rivalry, supplier power, buyer power, and the threat of substitution. It helps stakeholders to analyze the level of competition within the US ecotourism industry and its attractiveness.
- Competitive landscape allows stakeholders to understand their competitive environment and provides an insight into the current positions of key players in the market.
Need more help?
- Speak to our experienced analysts for insights on the current market scenarios.
- Include additional segments and countries to customize the report as per your requirement.
- Gain an unparalleled competitive advantage in your domain by understanding how to utilize the report and positively impacting your operations and revenue.
- For further assistance, please connect with our analysts.
 Request Customization
 Speak to an Analyst
 Request Brochure
 Inquire Before Buying
Benefits of Customization
- Personalize this research
- Triangulate with your data
- Get data as per your format and definition
- Gain a deeper dive into a specific application, geography, customer, or competitor
- Any level of personalization
Get in Touch With Us
UNITED STATES
Phone: +1-201-971-6302
INDIA
Phone: +91-120-433-0800
UNITED KINGDOM
Phone: +44-753-714-6104
Email: sales@imarcgroup.com
Client Testimonials


.webp)


