
US Generic Injectables Market Report by Therapeutic Area (Oncology, Anesthesia, Anti-Infectives, Parenteral Nutrition, Cardiovascular), Container (Vials, Ampoules, Premix, Prefilled Syringes), Distribution Channel (Hospitals, Retail Pharmacy) 2026-2034
Market Overview:
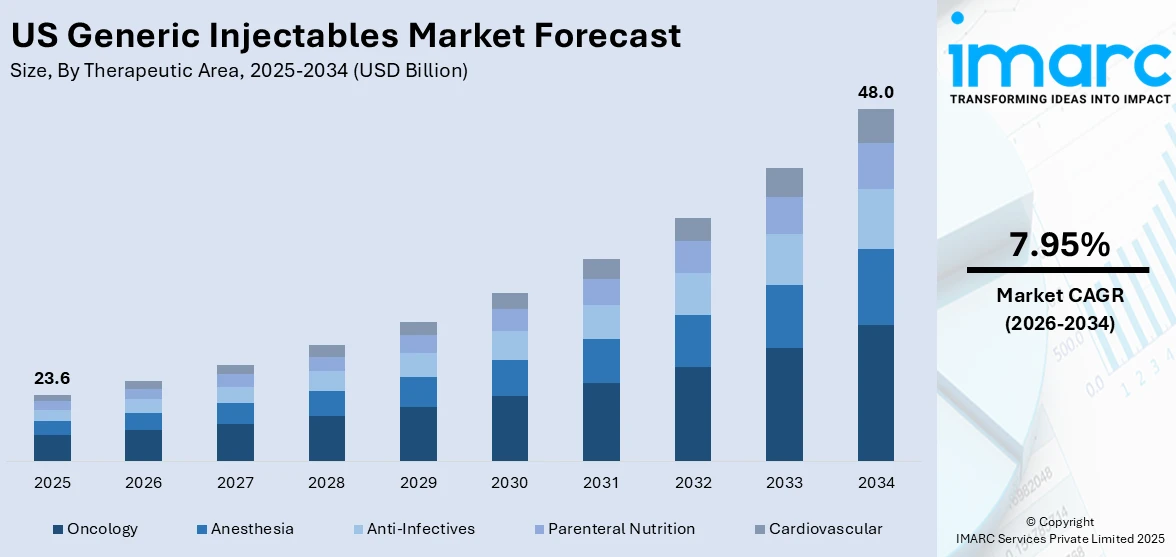
The US generic injectables market size reached USD 23.6 Billion in 2025. Looking forward, IMARC Group expects the market to reach USD 48.0 Billion by 2034, exhibiting a growth rate (CAGR) of 7.95% during 2026-2034. The increasing demand for cost-effective healthcare, the upcoming expiration of patent drugs, and the implementation of favorable initiatives to encourage the use of generic drugs, including injectables are among the key factors driving the market growth.
|
Report Attribute
|
Key Statistics
|
|---|---|
|
Base Year
|
2025
|
|
Forecast Years
|
2026-2034
|
|
Historical Years
|
2020-2025
|
|
Market Size in 2025
|
USD 23.6 Billion |
|
Market Forecast in 2034
|
USD 48.0 Billion |
| Market Growth Rate (2026-2034) | 7.95% |
Generic injectables, also known as generic sterile injectable drugs, are pharmaceutical products that are equivalent to their branded counterparts in terms of active ingredients, dosage form, strength, route of administration, quality, safety, and efficacy. These medications are administered through injection and are used for various therapeutic purposes, including the treatment of acute and chronic conditions. Generic injectables are produced after the expiration of patents held by the original brand-name drug manufacturers. Once the patent protection ends, other pharmaceutical companies can develop and manufacture generic versions of the injectable drug. These generic versions undergo rigorous testing and approval processes by regulatory authorities, such as the U.S. Food and Drug Administration (FDA), to ensure their safety, effectiveness, and quality.
To get more information on this market Request Sample
The market is primarily driven by the increasing prevalence of chronic diseases. Chronic diseases such as cancer, diabetes, and cardiovascular diseases require long-term treatment, often involving injectable medications. The growing prevalence of these diseases in the US population drives the demand for injectables, including generic versions as generic injectables offer a cost-effective solution for managing chronic conditions. In addition, the US population is aging, leading to an increased demand for healthcare services, including injectable medications. As the elderly population grows, there is a higher incidence of age-related conditions that require injectable treatments. Moreover, generic injectables manufacturers are expanding their manufacturing capabilities, both in the US and globally. This increased capacity allows for a wider range of generic injectables to be produced and supplied to the US market. The availability of a diverse portfolio of generic injectables is also propelling the market growth.
US Generic Injectables Market Trends/Drivers:
The increasing demand for cost-effective healthcare
The rising healthcare costs in the US have put a strain on patients and healthcare systems. Generic injectables offer a more affordable alternative to branded injectable drugs. By choosing generic injectables, patients can save on their out-of-pocket expenses, while healthcare systems and insurance providers can reduce their overall healthcare expenditures. The cost savings associated with generic injectables contribute to increased adoption and utilization in the healthcare system. Moreover, generic injectables enhance access to essential drugs by offering more affordable options. This is particularly beneficial for patients who may face financial barriers in accessing branded drugs. With a wider availability of cost-effective generic injectables, more patients can access the medications they need, improving overall healthcare outcomes.
Patent expirations of branded drugs
Generic injectables are similar in terms of active ingredients, dosage form, strength, and route of administration to the branded drugs. The expiration of patents allows generic manufacturers to introduce affordable alternatives, providing patients and healthcare providers with a wider range of options. Moreover, the introduction of generic injectables following patent expirations improves access to medications. Branded drugs can be prohibitively expensive for some patients, leading to limited access and potential gaps in treatment. Generic injectables provide a more affordable option, ensuring that patients have access to essential medications. Improved access to medications can lead to better health outcomes and overall patient satisfaction.
The implementation of government initiatives
Government initiatives, particularly those implemented by regulatory authorities like the U.S. Food and Drug Administration (FDA), aim to streamline the approval process for generic drugs, including generic injectables. These initiatives often include measures to expedite the review and approval of generic products, reducing the time and cost required for manufacturers to bring their generic injectables to market. Moreover, government initiatives often focus on promoting price transparency and implementing reimbursement policies that encourage the use of cost-effective medications, including generic injectables. These policies may involve preferential reimbursement for generic drugs or the establishment of formularies that prioritize the use of generic injectables. By incentivizing the adoption of cost-effective options, government initiatives help drive the demand for generic injectables in the market.
US Generic Injectables Industry Segmentation:
IMARC Group provides an analysis of the key trends in each segment of the US generic injectables market report, along with forecasts for the period 2026-2034. Our report has categorized the market based on therapeutic area, container, and distribution channel.
Breakup by Therapeutic Area:
- Oncology
- Anesthesia
- Anti-Infectives
- Parenteral Nutrition
- Cardiovascular
Oncology represents the leading application segment
The report has provided a detailed breakup and analysis of the market based on the therapeutic area. This includes oncology, anesthesia, anti-infectives, parenteral nutrition, and cardiovascular. According to the report, oncology represented the largest segment.
Cancer is a significant health concern globally, including in the United States. The high prevalence of cancer creates a substantial demand for oncology treatments, including injectable medications. Oncology injectables are used in various cancer therapies, such as chemotherapy, immunotherapy, and targeted therapy. As the incidence of cancer continues to rise, the demand for oncology injectables increases accordingly. Moreover, cancer treatment can be financially burdensome for patients and healthcare systems. Generic oncology injectables provide cost savings compared to branded counterparts, allowing for more affordable cancer care. As cost considerations play a significant role in cancer treatment decisions, the availability of cost-effective generic oncology injectables has fueled their demand and market growth.
Breakup by Container:
- Vials
- Ampoules
- Premix
- Prefilled Syringes
Vials account for the majority of the market share
A detailed breakup and analysis of the market based on the container has also been provided in the report. This includes vials, ampoules, premix, and prefilled syringes. According to the report, vial accounted for the largest market share.
Vials are highly versatile and compatible with a wide range of injectable medications. They can accommodate various formulations, including liquid solutions, suspensions, and lyophilized (freeze-dried) powders, making them suitable for a diverse range of drugs. Vials can be used for both small molecule drugs and biologics, further increasing their applicability in the market. Moreover, vials have been widely accepted and approved by regulatory authorities, such as the U.S. Food and Drug Administration (FDA), for packaging injectable drugs. They meet stringent quality and stability requirements to ensure the integrity and shelf life of the medications. The established regulatory acceptance and stability of vials make them a preferred choice for generic injectable manufacturers.
Breakup by Distribution Channel:
Access the comprehensive market breakdown Request Sample
- Hospitals
- Retail Pharmacy
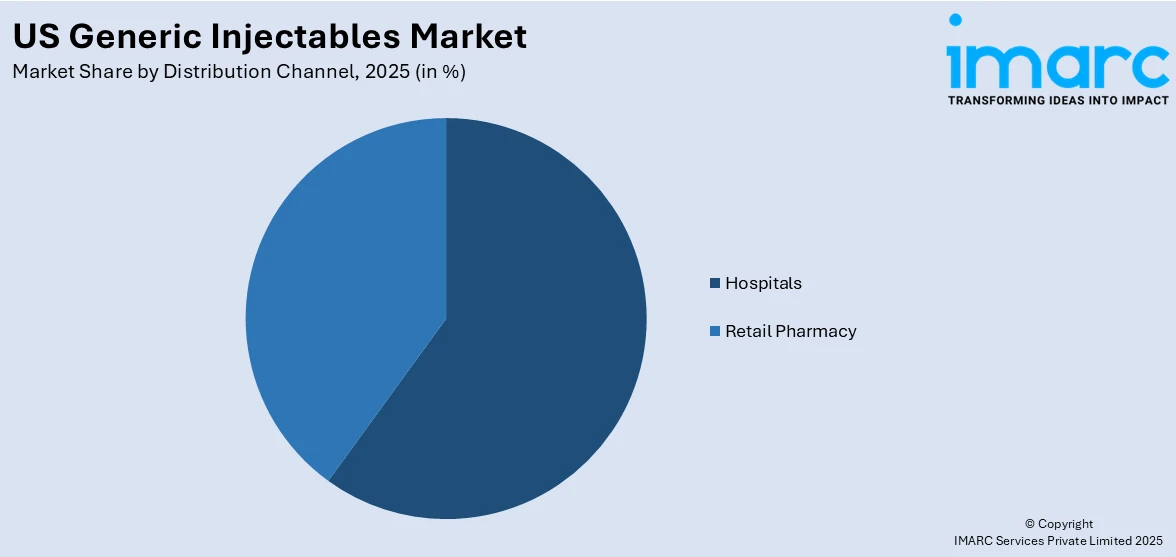
Generic injectables are widely distributed through hospitals
A detailed breakup and analysis of the market based on the distribution channel has also been provided in the report. This includes hospitals and retail pharmacy. According to the report, hospitals accounted for the largest market share.
Hospitals often have centralized drug procurement systems that enable efficient purchasing and inventory management. By including generic injectables in their formularies and procurement processes, hospitals can optimize their drug supply chain and ensure a steady and reliable stock of medications. This centralized approach facilitates cost-effective procurement, volume discounts, and streamlines the distribution of generic injectables. Moreover, hospitals maintain formularies, which are lists of approved medications that healthcare providers can prescribe to patients within the institution. Formularies often include a mix of brand-name and generic medications, with an emphasis on cost-effectiveness, thus increasing the market share of hospitals.
Competitive Landscape:
At present, key players are focusing on expanding their portfolio of generic injectables across a wide range of therapeutic areas. They are also investing in research and development (R&D) activities to identify and develop new generic injectables. Moreover, many key players are engaging in strategic partnerships, collaborations, and acquisitions to strengthen their market foothold. These partnerships also involve licensing agreements, joint ventures, or distribution agreements with other companies to enhance their product offerings and expand their geographic reach. Besides, key players are expanding their manufacturing capacities to meet the increasing demand for generic injectables. This includes setting up new production facilities, enhancing existing facilities, and adopting advanced manufacturing technologies.
The report has also provided a comprehensive analysis of the competitive landscape in the market. Some of the companies covered in the report include:
- Hospira (Pfizer Inc.)
- Hikma Pharmaceuticals PLC
- Fresenius Kabi AG
- Sagent Pharmaceuticals, Inc
- Sandoz (Novartis).
- Henry Shein Inc.
Recent Developments:
- Sandoz received FDA approval for its generic version of Sandostatin LAR (octreotide acetate for injectable suspension), a long-acting injectable medication used for the treatment of acromegaly, a hormonal disorder.
- Fresenius Kabi launched a generic version of isoproterenol hydrochloride injection, a medication used for the treatment of bradycardia (slow heart rate) and heart block.
- Pfizer Inc. launched biosimilars, including injectables such as Trazimera (trastuzumab), a biosimilar to Herceptin, used for the treatment of HER2-positive breast cancer.
US Generic Injectables Market Report Scope:
| Report Features | Details |
|---|---|
| Base Year of the Analysis | 2025 |
| Historical Period | 2020-2025 |
| Forecast Period | 2026-2034 |
| Units | Billion USD |
| Scope of the Report | Exploration of Historical and Forecast Trends, Industry Catalysts and Challenges, Segment-Wise Historical and Predictive Market Assessment:
|
| Therapeutic Areas Covered | Oncology, Anesthesia, Anti-Infectives, Parenteral Nutrition, Cardiovascular |
| Containers Covered | Vials, Ampoules, Premix, Prefilled Syringes |
| Distribution Channels Covered | Hospitals, Retail Pharmacy |
| Companies Covered | Hospira (Pfizer Inc.), Hikma Pharmaceuticals PLC, Fresenius Kabi AG, Sagent Pharmaceuticals, Inc, Sandoz (Novartis), and Henry Shein Inc. |
| Customization Scope | 10% Free Customization |
| Post-Sale Analyst Support | 10-12 Weeks |
| Delivery Format | PDF and Excel through Email (We can also provide the editable version of the report in PPT/Word format on special request) |
Key Benefits for Stakeholders:
- IMARC’s report offers a comprehensive quantitative analysis of various market segments, historical and current market trends, market forecasts, and dynamics of the US generic injectables market from 2020-2034.
- The research study provides the latest information on the market drivers, challenges, and opportunities in the US generic injectables market.
- Porter's five forces analysis assist stakeholders in assessing the impact of new entrants, competitive rivalry, supplier power, buyer power, and the threat of substitution. It helps stakeholders to analyze the level of competition within the US generic injectables industry and its attractiveness.
- Competitive landscape allows stakeholders to understand their competitive environment and provides an insight into the current positions of key players in the market.
Frequently Asked Questions About the US Generic Injectables Market Report
The US generic injectables market was valued at USD 23.6 Billion in 2025.
We expect the US generic injectables market to exhibit a CAGR of 7.95% during 2026-2034.
The sudden outbreak of the COVID-19 pandemic has led to the easy availability of generic injectables via online pharmacies with free doorstep delivery, to combat the risk of the coronavirus infection across the nation.
The rising utilization of generic injectables in treating various cardiovascular disorders without affecting the efficacy of the treatment is primarily driving the US generic injectables market.
Based on the therapeutic area, the US generic injectables market can be segmented into oncology, anesthesia, anti-Infectives, parenteral nutrition, and cardiovascular. Among these, oncology holds the majority of the total market share.
Based on the containers, the US generic injectables market has been divided into vials, ampoules, premix, and prefilled syringes, where vials currently exhibit a clear dominance in the market.
Based on the distribution channel, the US generic injectables market can be segregated into hospitals and retail pharmacy. Currently, hospitals account for the largest market share.
Need more help?
- Speak to our experienced analysts for insights on the current market scenarios.
- Include additional segments and countries to customize the report as per your requirement.
- Gain an unparalleled competitive advantage in your domain by understanding how to utilize the report and positively impacting your operations and revenue.
- For further assistance, please connect with our analysts.
 Request Customization
 Speak to an Analyst
 Request Brochure
 Inquire Before Buying
Benefits of Customization
- Personalize this research
- Triangulate with your data
- Get data as per your format and definition
- Gain a deeper dive into a specific application, geography, customer, or competitor
- Any level of personalization
Get in Touch With Us
UNITED STATES
Phone: +1-201-971-6302
INDIA
Phone: +91-120-433-0800
UNITED KINGDOM
Phone: +44-753-714-6104
Email: [email protected]
Client Testimonials


.webp)


