
Video Wall Market Report by Product (LCD Display System, LED Display System, LPD Display System, and Others), Service (Housing, Installation, Content Management), Deployment Type (Touch Based, Touch Less, Multi Touch, and Others), Technology (Rear Projection Display, Narrow Bezel Display), Vertical (Retail, IT and Telecommunication, Government and Defense, Media and Entertainment, and Others), and Region 2026-2034
Video Wall Market Size:
The global video wall market size reached USD 25.4 Billion in 2025. Looking forward, IMARC Group expects the market to reach USD 111.7 Billion by 2034, exhibiting a growth rate (CAGR) of 17.34% during 2026-2034. The market is primarily driven by the expanding digital signage industry, the notable growth in the retail sector, and the introduction of 8k resolution video wall technology, which offers creative solutions and improved visual experiences in a variety of industries.
|
Report Attribute
|
Key Statistics
|
|---|---|
|
Base Year
|
2025
|
|
Forecast Years
|
2026-2034
|
|
Historical Years
|
2020-2025
|
|
Market Size in 2025
|
USD 25.4 Billion |
|
Market Forecast in 2034
|
USD 111.7 Billion |
| Market Growth Rate (2026-2034) | 17.34% |
Video Wall Market Analysis:
- Major Market Drivers: The market for video walls is expanding due to the growing need for large-scale displays across many industries, including sports, entertainment, and advertising. Additionally, the video wall market overview presents valued insights into the emerging market due to technology improvements including flawless integration with ultra-high definition displays and digital signage systems.
- Key Market Trends: The video wall market growth is driven by the increasing use of LED video walls due to their excellent brightness, energy efficiency, and adaptability in producing immersive visual experiences. Additionally, the shift toward narrow bezel displays for seamless and immersive viewing experiences, especially in control rooms and command centers is contributing to the market growth.
- Geographical Trends: Europe is among the leading markets due to the rapid adoption of cutting-edge display technology in industries such as hospitality, retail, and transportation. Also, the retail and entertainment industries' explosive growth, along with rising infrastructure development spending, is responsible for notable growth in Asia Pacific.
- Competitive Landscape: The major video wall companies include Daktronics, Inc. (ADFLOW Networks), AU Optronics Corp., Samsung Electronics Co., Ltd., LG Display Co. Ltd., Barco NV, Acer Inc., Christie Group plc, Panasonic Corporation, Sony Corporation, Koninklijke Philips N.V, NEC Display Solutions, Planar Systems, Inc., Sharp Corporation, and Toshiba Corporation, among many others.
- Challenges and Opportunities: The challenges include the implementation of video wall systems with a high initial cost, and installation and maintenance, especially for large-scale installations. Moreover, the video wall market recent opportunities lie in the rising need for immersive and interactive display solutions, and the introduction of new technologies like virtual reality (VR) and augmented reality (AR), which can be used with video walls to improve user experiences.
To get more information on this market Request Sample
Video Wall Market Trends:
Growing Digital Signage Market
The digital signage market is primarily driven by increasing technological developments, shifting consumer habits, and rising demand for dynamic visual communication solutions across several industries are propelling the market expansion. Digital signage has become an adaptable tool for authorities looking for new and creative ways to engage audiences. It allows for the real-time delivery of tailored messages, ads, and information and offers businesses the ability to show multimedia information, such as pictures, videos, and interactive apps, with ease. This versatility allows businesses to improve brand awareness, simplify communications, and offer customers engaging experiences. For instance, in June 2023, Samsung unveiled the wall for virtual production (IVC Model) at InfoComm, a dedicated display that is currently available across the globe. Additionally, Virtual production studios easily combine virtual material with real-time visual effects technology by using ultra-large LED walls, which streamlines the process of producing content in terms of cost and time. Consequently, digital signage solutions are used in several locations, including retail outlets, corporate offices, transit hubs, and healthcare institutions, to successfully inform, entertain, and influence audiences, thus positively influencing the video wall demand.
Expansion of the Retail Sector
The use of video walls for interactive displays, product presentations, and in-store advertising is drastically changing the retail sector. Additionally, retailers are using dynamic digital displays to draw in customers, effectively communicate brand messages, and produce engaging in-store experiences. Moreover, retailers may highlight product characteristics, special offers, and brand narratives in vivid detail on video walls, which will increase customer engagement and impact purchase decisions. According to the IMARC Group, the global retail market reached US$ 28,514.0 billion in 2023. The Group further projects that it will reach US$ 46,304.9 billion by 2032, with a compound annual growth rate (CAGR) of 5.54% between 2024 and 2032. As interactive video walls also advance the whole shopping experience by empowering customers to peruse product catalogs, personalize selections, and attain more information, retailers are investing in video wall solutions to stay competitive, differentiate their brand offers, and take advantage of changing consumer tastes.
Emergence of 8K Resolution Video Walls
The emergence of 8K resolution video walls with their unmatched clarity, detail, and realism, marks a fundamental change in display technology. Additionally, 8K video walls provide breathtaking graphics that are perfect for high-end applications such as broadcast studios, high-end retail spaces, and command and control centers. They have four times the resolution of 4K monitors, and with the unparalleled accuracy and clarity offered by these ultra-high-definition displays, consumers may enjoy content with outstanding image quality and fidelity. There is a growing need for immersive visual experiences which is making progress in content development and delivery, driving the market for 8K resolution video walls. For instance, on 16 January 2024, SEADA presented its newest product, the G8K 8K creative video wall controller. The G8K standalone series of video wall controllers include two USB ports, a 4K@60P HDMI capture channel, a built-in 128GB 8K media player that can play 8K videos and photos, and a cloud messenger that can send greetings and photos to the video wall. Thus, this allows for the display of numerous contents on the video wall with picture-in-picture capability. Therefore, 8K technology is expected to transform several industries while pushing innovation and raising the bar for visual quality.
Video Wall Market Segmentation:
IMARC Group provides an analysis of the key trends in each segment of the market, along with forecasts at the global, and regional levels for 2026-2034. Our report has categorized the market based on product, service, deployment type, technology, and vertical.
Breakup by Product:
To get detailed segment analysis of this market Request Sample
- LCD Display System
- LED Display System
- LPD Display System
- Others
LED display system accounts for the majority of the market share
The report has provided a detailed breakup and analysis of the market based on the product. This includes LCD display system, LED display system, LPD display system, and others. According to the report, LCD display systems represented the largest segment.
The LED display system market is growing due to its exceptional performance and versatility. LED technology is perfect for several applications, from command-and-control centers to advertising and entertainment, as it provides brilliant colors, great brightness, and outstanding clarity. Its modular design allows for seamless scalability, enabling the creation of expansive video walls with virtually no size limitations. For instance, on 10 April 2024, the Studios recently opened a 30,040 square-foot state-of-the-art production facility in Stamford, CT. It includes the installation of Sony's Verona LED wall for virtual production. It is projected that this facility will increase production standards by providing greater flexibility, quality, and operational efficiency to WWE and outside clients. As a result, the growing need for LED display systems keeps rising as businesses and industries place a higher priority on dynamic visual communication solutions.
Breakup by Service:
- Housing
- Installation
- Content Management
Housing holds the largest share of the industry
A detailed breakup and analysis of the market based on the service have also been provided in the report. This includes housing, installation, and content management. According to the report, housing accounted for the largest market share.
Housing services cover several products and services, with applications ranging from business display solutions to home entertainment systems. Additionally, there has been a growing demand for video walls to be seamlessly integrated into numerous locations, whether it is for businesses to use them as powerful visual communication tools or for households to enjoy immersive entertainment. Hence key players are introducing advanced product variants to meet these needs. For instance, on 8 September 2023, Quantum Media Systems declared that its award-winning XDR3 LED video wall now meets the standards of DCI compliance. It is meticulously crafted for elite home theaters, tailored to enhance the viewing experience of content commonly enjoyed in residential environments. Now, Quantum introduces another captivating content option such as premier movies accessible through the exclusive movie distribution platform, the Bel Air Circuit. As a result, technological developments have enhanced the accessibility and adaptability of video walls, which reinforces the significance of housing services, thus contributing to the video wall market outlook.
Breakup by Deployment Type:
- Touch Based
- Touch Less
- Multi Touch
- Others
The report has provided a detailed breakup and analysis of the market based on the deployment type. This includes touch-based, touch less, multi-touch, and others.
Touch-based video walls are designed for engaging settings where user interaction is essential. These installations improve user experience and enable fluid engagement with the exhibited data by enabling users to immediately interact through touch gestures with the content displayed on the video wall. Interactive presentations, interactive museum displays, digital signs in retail environments, and collaborative workplaces that allow numerous users to interact at once are examples of common applications.
Touchless video walls are gaining prominence due to their ease of use and sanitary advantages, particularly in situations such as hospitals, public areas, and offices where minimizing physical contact and maintaining cleanliness are important considerations. These installations use gesture recognition, motion sensors, or other touchless technologies to allow users to interact with the content displayed on the video wall without making physical contact, ensuring a hygienic and safe user experience while preserving interactivity.
Multi-touch video walls facilitate simultaneous touch inputs from numerous users, encourage cooperation, and provide immersive multi-user experiences while offering sophisticated interactive capabilities. These deployments are ideal for settings where real-time contact and collaboration among several users are crucial, such as command and control centers, interactive displays, collaborative work environments, and educational institutions. Besides this, multi-touch functionality allows users to work together to alter information, annotate presentations, and interact with data in real time which improves engagement and fosters teamwork.
Breakup by Technology:
- Rear Projection Display
- Narrow Bezel Display
Narrow bezel displays exhibit a clear dominance in the market
A detailed breakup and analysis of the market based on the technology have also been provided in the report. This includes a rear projection display and a narrow bezel display. According to the report, narrow bezel displays accounted for the largest market share.
Narrow bezel displays are renowned for their seamless visual experiences. They have incredibly tiny borders that reduce distractions and improve the immersion of the viewing experience. This technology innovation has received high praise from several sectors, including retail, command centers, and corporate boardrooms. For instance, on 7 September 2023, Allsee unveiled Ultra-Narrow Bezel LCD video wall displays featuring an exceptionally thin 0.44mm bezel (0.88mm screen-to-screen), guaranteeing continuous large-scale graphics across many digital signage displays. These amazing video wall displays, which are designed to make an impression, are perfect for a variety of locations, such as conference rooms, public spaces, retail stores, and control rooms. Along with this, narrow bezel displays stand out as the best video wall technology available, which contributes to their leading position in the industry as companies and organizations value powerful visual presentations, thus positively generating video wall market revenue.
Breakup by Vertical:
- Retail
- IT and Telecommunication
- Government and Defense
- Media and Entertainment
- Others
Media and entertainment dominates the market
The report has provided a detailed breakup and analysis of the market based on the vertical. This includes retail, IT and telecommunication, government and defense, media and entertainment, and others. According to the report, media and entertainment represented the largest segment.
The media and entertainment are leading the way in innovation and acceptance in the entertainment industry. Additionally, the media and entertainment industry, with its voracious demand for cutting-edge technology and immersive experiences, has adopted video walls as essential tools for enthralling viewers and providing fascinating content. These vibrant screens are converting rooms into immersive visual spectacles, from expansive sports arenas to busy concert halls and movie theaters. Apart from this, media and entertainment companies have expanded the video wall systems by providing audiences with unmatched multisensory experiences that go beyond conventional viewing methods. Thus, the media and entertainment sector continues to drive the evolution of the video wall market as demand for exciting visual experiences rises, further propelling the market growth.
Breakup by Region:
To get more information on the regional analysis of this market Request Sample
- North America
- Europe
- Asia Pacific
- Middle East and Africa
- Latin America
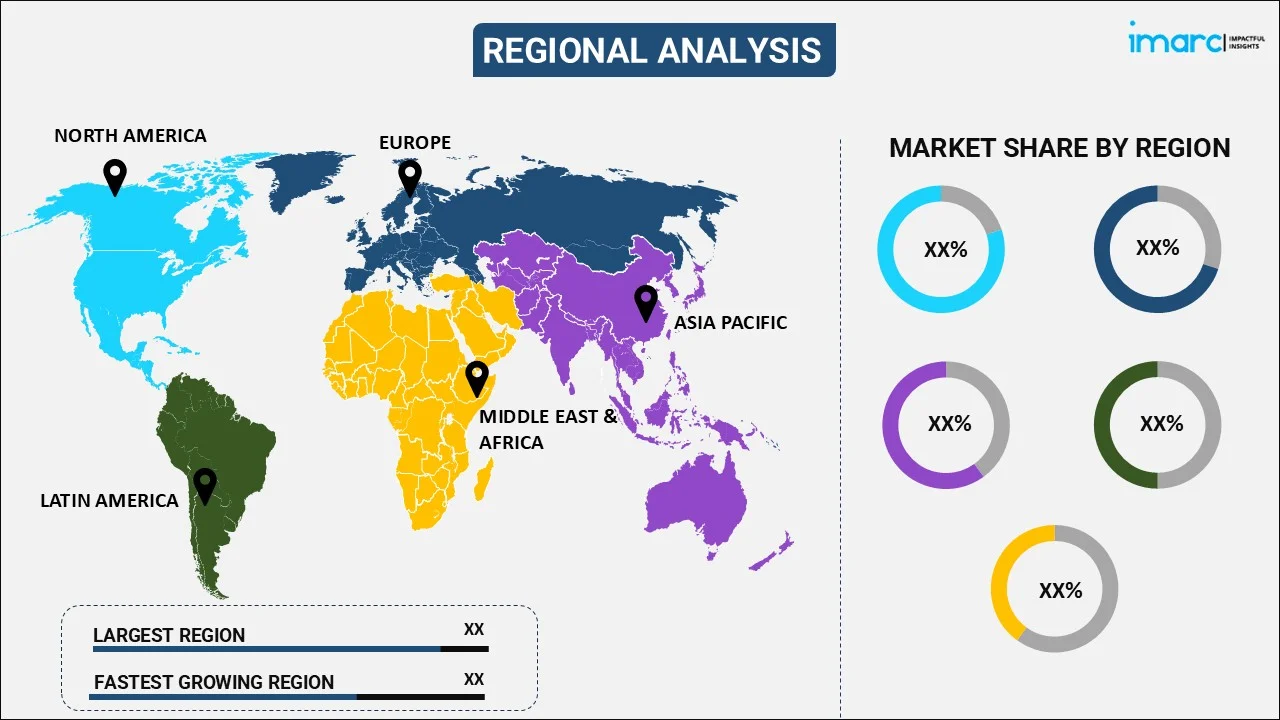
Europe leads the market, accounting for the largest video wall market share
The report has also provided a comprehensive analysis of all the major regional markets, which include North America, Europe, Asia Pacific, Latin America, and the Middle East and Africa. According to the report, Europe represents the largest regional market for video walls.
Europe has a substantial impact on the global market due to its technologically sophisticated infrastructure, strong economy, and innovative expansion. Additionally, the region takes pride in the broad use of digital signage systems across a variety of industries, including corporate settings, retail, hospitality, and transportation. As per the video wall market recent developments, in January 2024, the busiest train hub in Norway, Oslo Central Station, opened for business with a 126-square-meter LED screen. LianTronics works with a business partner to provide expert products and services to modernize the station's train information system, giving commuters access to comprehensive journey information such as train numbers, arrival statuses, and departure schedules. This is Europe's largest indoor non-commercial LED video wall, which makes commuting much more convenient. Consequently, strict guidelines and standards about display technologies have prompted the creation of premium, state-of-the-art video wall systems, thereby reinforcing Europe's leadership in the industry.
Competitive Landscape:
- The market research report has also provided a comprehensive analysis of the competitive landscape in the market. Detailed profiles of all major companies have also been provided. Some of the major market players in the video wall industry include Daktronics, Inc. (ADFLOW Networks), AU Optronics Corp., Samsung Electronics Co., Ltd., LG Display Co. Ltd., Barco NV, Acer Inc., Christie Group plc, Panasonic Corporation, Sony Corporation, Koninklijke Philips N.V, NEC Display Solutions, Planar Systems, Inc., Sharp Corporation, and Toshiba Corporation.
(Please note that this is only a partial list of the key players, and the complete list is provided in the report.)
- At present, major participants in the video wall industry are employing a range of tactics to fortify their positions and grow the market. They are making significant R&D investments to launch cutting-edge goods and technologies with improved features like better scalability, seamless integration, and higher resolutions. For instance, on 20 May 2024, Daktronics introduced a cutting-edge technology that enables content to span several LCD screens. The company's best digital signage media player, the DMP-8124 four-output media player, can output up to four channels in full high definition (FHD) or ultra-high definition (UHD). It is completely compatible with Venus Control Suite, the cloud-based program that is used nationwide for Daktronics LED, LCD screens, and video walls. Moreover, collaboration and partnerships with other technology companies, content suppliers, and system integrators are also being developed to provide comprehensive solutions suited to particular industry demands.
Video Wall Market News:
- 23 April 2024: ATEN International, a premier supplier of KVM and AV/IT connectivity and management solutions, commemorates the success of its flagship video wall processor series in the professional AV product line. It is best known for its 4K@60-pixel clarity, unmatched FPGA-based hardware performance, and intuitive interface, the series has won the prestigious 2024 Red Dot Design Award. Its standing as the first video wall processor in the industry to achieve distinction from all three major design awards simultaneously is cemented by this accomplishment, which joins its prior honors, including the 2024 iF DESIGN Award and the 2023 Good Design Award.
Video Wall Market Report Scope:
| Report Features | Details |
|---|---|
| Base Year of the Analysis | 2025 |
| Historical Period | 2020-2025 |
| Forecast Period | 2026-2034 |
| Units | Billion USD |
| Scope of the Report | Exploration of Historical Trends and Market Outlook, Industry Catalysts and Challenges, Segment-Wise Historical and Future Market Assessment:
|
| Products Covered | LCD Display Systems, LED Display Systems, LPD Display Systems, Others |
| Services Covered | Housing, Installation, Content Management |
| Deployment Types Covered | Touch-Based, Touch Less, Multi Touch, Others |
| Technologies Covered | Rear Projection Display, Narrow Bezel Display |
| Verticals Covered | Retail, IT And Telecommunication, Government and Defense, Media and Entertainment, Others |
| Regions Covered | Asia Pacific, Europe, North America, Latin America, Middle East and Africa |
| Companies Covered | Daktronics, Inc. (ADFLOW Networks), AU Optronics Corp., Samsung Electronics Co., Ltd., LG Display Co. Ltd., Barco NV, Acer Inc., Christie Group plc, Panasonic Corporation, Sony Corporation, Koninklijke Philips N.V, NEC Display Solutions, Planar Systems, Inc., Sharp Corporation, Toshiba Corporation, etc. |
| Customization Scope | 10% Free Customization |
| Post-Sale Analyst Support | 10-12 Weeks |
| Delivery Format | PDF and Excel through Email (We can also provide the editable version of the report in PPT/Word format on special request) |
Key Benefits for Stakeholders:
- IMARC’s industry report offers a comprehensive quantitative analysis of various market segments, historical and current market trends, market forecasts, and dynamics of the video wall market from 2020-2034.
- The research report provides the latest information on the market drivers, challenges, and opportunities in the global video wall market.
- The study maps the leading, as well as the fastest-growing, regional markets. It further enables stakeholders to identify the key country-level markets within each region.
- Porter's five forces analysis assists stakeholders in assessing the impact of new entrants, competitive rivalry, supplier power, buyer power, and the threat of substitution. It helps stakeholders to analyze the level of competition within the video wall industry and its attractiveness.
- The competitive landscape allows stakeholders to understand their competitive environment and provides insight into the current positions of key players in the market.
Frequently Asked Questions About the Video Wall Market Report
The video wall market was valued at USD 25.4 Billion in 2025.
We expect the global video wall market to exhibit a CAGR of 17.34% during 2026-2034.
The rising adoption of video walls in different settings, such as shopping malls, restaurants, schools, etc., along with the introduction of video walls with laser projection technology that offer improved response time, high contrast ratio, and anti-glare screens, which help in increasing readability, is primarily driving the global video wall market.
The sudden outbreak of the COVID-19 pandemic has led to the growing deployment of video walls as a creative backdrop for broadcast through online video meetings and training programs, during the remote working scenario.
Based on the product, the global video wall market has been divided into LCD display system, LED display system, LPD display system, and others. Among these, LED display system currently exhibits a clear dominance in the market.
Based on the service, the global video wall market can be categorized into housing, installation, and content management. Currently, housing accounts for the majority of the total market share.
Based on the technology, the global video wall market has been segregated into rear projection display and narrow bezel display, where narrow bezel display currently holds the largest market share.
Based on the vertical, the global video wall market can be bifurcated into retail, IT and telecommunication, government and defense, media and entertainment, and others. Currently, media and entertainment exhibits a clear dominance in the market.
On a regional level, the market has been classified into North America, Europe, Asia Pacific, Middle East and Africa, and Latin America, where Europe currently dominates the global market.
Some of the major players in the global video wall market include Daktronics, Inc. (ADFLOW Networks), AU Optronics Corp., Samsung Electronics Co., Ltd., LG Display Co. Ltd., Barco NV, Acer Inc., Christie Group plc, Panasonic Corporation, Sony Corporation, Koninklijke Philips N.V, NEC Display Solutions, Planar Systems, Inc., Sharp Corporation, Toshiba Corporation, etc.
Need more help?
- Speak to our experienced analysts for insights on the current market scenarios.
- Include additional segments and countries to customize the report as per your requirement.
- Gain an unparalleled competitive advantage in your domain by understanding how to utilize the report and positively impacting your operations and revenue.
- For further assistance, please connect with our analysts.
 Request Customization
 Speak to an Analyst
 Request Brochure
 Inquire Before Buying
Benefits of Customization
- Personalize this research
- Triangulate with your data
- Get data as per your format and definition
- Gain a deeper dive into a specific application, geography, customer, or competitor
- Any level of personalization
Get in Touch With Us
UNITED STATES
Phone: +1-201-971-6302
INDIA
Phone: +91-120-433-0800
UNITED KINGDOM
Phone: +44-753-714-6104
Email: [email protected]
Client Testimonials


.webp)


