
Virtual Production Market Report by Component (Hardware, Software, Services), Type (Pre-production, Production, Post-production), End User (Movies, TV Series, Commercial Ads, Online Videos, and Others), and Region 2026-2034
Virtual Production Market Size:
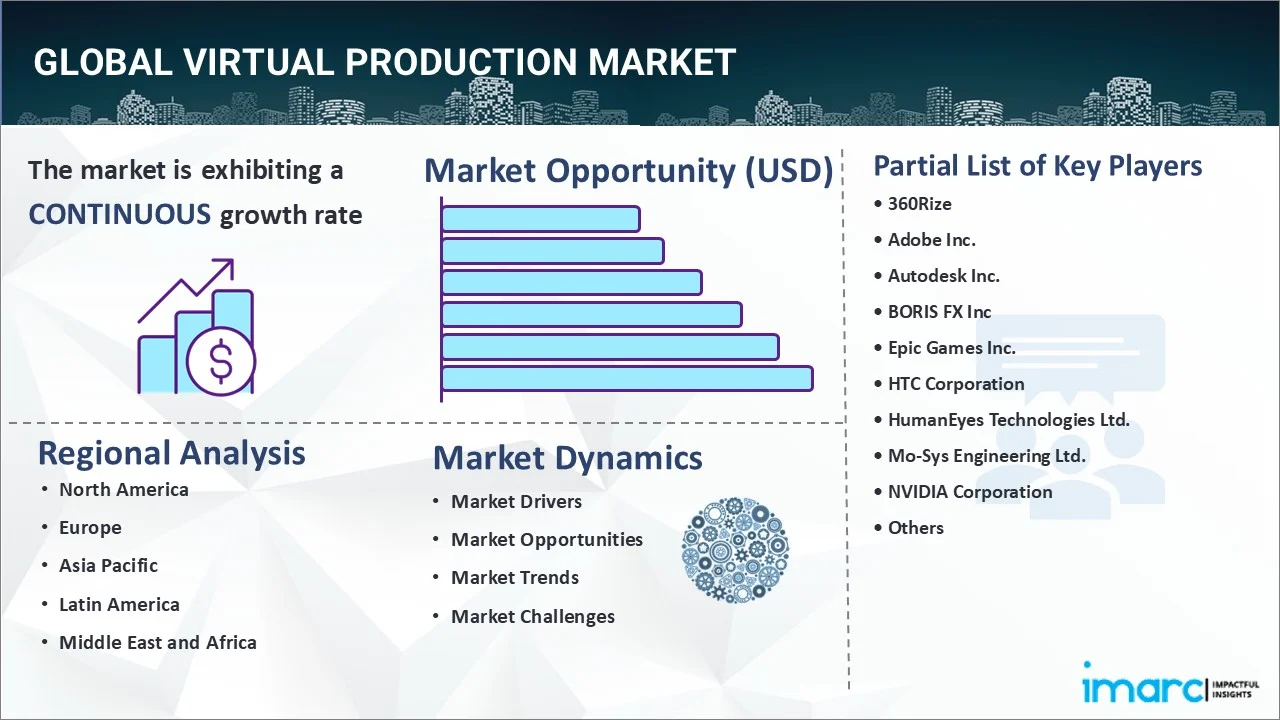
The global virtual production market size reached USD 3.1 Billion in 2025. Looking forward, the market is expected to reach USD 6.9 Billion by 2034, exhibiting a growth rate (CAGR) of 9.50% during 2026-2034. Some of the key market trends include rising demand for high-quality content, technological advancements such as real-time rendering and motion capture, cost-effective production, increased adoption in the film and gaming industries, and expanding applications in virtual events and training simulations.
|
Report Attribute
|
Key Statistics
|
|---|---|
|
Base Year
|
2025
|
|
Forecast Years
|
2026-2034
|
|
Historical Years
|
2020-2025
|
|
Market Size in 2025
|
USD 3.1 Billion |
|
Market Forecast in 2034
|
USD 6.9 Billion |
| Market Growth Rate 2026-2034 | 9.50% |
Virtual Production Market Analysis:
- Market Growth and Size: The virtual production market is expanding rapidly, driven by rising demand across several sectors and geographies. It is predicted to grow significantly in the next years, owing to the adoption of improved technology and the expansion of applications.
- Major Market Drivers: Technology improvements, like real-time rendering and motion capture, are propelling market expansion by enabling more immersive and efficient content creation processes. Furthermore, evolving consumer desires for immersive and interactive experiences are increasing the demand for virtual production solutions.
- Technological Advancements: Advancements in real-time rendering, motion capture, and gaming engine platforms are transforming virtual production workflows, allowing filmmakers and content producers to attain more realism and inventiveness. In accordance with this, the integration of artificial intelligence (AI) and machine learning (ML) algorithms improves the efficiency and capacities of virtual production tools.
- Industry Applications: Virtual production techniques are frequently used in sectors such as cinema, television, gaming, advertising, architecture, automotive, education, and healthcare. These uses include producing immersive narrative experiences, enabling product visualization, training simulations, and interactive marketing efforts.
- Key Market Trends: The growth of virtual events and live streaming has accelerated the use of virtual production for generating dynamic and engaging experiences in real time. Furthermore, increased collaboration between conventional production studios and technology businesses is resulting in the creation of novel virtual production solutions and services.
- Geographical Trends: Europe, Asia Pacific, and North America are important areas driving the expansion of the virtual production industry, owing to booming entertainment industries and government backing for innovation. Furthermore, Latin America, the Middle East, and Africa are developing as key markets, owing to increased investment in media and entertainment infrastructure.
- Competitive Landscape: The virtual production market is characterized by fierce rivalry between important companies such as technology suppliers, production studios, and service providers. Major companies are expanding their attention on product innovation, strategic collaborations, and mergers and acquisitions, which is boosting virtual production market share.
- Challenges and Opportunities: Challenges include the high initial expenses of integrating virtual production workflows, technological challenges, and the requirement for specialized labor. On the other hand, possibilities exist in extending applications in emerging sectors, developing inexpensive virtual production solutions, and meeting the growing demand for immersive content experiences.
To get more information on this market Request Sample
Virtual Production Market Trends:
Ongoing technological advancements
Ongoing technological advancements are the core driving force behind the booming virtual production market. This trend encompasses continuous innovation in real-time rendering engines like Unreal Engine, enabling immediate visualization of photorealistic virtual environments and characters. Concurrently, LED volume technology is rapidly evolving, with higher resolution, color accuracy, and refresh rates transforming digital backdrops into immersive, interactive sets that integrate seamlessly with live action. Furthermore, the increasing integration of AI and machine learning is automating complex tasks like facial animation and asset generation, while advancements in motion capture and camera tracking enhance the fluidity between physical and virtual elements.
Changing consumer preferences
The virtual production market is affected considerably by changing viewer expectations for more immersive and visually rich content. Audiences, accustomed to the high-definition visuals of contemporary video games and the glossy looks of streaming box office hits, now anticipate a better visual quality from all media. This expectation, combined with the endless appetite for new, interesting content from multiplying streaming platforms, drives the need for creators to find new ways of producing. In addition, there is an emerging demand for interactive and bespoke experiences, which virtual production easily serves through its ability to create dynamic, real-time worlds. As a result, content creators are increasingly using virtual production to provide the innovative, visually enhanced experiences that today's sophisticated viewers and users desire.
Rising focus on cost efficiencies
Virtual production offers significant cost efficiencies compared to traditional filmmaking techniques, making it an attractive option for content creators looking to optimize their production budgets. By leveraging virtual environments and digital assets, filmmakers can reduce reliance on physical sets, props, and location shoots, resulting in lower production costs and faster turnaround times. Furthermore, virtual production enables filmmakers to iterate more quickly and experiment with different creative ideas without incurring additional expenses. Additionally, virtual production facilitates remote collaboration and distributed workflows, enabling teams to work together seamlessly across different locations, which is further aiding in market expansion.
Expanding product applications
The applications of virtual production extend beyond traditional media and entertainment industries, encompassing a wide range of sectors such as architecture, automotive, education, and healthcare. In architecture and design, virtual production enables architects and designers to visualize and simulate architectural spaces in real-time, facilitating better decision-making and enhancing client presentations. In the automotive industry, virtual production is used for product visualization, virtual showrooms, and interactive configurators, allowing customers to customize and visualize their vehicles before making a purchase. Moreover, the increasing use of virtual production in healthcare for medical training, surgical simulations, and patient education is providing an impetus to the market growth.
Virtual Production Industry Segmentation:
IMARC Group provides an analysis of the key trends in each segment of the market, along with forecasts at the global, regional, and country levels for 2026-2034. Our report has categorized the market based on component, type, and end user.
Breakup by Component:
To get detailed segment analysis of this market Request Sample
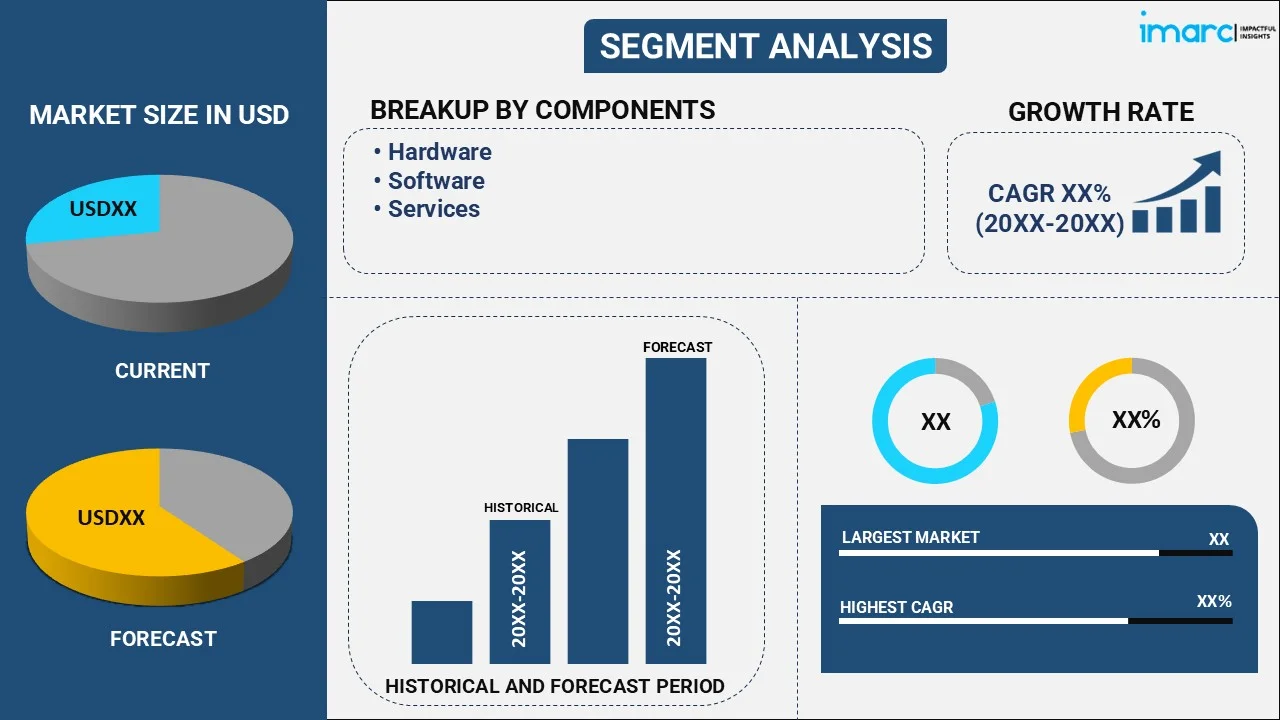
- Hardware
- Software
- Services
Software accounts for the majority of the market share
The report has provided a detailed breakup and analysis of the market based on the component. This includes hardware, software, and services. According to the report, software represented the largest segment.
The demand for virtual production software is primarily propelled by its critical role in enabling real-time rendering, seamless integration of virtual elements with live-action footage, and providing powerful tools for content creators to visualize and manipulate complex scenes. Moreover, the adoption of game engine platforms that offer advanced rendering capabilities and robust development environments is driving the need for virtual production software that can leverage these platforms to create immersive and visually stunning content experiences.
Besides this, the need for virtual production gear is driven by the necessity for high-performance computer systems, specialised cameras, motion capture devices, and VR/AR headsets to meet the immersive and real-time rendering requirements of virtual production processes.
Furthermore, the need for virtual production services is driven by the need for expertise in areas like as motion capture, virtual set design, real-time rendering, and post-production integration, as content producers strive to streamline their processes and achieve professional-grade outcomes.
Breakup by Type:
- Pre-production
- Production
- Post-production
Post-production holds the largest share in the industry
A detailed breakup and analysis of the market based on the type have also been provided in the report. This includes pre-production, production, and post-production. According to the report, post-production accounted for the largest market share.
Post-production becomes more efficient because many visual elements are finalized during the shoot itself. Since effects are rendered in real time or near-final during production, editors and VFX artists spend less time correcting or rebuilding shots. This shortens timelines for compositing, color grading, and final renders, helping content reach audiences faster. Furthermore, production benefits from LED volumes, real-time rendering, and motion capture, enabling teams to shoot complex scenes in a controlled studio environment while seeing final-quality visuals live on set. Actors perform in immersive, reactive environments, which speeds up filming and reduces the need for green screen work or multiple location shoots. It also allows for on-the-spot creative decisions with accurate lighting and camera tracking. Additionally, pre-production in virtual production involves using tools like virtual scouting, real-time previs, and 3D asset creation to plan scenes with high precision before cameras roll. Directors, DPs, and VFX teams can visualize entire sequences with virtual cameras and digital environments, which helps reduce uncertainty and costly last-minute changes.
Breakup by End User:
- Movies
- TV Series
- Commercial Ads
- Online Videos
- Others
Movies represents the leading market segment
The report has provided a detailed breakup and analysis of the market based on the end user. This includes movies, TV series, commercial ads, online videos, and others. According to the report, movies represented the largest segment.
The demand for virtual production in the movie industry is primarily driven by its capability to enhance storytelling through immersive environments, realistic visual effects, and dynamic cinematography. Filmmakers are increasingly adopting virtual production techniques to create visually stunning and engaging content that captivates audiences and sets their productions apart. Furthermore, virtual production offers cost efficiencies and creative flexibility, enabling filmmakers to bring ambitious projects to life while meeting tight production schedules and budget constraints.
For TV series, virtual production offers a revolutionary approach to content creation. With the boom of OTT platforms like Netflix and Disney+, there's an insatiable need for high-quality, visually immersive episodic content. Virtual production, utilizing technologies like LED walls and real-time rendering, enables producers to create elaborate and diverse environments without costly physical sets or extensive on-location shoots.
Commercial ads leverage virtual production for its ability to generate striking, often fantastical visuals and interactive experiences. Brands can create dynamic, engaging advertisements that would be impractical or impossible with traditional methods, captivating audiences with innovative storytelling and customizable environments.
Finally, the burgeoning segment of online videos benefits immensely. From independent content creators to corporate videos and digital marketing, virtual production allows for professional-grade visuals and immersive experiences, previously exclusive to large studios, to be achieved with more accessible tools. This democratizes high-end content creation, driving wider adoption and market growth.
Breakup by Region:
To get more information on the regional analysis of this market Request Sample
- North America
- United States
- Canada
- Asia-Pacific
- China
- Japan
- India
- South Korea
- Australia
- Indonesia
- Others
- Europe
- Germany
- France
- United Kingdom
- Italy
- Spain
- Russia
- Others
- Latin America
- Brazil
- Mexico
- Others
- Middle East and Africa
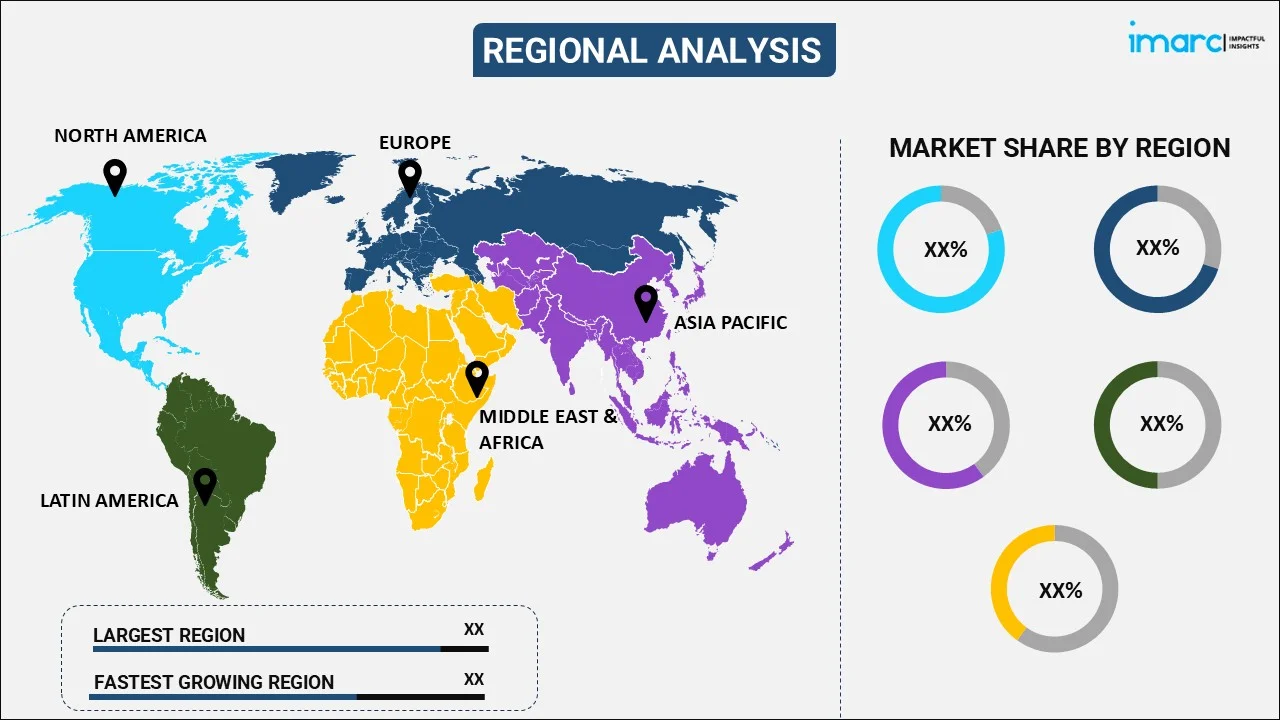
North America leads the market, accounting for the largest virtual production market share
The market research report has also provided a comprehensive analysis of all the major regional markets, which include North America (the United States and Canada); Europe (Germany, France, the United Kingdom, Italy, Spain, Russia, and others); Asia Pacific (China, Japan, India, South Korea, Australia, Indonesia, and others); Latin America (Brazil, Mexico, and others); and the Middle East and Africa. According to the report, North America accounted for the largest market share.
North America's growing demand for virtual production, driven by a dynamic entertainment sector that pursues innovation and cutting-edge technology to give fascinating content to consumers all over the world, is fueling market expansion. With Hollywood at the forefront, North America serves as a film and television production powerhouse, where virtual production techniques are increasingly being used to simplify processes, lower production costs, and push the frontiers of narrative through immersive and visually spectacular experiences.
Besides this, Europe's successful film industry aspires to remain competitive worldwide, and government incentives to encourage innovation in filmmaking technology and processes are creating lucrative chances for market development.
Concurrently, Asia Pacific's need for virtual production is being driven by the region's rapidly expanding entertainment sector, increased expenditures in digital content development, and a desire to create high-quality material for both domestic and international consumers.
In line with this, Latin America's rich cultural legacy and unique narrative traditions are encouraging the use of innovative filmmaking technology to improve the production value of films and television shows, which is increasing the virtual production market share.
Furthermore, the Middle East and Africa's thriving media and entertainment sectors, as well as the rising desire for high-quality content to engage consumers and enhance narrative standards, are driving market growth.
Leading Key Players in the Virtual Production Industry:
The global virtual production market is marked by a very competitive environment that consists of a combination of well-established technology providers, production studios, and niche service providers. Dominant players control the market with their sophisticated game engine platforms and virtual production tools that provide end-to-end solutions for real-time rendering, motion capture, and virtual set design. In addition, large movie studios and production houses are increasingly investing in virtual production capacity in-house to ensure that they have creative control over their products and benefit from the cost savings and productivity provided by virtual production methods. In addition, an increasing number of professional service vendors are appearing that specialize in areas like motion capture, virtual set creation, and post-production integration to suit the varied needs of creators in different sectors.
The competitive landscape has been thoroughly analyzed through the market research report. Detailed profiles of all major companies have also been provided. Some of the key players in the market include:
- 360Rize
- Adobe Inc.
- Autodesk Inc.
- BORIS FX Inc
- Epic Games Inc.
- HTC Corporation
- HumanEyes Technologies Ltd.
- Mo-Sys Engineering Ltd.
- NVIDIA Corporation
- Panocam3d.com
- Pixar (The Walt Disney Company)
- SideFX
- Technicolor Creative Studios SA
- Vicon Motion Systems Limited (Oxford Metrics PLC)
(Please note that this is only a partial list of the key players, and the complete list is provided in the report.)
Latest News:
- In April 2025, Samsung and Vu proudly joined the NAB Show 2025, which ran from April 5 to April 9 in Las Vegas. Its presence this year was particularly strong as it was able to effectively demonstrate its newest advances in Virtual Production. During the NAB Show, it was brought to light how Samsung's LED displays, when paired with Vu Technologies' software, gave creators the power to engage with and adjust digital elements in real-time on set.
- In January 2025, Mindshow, the AI-powered CG animation studio, introduced its new virtual production platform. This business development takes advantage of Mindshow's background of delivering high-end animated content for top entertainment brands such as Mattel, ESPN, Netflix, Pepsi, and Original Pictures, allowing it to deliver excellent quality animation at unprecedented speed and efficiency.
Virtual Production Market Report Scope:
| Report Features | Details |
|---|---|
| Base Year of the Analysis | 2025 |
| Historical Period | 2020-2025 |
| Forecast Period | 2026-2034 |
| Units | Billion USD |
| Scope of the Report | Exploration of Historical Trends and Market Outlook, Industry Catalysts and Challenges, Segment-Wise Historical and Future Market Assessment:
|
| Components Covered | Hardware, Software, Services |
| Types Covered | Pre-production, Production, Post-production |
| End Users Covered | Movies, TV Series, Commercial Ads, Online Videos, Others |
| Regions Covered | Asia Pacific, Europe, North America, Latin America, Middle East and Africa |
| Countries Covered | United States, Canada, Germany, France, United Kingdom, Italy, Spain, Russia, China, Japan, India, South Korea, Australia, Indonesia, Brazil, Mexico |
| Companies Covered | 360Rize, Adobe Inc., Autodesk Inc., BORIS FX Inc, Epic Games Inc., HTC Corporation, HumanEyes Technologies Ltd., Mo-Sys Engineering Ltd., NVIDIA Corporation, Panocam3d.com, Pixar (The Walt Disney Company), SideFX, Technicolor Creative Studios SA, Vicon Motion Systems Limited (Oxford Metrics PLC), etc. |
| Customization Scope | 10% Free Customization |
| Post-Sale Analyst Support | 10-12 Weeks |
| Delivery Format | PDF and Excel through Email (We can also provide the editable version of the report in PPT/Word format on special request) |
Key Benefits for Stakeholders:
- IMARC’s industry report offers a comprehensive quantitative analysis of various market segments, historical and current market trends, market forecasts, and dynamics of the virtual production market from 2020-2034.
- The research report provides the latest information on the market drivers, challenges, and opportunities in the global virtual production market.
- The study maps the leading, as well as the fastest-growing, regional markets. It further enables stakeholders to identify the key country-level markets within each region.
- Porter's five forces analysis assists stakeholders in assessing the impact of new entrants, competitive rivalry, supplier power, buyer power, and the threat of substitution. It helps stakeholders to analyze the level of competition within the virtual production industry and its attractiveness.
- The competitive landscape allows stakeholders to understand their competitive environment and provides insight into the current positions of key players in the market.
Frequently Asked Questions About the Virtual Production Market Report
Virtual production combines physical and digital filmmaking, utilizing technology like as LED walls and game engines to create real-time virtual settings. This enables performers to perform against dynamic, interactive backdrops, greatly expediting the production process and minimizing the need for traditional green screens.
We expect the global virtual production market to exhibit a CAGR of 9.50% during 2026-2034.
The rising applications of AR and VR technologies, along with the growing usage of virtual production methods in live entertainment, fashion, and news reporting to provide engaging virtual experiences, are primarily driving the global virtual production market.
The sudden outbreak of the COVID-19 pandemic has led to the widespread adoption of virtual production methods in remote filmmaking techniques by creating a digital environment across the entertainment industry to produce interactive content during lockdown scenarios.
Based on the component, the global virtual production market can be categorized into hardware, software, and services. Among these, software exhibits clear dominance in the market.
Based on the type, the global virtual production market has been segmented into pre-production, production, and post-production. Currently, post-production represents the largest market share.
Based on the end user, the global virtual production market can be bifurcated into movies, TV series, commercial ads, online videos, and others. Among these, movies account for the majority of the total market share.
On a regional level, the market has been classified into North America, Europe, Asia-Pacific, Middle East and Africa, and Latin America, where North America currently dominates the global market.
Some of the major players in the global virtual production market include 360Rize, Adobe Inc., Autodesk Inc., BORIS FX Inc, Epic Games Inc., HTC Corporation, HumanEyes Technologies Ltd., Mo-Sys Engineering Ltd., NVIDIA Corporation, Panocam3d.com, Pixar (The Walt Disney Company), SideFX, Technicolor Creative Studios SA, and Vicon Motion Systems Limited (Oxford Metrics PLC).
Need more help?
- Speak to our experienced analysts for insights on the current market scenarios.
- Include additional segments and countries to customize the report as per your requirement.
- Gain an unparalleled competitive advantage in your domain by understanding how to utilize the report and positively impacting your operations and revenue.
- For further assistance, please connect with our analysts.
 Request Customization
 Speak to an Analyst
 Request Brochure
 Inquire Before Buying
Benefits of Customization
- Personalize this research
- Triangulate with your data
- Get data as per your format and definition
- Gain a deeper dive into a specific application, geography, customer, or competitor
- Any level of personalization
Get in Touch With Us
UNITED STATES
Phone: +1-201-971-6302
INDIA
Phone: +91-120-433-0800
UNITED KINGDOM
Phone: +44-753-714-6104
Email: [email protected]
Client Testimonials


.webp)


