
Voltage Regulators Market Size, Share, Trends and Forecast by Topology, Type, End-Use Industry, and Region, 2026-2034
Voltage Regulators Market Size and Share:
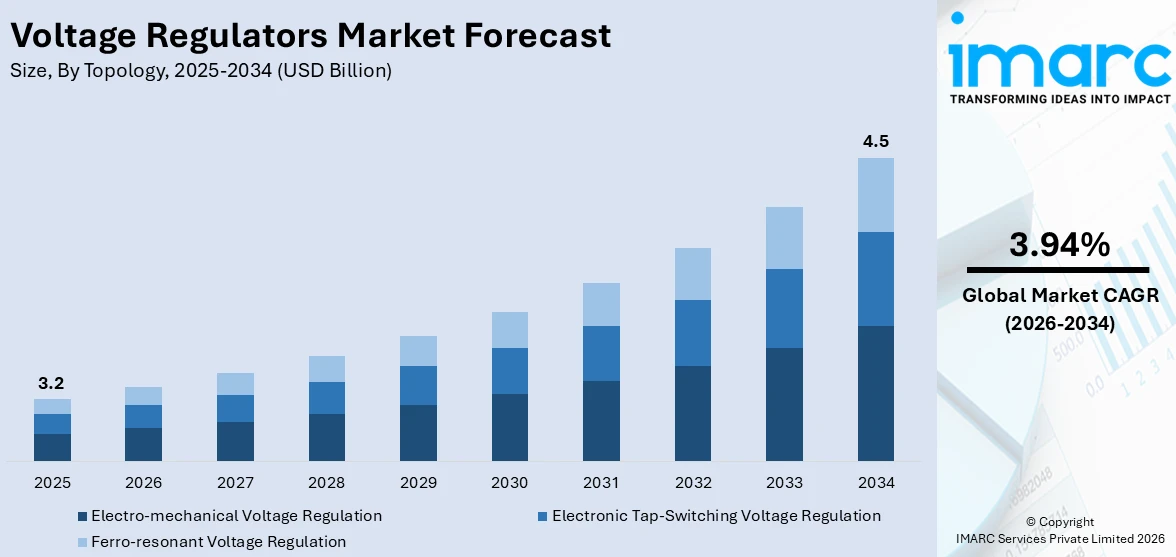
The global voltage regulators market size was valued at USD 3.2 Billion in 2025. Looking forward, IMARC Group estimates the market to reach USD 4.5 Billion by 2034, exhibiting a CAGR of 3.94% from 2026-2034. Asia Pacific currently dominates the market in 2025. The increasing demand for stable power supply in electronic devices, the widespread adoption of renewable energy systems, the expanding automotive industry needs, and the rising implementation of smart grids and advanced power distribution systems are some of the major factors propelling the growth of the market.
|
Report Attribute
|
Key Statistics
|
|---|---|
|
Base Year
|
2025
|
|
Forecast Years
|
2026-2034
|
|
Historical Years
|
2020-2025
|
|
Market Size in 2025
|
USD 3.2 Billion |
|
Market Forecast in 2034
|
USD 4.5 Billion |
| Market Growth Rate (2026-2034) | 3.94% |
The global consumer electronics market is experiencing robust growth, significantly influencing the demand for voltage regulators. In India, sale of consumer electronics items grew by 10% in value in 2024. This expansion is driven by the increasing adoption of advanced technologies and the rising popularity of smart devices. Furthermore, the telephony segment, encompassing smartphones and related accessories, is expected to generate a market volume of €462.70 billion in 2023, underscoring the dominance of mobile communication devices. The surge in consumer electronics directly impacts the voltage regulators market, as these devices require stable and efficient power management solutions. Voltage regulators ensure consistent voltage levels, thereby enhancing the performance and longevity of electronic devices. As the consumer electronics market continues to grow, the demand for reliable voltage regulation solutions is anticipated to rise correspondingly.
To get more information on this market Request Sample
The United States voltage regulators market is experiencing significant growth, driven by several key factors. The U.S. consumer electronics market is growing rapidly. This growth is propelled by the increasing adoption of advanced technologies and the rising popularity of smart devices, all of which require efficient power management solutions. Additionally, the manufacturing sector is embracing automation technologies to enhance productivity and efficiency. Voltage regulators are essential in maintaining stable power delivery to sensitive industrial equipment, ensuring optimal performance and longevity. This trend is contributing to the increased demand for voltage regulation solutions in the industrial sector. Moreover, major U.S. utilities are ramping up capital expenditures to upgrade electric lines and grids, with an average increase of 22% over the next three years starting in 2025. This surge is driven by expected high demand from AI-focused data centers and electric vehicles, necessitating advanced voltage regulation solutions to ensure a stable power supply.
Voltage Regulators Market Trends:
Increasing Demand for Stable Power Supply
The growing need for consistent and reliable power supply in consumer electronics, industrial applications, and telecommunications is driving the demand for voltage regulators to prevent damage from voltage fluctuations. With the proliferation of electronic devices and systems across various industries, the need for a stable and reliable power supply has become critical. According to industry reports, in 2023, the demand for components and sub-assemblies stood at USD 45.5 Billion to support USD 102 Billion worth of electronics production. This demand is expected to scale to USD 240 billion to support USD 500 Billion worth of electronics production by 2030. According to IBEF, the government aims to make electronics one of the top three export categories by 2025-26. A USD 1 Trillion digital economy target is projected to boost demand for electronics, which may stand at around USD 180 Billion by 2025-26. This increasing demand for electronics is further enhancing the voltage regulators market value significantly.
Expansion of Renewable Energy Systems
The integration of renewable energy sources, solar and wind, into power systems increases the importance of voltage regulation on grid connection for managing these various outputs before a reliable supply can be ensured. Most renewable energy systems are characterized by very variable power outputs, thus, voltage regulators form an important part of ensuring a stable power supply, which is vital in the operation of these systems. For example, in July 2024, GreenPowerMonitor (GPM), a DNV company, rolled out state-of-the-art Energy Management System (EMS) intended especially for renewable power plants. Such kind of advancement indicates that this progress will change the effective functioning of these facilities, parallelizing the globally underway push to ramp up renewable energy capacity. In DNV's 2023 Energy Transition Outlook is mentioned the fact that renewable energy currently covers little more than 20 percent of the energy mix globally and is estimated to reach a total of 52 percent by 2050. According to forecast analysis of the voltage regulators market, this is assumed to boost the future growth of the market in the years to come.
Significant Advancements in Smart Grid Technology
The development and implementation of smart grids represent a significant advancement in the electrical infrastructure. For instance, in December 2023, Saudi Arabian electric utility company and NEOM subsidiary ENOWA announced the development of a blueprint for a high-voltage smart grid that has never been built before in the world. The increasing integration of smart grid technologies is essential for meeting the increasing energy demands and improving the sustainability and resilience of electrical grids. Voltage regulators play a crucial role in stabilizing the power supply within smart grids, facilitating real-time monitoring, and enhancing the overall efficiency and reliability of power distribution networks. As the demand for smart grids grows, the voltage regulators market forecast indicates a significant expansion, driven by the increasing need for advanced technologies to ensure efficient power distribution and grid stability.
Voltage Regulators Industry Segmentation:
IMARC Group provides an analysis of the key trends in each segment of the global voltage regulators market, along with forecast at the global, regional, and country levels from 2026-2034. The market has been categorized based on topology, type, and end-use industry.
Analysis by Topology:
- Electro-mechanical Voltage Regulation
- Electronic Tap-Switching Voltage Regulation
- Ferro-resonant Voltage Regulation
The demand for electro-mechanical voltage regulation is driven by its robustness and reliability in handling large power loads. It is ideal for industrial and heavy-duty applications where durability and longevity are crucial, providing stable voltage output in environments with significant electrical fluctuations.
The demand for electronic tap-switching voltage regulation stems from its precision and fast response to voltage variations. It is widely used in modern power distribution systems, ensuring stable voltage supply for sensitive equipment. Its ability to handle rapid load changes makes it suitable for applications in telecommunications and data centers.
Ferro-resonant voltage regulation is in demand due to its ability to provide stable output voltage with inherent surge protection and noise filtering. It is favored in environments with unstable power supply, such as medical equipment, computer systems, and critical industrial applications, where consistent performance and reliability are essential.
Analysis by Type:
- Linear Voltage Regulator
- Breakup by Connection Type
- Series
- Shunt
- Breakup by Product Type
- Low Drop Out (LDO)
- Standard
- Breakup by Connection Type
- Switching Voltage Regulator
- Breakup by Product Type
- Step-Down (Buck)
- Step-Up (Boost)
- Step-Down/Step-Up (Buck-Boost)
- Inverting
- Breakup by Product Type
The demand for linear voltage regulators is driven by their simplicity, low noise output, and reliability. They are preferred in applications requiring a stable and noise-free power supply, such as audio and RF circuits, and sensitive analog devices. Their ease of use and ability to provide a precise output voltage with minimal components make them ideal for low-power, low-cost applications in consumer electronics and various portable devices, thus driving the voltage regulators demand.
Switching voltage regulators are in high demand due to their high efficiency, especially in applications with significant power requirements. They are suitable for converting different voltage levels in devices like computers, telecommunications equipment, and automotive systems. Their ability to handle higher currents, offer flexible output voltage, and maintain efficiency over a wide range of loads makes them essential in power-sensitive applications, particularly where battery life and energy savings are critical.
Analysis by End-Use Industry:
Access the comprehensive market breakdown Request Sample
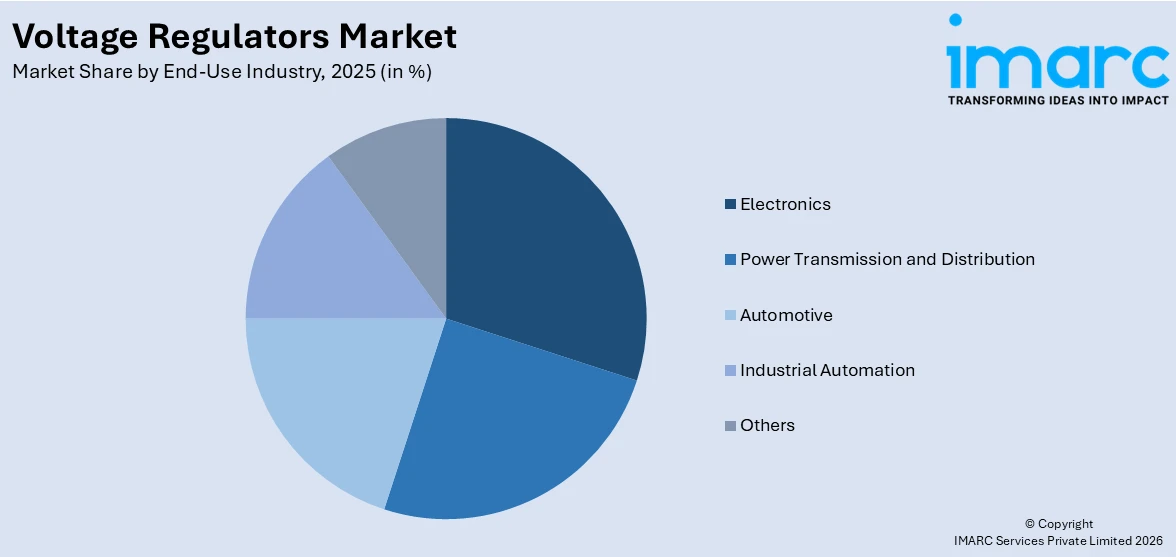
- Electronics
- Power Transmission and Distribution
- Automotive
- Industrial Automation
- Others
The demand for voltage regulators in electronics arises from the need to have stable power supply to sensitive components within devices such as smartphones, computers, and home appliances. Voltage regulators prevent damage from power fluctuations, ensuring reliable operation and longevity of electronic devices, which is crucial as consumer reliance on technology increases.
Voltage regulators are a must in power transmission and distribution for maintaining constant voltage levels throughout the grid. They help prevent power surges and drops, thereby ensuring stable and efficient electricity delivery. The integration of renewable energy sources and modernization of aging infrastructure are further reasons why reliable voltage regulation is necessary.
Voltage regulators are thus the demand of the automotive sector because of their increased complexity in electrical systems for modern vehicles, and especially in light of electric vehicles. The regulation of power supplies by voltage regulators ensures the performance and safety of automotive electronics from infotainment systems to advanced driver-assistance systems, such as EV battery power distribution.
Voltage regulators are a significant part of industrial automation. They ensure the stability of machinery and equipment operation in an industry and prevent interruptions to automated processes. The growing demands of Industry 4.0 and the incorporation of smart manufacturing technologies raise the demand for stable voltage regulation in the pursuit of greater productivity and lesser downtime.
Regional Analysis:
- North America
- United States
- Canada
- Asia Pacific
- China
- Japan
- India
- South Korea
- Australia
- Indonesia
- Others
- Europe
- Germany
- France
- United Kingdom
- Italy
- Spain
- Russia
- Others
- Latin America
- Brazil
- Mexico
- Others
- Middle East and Africa
According to the report, Asia Pacific represents the largest regional market for voltage regulators. The market in Asia Pacific is driven by rapid industrialization and urbanization, leading to increased demand for stable power supplies. According to UN-Habitat, 54% of the global urban population, more than 2.2 billion people, live in Asia. By 2050, the urban population in Asia is expected to grow by 50% an additional 1.2 billion people, which exemplifies the imminent need for uninterrupted power supply in the region. Additionally, the growing automotive industry, especially in electric vehicles, and expanding infrastructure projects further propel the voltage regulators market growth across the region. The region's booming electronics manufacturing sector and the widespread adoption of renewable energy sources necessitate efficient voltage regulation. The market witnesses significant contributions from emerging players in Asia-Pacific, leveraging cost-effective manufacturing and expanding product portfolios to gain voltage regulators market share. For example, Toshiba Electronic Devices & Storage Corporation, a leader in the Asia Pacific electronics sector, introduced the TCR1HF series of LDO regulators in May 2023. These regulators offer the lowest stand-by current consumption in the industry, high voltages, and a broad input voltage range. Such significant product launch proves critical for the market growth in the Asia Pacific region, which, in turn, aids in creating a positive voltage regulators market outlook.
Key Regional Takeaways:
North America Voltage Regulators Market Analysis
The North American voltage regulators market is experiencing substantial growth due to several key factors. The expansion of the automotive industry, particularly the rise of electric vehicles (EVs), is a significant driver. EVs require stable and efficient power management to ensure optimal performance and protect sensitive electronic components from voltage fluctuations. As the EV market continues to grow, the demand for voltage regulators in this sector rises. Additionally, the increasing integration of renewable energy sources such as solar and wind into the power grid is creating a need for voltage regulation solutions. Renewable energy systems often produce variable power outputs, leading to voltage instability, and voltage regulators are crucial in managing these fluctuations, ensuring a reliable power supply. Furthermore, the rapid advancement of consumer electronics, including smartphones, laptops, and other smart devices, is contributing to the rising demand for voltage regulators. These devices require precise power management to maintain consistent voltage levels and enhance performance. As North America continues to focus on sustainable energy solutions, automotive advancements, and the growth of consumer electronics, the voltage regulators market is positioned for strong growth in the region.
United States Voltage Regulators Market Analysis
The growing demand for a stable and reliable power supply in commercial, industrial, and residential places is fueling the US voltage regulators market. According to reports, a steady and reliable power supply is vital to prevent the damage of equipment and power cut-offs for the over 160 million users of electricity across the United States. Over 70% of U.S. manufacturers invest in power management solutions to increase operational efficiency because industrial applications, such as manufacturing, semiconductor production, and data centres, require constant voltage levels. With the United States expected to install 29 GW of clean energy by 2025 to provide electricity to 12 million people, the shift to renewable energy is making voltage regulation more necessary to manage power generation variability. In addition, the demand for voltage regulation in charging stations is driven by the increasing number of electric cars (EVs), which is expected to reach more than 27 million units by 2030, according to industry reports. The market is also backed by government programs such as the Infrastructure Investment and Jobs Act, which allocates billions of dollars to modernize the electricity system, including the equipment used for voltage regulation. Further, advances in power electronics and smart grid technologies spur this market, facilitating superior management of voltage along with incorporation of distributed energy resources.
Europe Voltage Regulators Market Analysis
The greatest contributor driving the voltage regulators market in Europe is the expanding commercial and residential demand for stable power. With over 32 million companies covering the entire EU, data from Eurostat is to be ensured that power will be available for manufacturing lines as well as machinery and equipment generally. Since wind and sunshine are not predictable in certain periods, the challenging and ambitious renewable energy goals under the EU, that stipulate 40% of its electricity to be supplied through renewable sources by 2030, make it pertinent to have voltage regulation for the supply of electricity. Another key feature is the adoption of smart grids and IoTs into countries such as France, Germany, and UK. Smart grids help reduce the percentage of energy waste and maintain accurate voltage in real-time. The popularity of electric vehicles in Europe is also bringing about a growing need for strong voltage control solutions since they are expected to account for around 80% of all new sedan and SUV sales by 2030, and 100% by 2035, particularly in the charging infrastructure, as per an industry report. In addition, the need to stabilize and update electrical systems is rising as Europe continues to deal with an ageing electricity grid. Voltage control is still a critical component in the pursuit of energy efficiency goals in the wake of the EU's Green Deal and the promotion of low-carbon alternatives for energy.
Asia Pacific Voltage Regulators Market Analysis
The market for voltage regulators is growing rapidly in Asia-Pacific, driven by factors such as urbanization, industrialization, and increasing use of renewable energy. China and India are taking the lead. According to World Economic Forum statistics, the industrial sector accounted for more than 70% of the total final energy consumption in China in 2020. There are more than 25,000 industrial parks in China. The demand for reliable voltage regulation systems in production facilities is increasing as companies modernize and expand. The region's shift toward renewable energy is quickening as India plans to construct 500 GW of renewable energy capacity by 2030 with the use of National Electricity Plan (Transmission). Better voltage control is in demand for the accommodation of intermittent power sources such as solar and wind. The growing number of electric vehicles (more than 49 million EVs are anticipated to be on Chinese roads by 2025) and the subsequent demand for massive EV charging infrastructure will also further boost the market for voltage regulators. In countries like South Korea and Japan, which are investing heavily in the next-generation grid technology, the increasing smart grid infrastructure also makes the need for voltage control more acute to sustain energy efficiency and dependability. Urbanization in Southeast Asia is also fueling growth as cities' increasing energy needs require dependable voltage management systems.
Latin America Voltage Regulators Market Analysis
Growth in urbanisation, industrialization, and the need for a more reliable power source are some of the primary factors driving the voltage regulators market in Latin America. According to data from the World Economic Forum, about 60% of the region's electricity is generated by renewable sources, which is double the average percentage globally. Brazil, Mexico, Chile, and Argentina are also on their way to leading the biofuels and low emission of hydrogen. The requirement of voltage regulators is increasing day-to-day as sectors like mining, automotive, and textile increase, as machinery operations need to be efficient while avoiding downtime due to variations in power. Voltage regulation is crucial for integrating intermittent hydropower and wind power into the Brazilian portfolio, given that renewable sources make up more than 83% of the energy mix as per data from International Trade Administration. The push by the region towards electrification further enhances the need to manage voltages in charge stations.
Middle East and Africa Voltage Regulators Market Analysis
The market for voltage regulators in the Middle East and Africa (MEA) region is driven by the growing demand for reliable power in metropolitan areas that are expanding quickly as well as the growing energy infrastructure. Strong voltage regulation is necessary in the Middle East to guarantee the stability of electricity supply, as nations like Saudi Arabia and the United Arab Emirates invest in significant infrastructure projects. To supplement this, there is a pressing need for voltage control owing to the ambitious Vision 2030 plan of Saudi Arabia, where the country calls upon the development of renewable projects, and by 2030, it aims for 50% of the renewable energy. Moreover, the growing urbanization of this region coupled with electrification is increasingly demanding effective management of voltages, more so in the industrial as well as construction sectors. The growing industrial sector in Africa, particularly in South Africa and Nigeria, is creating demand for more reliable power management solutions.
Competitive Landscape:
The market for voltage regulators is highly competitive, with key players including Texas Instruments, Infineon Technologies, ON Semiconductor, STMicroelectronics, and Analog Devices. These companies focus on technological advancements, product innovations, and strategic partnerships to maintain their market positions. Continuous research and development (R&D) investments and adapting to evolving consumer needs are expected to accelerate the voltage regulators market revenue generation with essential strategies for staying competitive in this dynamic market. For instance, in April 2024, STMicroelectronics announces efficient and flexible 40V industrial and automotive linear regulators. The LDH40 and LDQ40 voltage regulators from STMicroelectronics are intended for use in industrial and automotive settings. These regulators can operate with a maximum applied voltage of 40V and can be turned on with an input voltage as low as 3.3V. Additionally, they feature a low quiescent current.
The report provides a comprehensive analysis of the competitive landscape in the voltage regulators market with detailed profiles of all major companies, including:
- ABB Ltd.
- Analog Devices Inc.
- Eaton Corporation Inc.
- General Electric Company
- Howard Industries Inc.
- Infineon Technologies AG
- J. Schneider Elektrotechnik GmbH
- NXP Semiconductors NV
- Schweitzer Engineering Laboratories Inc.
- Siemens AG
- STMicroelectronics SA
- Texas Instruments Incorporated
- Toshiba Corporation.
Latest News and Developments:
Latest News and Developments:
- January 2025: SiTime launched the SiT5977 Super-TCXO, a single-chip timing solution for AI compute nodes. It features on-chip voltage regulators, enhancing synchronization, efficiency, and compact system designs.
- November 2024: Orca Semiconductor launched the OS2000 IO-Link communications transceiver, enhancing Industry 4.0 applications by enabling seamless device communication. It integrates voltage regulators, diagnostics, and surge protection.
- October 2024: Revatek launched the Altion and Altion Max alternator regulators designed for high-power battery systems. These regulators feature faster charging, universal compatibility with various battery chemistries, and the ability to manage dual battery banks.
- June 2024: Movellus introduced on-chip voltage regulator IP for SoCs and chiplets. The technology enables granular power control, reduces energy consumption, and supports dynamic voltage regulation for advanced chip designs.
- January 2024: Abracon announced the release of its new ATL-series Trans-Inductor Voltage Regulator (TLVR) inductors, designed to improve power delivery performance in high-demand applications such as data centers, electric vehicles, and AI servers. These inductors offer faster transient load responses, higher control bandwidth, and reduced costs by minimizing output capacitors. The TLVRs are now in stock and available for purchase.
- August 2024: The NP4271 series, an LDO voltage regulator with integrated watchdog timers and reset features designed for automotive applications, was introduced by Nisshinbo Micro Devices. This product improves functional safety in automobiles by operating with an input voltage range of 4.0 V to 40 V and producing output voltages of 3.3 V or 5.0 V.
- May 2024: In order to offer effective power management solutions for a range of applications, AiT Semiconductor unveiled the redesigned A6141 series, a line of low dropout voltage regulators. With an input voltage range of 3 V to 40 V and a maximum output current of 150 mA, the A6141 series, which is renowned for its low power consumption and great precision, provides improved performance.
- January 2023: A new LDO voltage regulator, the NR1600 series, was introduced by Nisshinbo Micro Devices Inc. for usage in both industrial and consumer settings. With a maximum input voltage of 5.5 V (rating: 6.5 V) and an output current of 500 mA, the NR1600 series is a common LDO voltage regulator made for a variety of uses. This product offers two different output voltage settings: an internally fixed output voltage type between 1.0 V and 3.6 V, and an adjustable output voltage type that can set an output voltage externally between 1.0 V and 4.8 V.
Voltage Regulators Market Report Scope:
| Report Features | Details |
|---|---|
| Base Year of the Analysis | 2025 |
| Historical Period | 2020-2025 |
| Forecast Period | 2026-2034 |
| Units | Billion USD |
| Scope of the Report | Exploration of Historical Trends and Market Outlook, Industry Catalysts and Challenges, Segment-Wise Historical and Future Market Assessment:
|
| Topologies Covered | Electro-Mechanical Voltage Regulation, Electronic Tap-Switching Voltage Regulation, Ferro-Resonant Voltage Regulation |
| Types Covered |
|
| End Use Industries Covered | Electronics, Power Transmission and Distribution, Automotive, Industrial Automation, Others |
| Regions Covered | Asia Pacific, Europe, North America, Latin America, Middle East and Africa |
| Countries Covered | United States, Canada, Germany, France, United Kingdom, Italy, Spain, Russia, China, Japan, India, South Korea, Australia, Indonesia, Brazil, Mexico |
| Companies Covered | ABB Ltd., Analog Devices Inc., Eaton Corporation Inc., General Electric Company, Howard Industries Inc., Infineon Technologies AG, J. Schneider Elektrotechnik GmbH, NXP Semiconductors NV, Schweitzer Engineering Laboratories Inc., Siemens AG, STMicroelectronics SA, Texas Instruments Incorporated and Toshiba Corporation. |
| Customization Scope | 10% Free Customization |
| Post-Sale Analyst Support | 10-12 Weeks |
| Delivery Format | PDF and Excel through Email (We can also provide the editable version of the report in PPT/Word format on special request) |
Key Benefits for Stakeholders:
- IMARC’s report offers a comprehensive quantitative analysis of various market segments, historical and current market trends, market forecasts, and dynamics of the voltage regulators market from 2020-2034.
- The research study provides the latest information on the market drivers, challenges, and opportunities in the global voltage regulators market.
- The study maps the leading, as well as the fastest-growing, regional markets. It further enables stakeholders to identify the key country-level markets within each region.
- Porter's Five Forces analysis assists stakeholders in assessing the impact of new entrants, competitive rivalry, supplier power, buyer power, and the threat of substitution. It helps stakeholders to analyze the level of competition within the voltage regulators industry and its attractiveness.
- Competitive landscape allows stakeholders to understand their competitive environment and provides an insight into the current positions of key players in the market.
Frequently Asked Questions About the Voltage Regulators Market Report
A voltage regulator is an electronic device or circuit designed to maintain a constant output voltage regardless of variations in the input voltage or the load conditions. Voltage regulators are essential in electrical and electronic systems to ensure stable operation of devices that require a specific voltage level.
The global voltage regulators market was valued at USD 3.2 Billion in 2025.
IMARC estimates the global voltage regulators market to exhibit a CAGR of 3.94% during 2026-2034.
The increasing demand for stable power supply in electronic devices, the widespread adoption of renewable energy systems, the expanding automotive industry needs, and the rising implementation of smart grids and advanced power distribution systems are some of the major factors propelling the growth of the market.
On a regional level, the market has been classified into North America, Asia Pacific, Europe, Latin America, and Middle East and Africa, wherein Asia Pacific currently dominates the global market.
Some of the major players in the global voltage regulators market include ABB Ltd., Analog Devices Inc., Eaton Corporation Inc., General Electric Company, Howard Industries Inc., Infineon Technologies AG, J. Schneider Elektrotechnik GmbH, NXP Semiconductors NV, Schweitzer Engineering Laboratories Inc., Siemens AG, STMicroelectronics SA, Texas Instruments Incorporated, Toshiba Corporation., etc.
Need more help?
- Speak to our experienced analysts for insights on the current market scenarios.
- Include additional segments and countries to customize the report as per your requirement.
- Gain an unparalleled competitive advantage in your domain by understanding how to utilize the report and positively impacting your operations and revenue.
- For further assistance, please connect with our analysts.
 Request Customization
 Speak to an Analyst
 Request Brochure
 Inquire Before Buying
Benefits of Customization
- Personalize this research
- Triangulate with your data
- Get data as per your format and definition
- Gain a deeper dive into a specific application, geography, customer, or competitor
- Any level of personalization
Get in Touch With Us
UNITED STATES
Phone: +1-201-971-6302
INDIA
Phone: +91-120-433-0800
UNITED KINGDOM
Phone: +44-753-714-6104
Email: [email protected]
Client Testimonials


.webp)


