
Web Application Firewall Market Size, Share, Trends and Forecast by Deployment, Organization Size, Service, End Use Industry, and Region, 2026-2034
Web Application Firewall Market Size and Share:
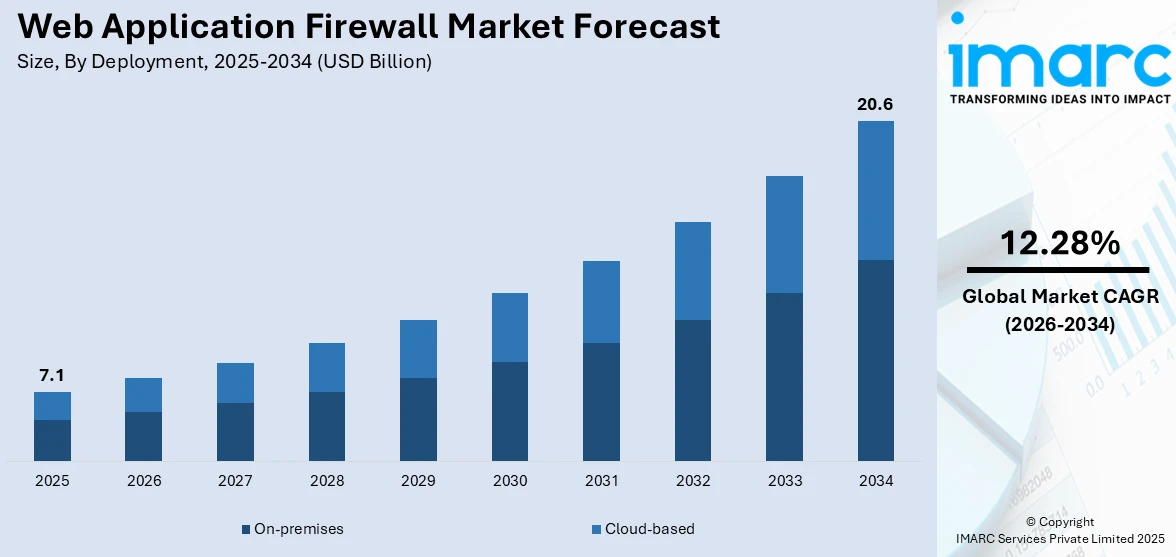
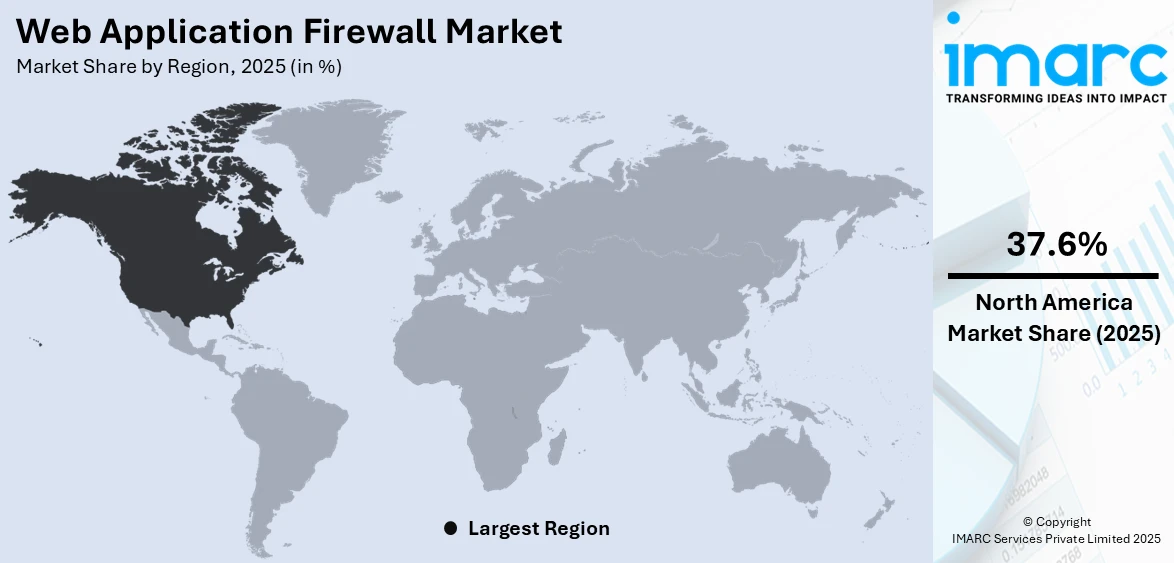
The global web application firewall market size was valued at USD 7.1 Billion in 2025. Looking forward, IMARC Group estimates the market to reach USD 20.6 Billion by 2034, exhibiting a CAGR of 12.28% during 2026-2034. North America currently dominates the market in 2025. The growing usage of WAF by many organizations for preventing malware, phishing, and security threats and advancements in the information technology (IT) infrastructure are some of the major drivers of market growth. As businesses prioritize data protection and regulatory compliance, the web application firewall market share is expected to increase significantly.
|
Report Attribute
|
Key Statistics
|
|---|---|
|
Base Year
|
2025
|
|
Forecast Years
|
2026-2034
|
|
Historical Years
|
2020-2025
|
|
Market Size in 2025
|
USD 7.1 Billion |
|
Market Forecast in 2034
|
USD 20.6 Billion |
| Market Growth Rate 2026-2034 | 12.28% |
The increasing frequency of cyberattacks is a key driver in the expansion of the market. With businesses facing a growing number of threats targeting web applications, there is an urgent need to implement advanced security measures. These attacks, ranging from SQL injections to cross-site scripting (XSS), put sensitive data and infrastructure at significant risk, making WAF solutions essential for safeguarding digital assets. Web applications, which are integral to most business operations, are increasingly vulnerable, thus escalating the demand for robust protection. For instance, as of early 2025, organizations across various sectors are reporting a significant rise in sophisticated cyberattacks. In response, the adoption of WAF solutions has been accelerating.
To get more information on this market Request Sample
The United States stands out as a key market disruptor, driven by stringent regulatory requirements that compel businesses to adopt advanced cybersecurity measures. As data breaches and privacy violations continue to gain attention, the US government has enforced stricter regulations such as the CCPA (California Consumer Privacy Act) and other state-level privacy laws, which mandate the protection of consumer data. Web Application Firewalls (WAF) are an essential component in helping organizations meet these compliance standards, offering robust protection against unauthorized access and ensuring that sensitive customer information remains secure.
Web Application Firewall Market Trends:
Increase in Hybrid Work Adoption
The rise of remote work, accelerated by the COVID-19 pandemic, has led to a sharp increase in the demand for web application firewall solutions. According to the February 2024 Remote Work and Compensation Pulse Survey, nearly 48% of employees prefer permanent remote work, and 44% favor a hybrid work model. Simultaneously, 51% of companies have adopted hybrid work, while only 5% intend to offer fully remote options long-term. This widespread shift creates new security challenges, particularly in protecting online applications. As a result, businesses are placing greater emphasis on endpoint security to safeguard remote work environments, driving the demand for WAF solutions. In response to these needs, Akamai Technologies introduced its Prolexic Network Cloud Firewall in April 2023, providing enhanced access control management and stronger protection against DDoS attacks. This development marks a crucial step in addressing the evolving security demands of organizations. These changes are expected to fuel further growth in the WAF market, as businesses continue to embrace and adapt to hybrid work models.
Rising Cyberattack Incidences
The increasing concerns about data privacy and rising cyberthreats are key factors driving the web application firewall market growth. The surge in data breaches further amplifies the need for advanced security solutions. A report by Forbes highlighted that in 2023, over 353 Million people were affected by data breaches. Governments around the world are imposing stricter regulations like the General Data Protection Regulation (GDPR) and the California Consumer Privacy Act (CCPA) that mandate that organizations have robust data management practices in place. GDPR offenses in 2023 cost companies like Meta, TikTok, and X (formerly Twitter) more than USD 3 Billion. This regulatory push, along with rising data privacy concerns, has made WAF solutions essential for companies aiming to ensure compliance and protect their digital infrastructure. Notably, PCI-DSS regulations, a crucial security standard, also support the adoption of WAF. As organizations seek to improve data governance and comply with evolving laws, the demand for WAF solutions continues to drive the market forward.
Adoption of Cloud-based WAF Solutions
Cloud-based web application firewalls are gaining traction for their ability to protect against threats like malware, phishing, ransomware, and other cyber risks. These solutions offer enhanced security even when users are disconnected from a VPN, ensuring more comprehensive protection. The rising demand for cost-effective, scalable data management solutions is further driving the WAF market’s expansion. In particular, cloud adoption in North America is accelerating, with around 80% of organizations adopting cloud strategies to modernize and integrate intelligent features into their applications, as reported by the Cloud Security Alliance. In response to this trend, companies are increasingly investing in research and development to create more resilient and efficient cloud-based WAF solutions. A key example of innovation in this space is SecureIQLab’s release of WAF 3.0 testing platform in June 2023. This platform introduces new API security testing, offering vendors insights into the strength of their security measures and operational efficiency. Such innovations are expected to continue driving the WAF market forward, with cloud-based solutions playing a pivotal role in shaping its future.
Web Application Firewall Industry Segmentation:
IMARC Group provides an analysis of the key trends in each segment of the global web application firewall market, along with forecasts at the global, regional, and country levels from 2026-2034. The market has been categorized based on deployment, organization size, service, and end use industry.
Analysis by Deployment:
- Cloud-based
- On-premises
In 2025, the on-premises segment led the web application firewall market, driven by organizations' preference for maintaining control over their security infrastructure. Many businesses, especially large enterprises, prefer on-premises solutions as they provide enhanced security, greater customization, and more direct management of their IT environment. On-premises WAFs allow organizations to configure and control their security policies in a way that aligns with their specific business needs, offering a higher level of data privacy and protection. The ability to integrate seamlessly with existing internal networks and the desire to comply with strict industry regulations further contribute to the dominance of this segment. Additionally, concerns over data sovereignty and security risks related to cloud-based solutions have made on-premises WAFs the preferred choice for industries requiring high levels of protection for sensitive data.
Analysis by Organization Size:
- Large Enterprises
- Small and Medium Enterprises
In 2025, the large enterprises segment led the web application firewall market, driven by the increasing need for robust security solutions to protect vast digital infrastructures. Large enterprises often face heightened cyber threats due to their expansive operations, diverse customer bases, and vast amounts of sensitive data. As digital transformation accelerates, organizations in this category require comprehensive WAF solutions to defend against evolving cyberattacks. WAFs provide the necessary layers of security to protect web applications, ensuring business continuity and compliance with industry regulations. Large enterprises also have the financial resources to implement and maintain high-end security solutions, contributing to their dominance in the WAF market. Moreover, the increasing use of e-commerce, mobile applications, and cloud technologies within large organizations is further driving demand for reliable, scalable, and flexible WAF solutions to mitigate the risk of data breaches.
Analysis by Service:
- Professional services
- Managed services
In 2025, the professional services segment led the web application firewall market, driven by the increasing adoption of digital platforms by service-based organizations. As professional service firms, including consulting, IT, and legal services, move toward cloud computing and digital transformation, they require reliable cybersecurity solutions to protect sensitive client data. WAFs offer these businesses essential protection against the growing number of web-based attacks, ensuring that their web applications are secure and compliant with industry regulations. The need to safeguard this data while maintaining seamless online services has made WAF solutions critical for professional service providers. Additionally, with increasing reliance on third-party vendors and cloud services, the need for strong perimeter security has amplified, driving the demand for WAFs in this sector.
Analysis by End Use Industry:
Access the comprehensive market breakdown Request Sample
- Government and Defense
- BFSI
- Retail
- Healthcare
- IT and Telecom
- Energy and Utilities
- Manufacturing
- Others
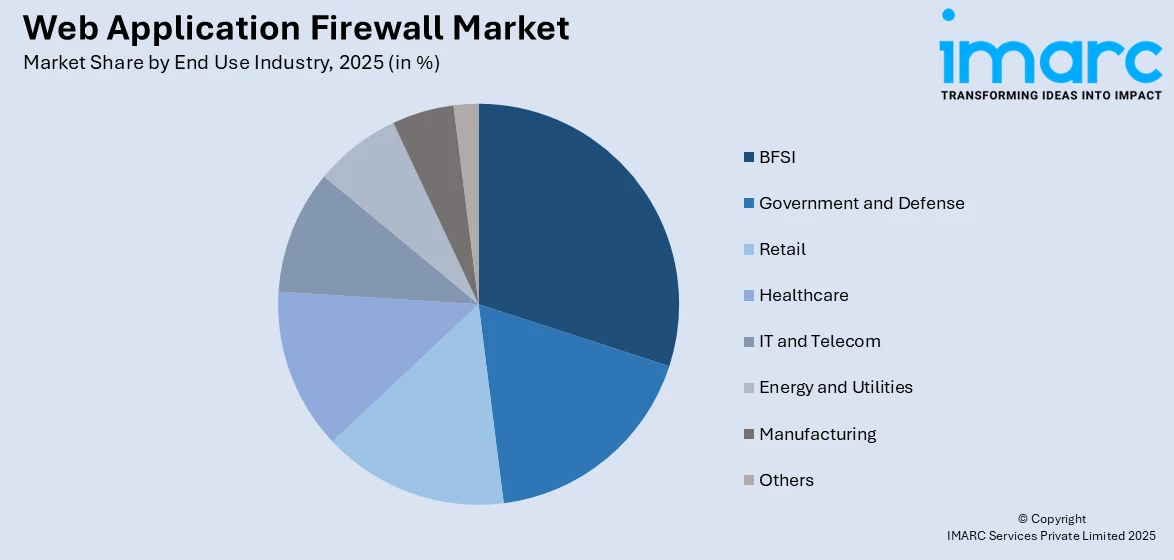
In 2025, the BFSI sector led the web application firewall market, driven by the industry's need to protect highly sensitive customer data and comply with strict regulations. Financial institutions are frequent targets of cyberattacks, such as phishing, fraud, and data breaches, due to the valuable nature of the data they handle. WAFs provide essential layers of security by defending against attacks targeting web applications, safeguarding financial transactions, and ensuring that personal and corporate data is protected. The increasing digitization of banking services, mobile banking applications, and online insurance platforms further exacerbates the demand for robust security solutions. As regulations around data privacy and security become stricter worldwide, including the implementation of GDPR and other financial compliance standards, WAF solutions are being adopted at an accelerated rate in the BFSI sector to avoid costly breaches and fines. This trend is expected to continue as the sector expands its digital services.
Regional Analysis:
To get more information on the regional analysis of this market Request Sample
- North America
- United States
- Canada
- Asia Pacific
- China
- Japan
- India
- South Korea
- Australia
- Indonesia
- Others
- Europe
- Germany
- France
- United Kingdom
- Italy
- Spain
- Russia
- Others
- Latin America
- Brazil
- Mexico
- Others
- Middle East and Africa
In 2025, North America led the web application firewall market driven by the region's rapid digital transformation and the increasing number of cyberattacks targeting enterprises. As the home to numerous large enterprises, financial institutions, and government agencies, North America experiences a high volume of cyber threats, making the implementation of WAF solutions critical for safeguarding web applications. The increasing demand for secure online services, coupled with stringent data protection regulations like CCPA and GDPR, has pushed organizations in the region to prioritize cybersecurity. Additionally, the rapid adoption of cloud technologies, e-commerce platforms, and mobile applications across industries in North America is further driving the demand for WAFs. The region's well-established cybersecurity infrastructure, availability of advanced technologies, and strong focus on data privacy contribute to North America's dominance in the WAF market. As cyber threats continue to evolve, businesses in North America are increasingly investing in WAF solutions to protect sensitive data, comply with regulatory standards, and ensure business continuity.
Key Regional Takeaways:
United States Web Application Firewall Market Analysis
The US web application firewall market is primarily driven by the increasing deployment of cloud-native applications that require enhanced application-layer security. With the rise in zero-day vulnerabilities and bot attacks, there is a growing need for real-time protection. The introduction of updated regulatory frameworks like PCI DSS 4.0, mandating application-level security, is further pushing market growth. Moreover, the expansion of digital financial services and e-commerce platforms has raised the need for stronger WAF solutions to manage heightened risk exposure. A recent survey by the American Bankers Association showed that 55% of customers use mobile apps for digital banking, which further intensifies security demands. The evolving complexity of hybrid and multi-cloud architectures also demands adaptive security tools, fostering WAF market expansion. Furthermore, the integration of AI and machine learning for behavioral threat detection is enhancing detection accuracy, further driving adoption. Additionally, the increased use of APIs and microservices to create dynamic security rules has significantly expanded the relevance of WAF solutions. Federal cybersecurity funding aimed at protecting critical digital infrastructure is also positively influencing the web application firewall market outlook.
Europe Web Application Firewall Market Analysis
The European web application firewall market is witnessing growth due to the implementation of regulations such as GDPR and NIS2, which compel organizations to enhance their application-layer defenses. The growing adoption of WAF solutions in the fintech and digital health sectors, where safeguarding sensitive data is crucial, is further fueling the market. The rise in ransomware and cross-site scripting attacks has led to an increasing demand for automated, AI-powered protection tools. According to the 2024 UK Government Cyber Security Breaches Survey, 50% of UK businesses reported cyberattacks, a significant rise from 39% in 2022, indicating growing risks. Additionally, the reliance on WAF solutions to secure government portals and citizen services as part of national digitalization efforts is further driving market demand. National cybersecurity strategies across European countries are encouraging increased investment in WAF technologies, making them more accessible to organizations. The transition to cloud platforms by SMEs and large enterprises requiring scalable security solutions is also a significant driver of growth. Furthermore, the rise of managed security services that incorporate WAF features is presenting new market opportunities.
Asia Pacific Web Application Firewall Market Analysis
The Asia Pacific web application firewall market is driven by the rapid expansion of e-commerce and digital payment platforms that require enhanced protection from cyber threats. Increased use of WAF solutions by government agencies and enterprises in response to national cybersecurity regulations is boosting market adoption. Moreover, the rise in credential stuffing and API-based attacks has highlighted the need for real-time protection, further increasing market demand. The rapidly growing SaaS and startup ecosystem in the region, particularly in India, is pushing the demand for scalable, cloud-native WAF solutions. As of December 2024, India was the third-largest startup hub globally, with over 1.57 lakh certifications issued by DPIIT. Additionally, digital transformation across the healthcare and education sectors is driving secure access to online services, thereby expanding the market. The ongoing growth of data centers in the region further necessitates robust application protection, propelling the demand for WAFs. The region’s increasing reliance on digital technologies across various sectors is providing significant momentum to the market.
Latin America Web Application Firewall Market Analysis
The Latin American web application firewall market is expanding due to the rapid digitalization of public services and e-governance platforms, which require stronger web security infrastructure. The increasing frequency of ransomware and DDoS attacks, particularly in the financial and healthcare sectors, is driving the adoption of proactive application-layer protection. According to the 2024 Brazil Threat Landscape Report, the country faced 248 ransomware attacks, with a large DDoS attack reaching 4 Tbps. These incidents highlight the rising need for robust cybersecurity solutions in the region. Additionally, the growing adoption of cloud solutions by mid-sized enterprises seeking cost-effective, scalable security is fueling market growth. Increasing regulatory pressure regarding cross-border data protection in countries like Brazil and Mexico, which mandates enhanced application-level security, is also expanding market opportunities. The demand for WAF solutions is expected to continue growing as more organizations recognize the importance of cybersecurity in maintaining data privacy and ensuring business continuity in an increasingly digital environment.
Middle East and Africa Web Application Firewall Market Analysis
The web application firewall market in the Middle East and Africa is significantly influenced by the region’s rapid digital transformation, particularly in the government and financial sectors. Initiatives like the UAE's digital transformation efforts, aimed at attracting 260 global fintech companies and 180 Million new customers, are pushing for the adoption of advanced cybersecurity frameworks, including WAFs. The growing focus on e-governance and smart city projects in countries like Saudi Arabia is further driving demand for scalable, agile WAF solutions. Additionally, the increasing use of cloud-native applications and microservices across industries is creating a need for security tools that can support these technologies. National programs promoting cybersecurity and the safeguarding of critical infrastructure in the region are encouraging enterprises to invest in web application firewalls. With heightened concerns over application-layer attacks, more organizations are turning to WAF solutions to protect sensitive data and ensure the security of digital platforms. As digital services continue to grow, the demand for WAFs in the Middle East and Africa is expected to rise.
Competitive Landscape:
Ongoing advancements in web application firewall (WAF) technology, security protocols, and integration strategies are driving growth in the WAF market. Companies in the sector are prioritizing improvements in system performance, scalability, and real-time threat detection to enhance protection and reduce vulnerabilities. Firms compete by offering high-performance, adaptive security solutions with advanced automation, machine learning-driven threat analysis, and scalable capabilities tailored to various industrial and commercial needs. Strategic partnerships, global market expansion, and focused product innovation are accelerating WAF adoption. According to web application firewall market forecast, demand is expected to rise as industries and organizations emphasize cybersecurity, cloud migration, and regulatory compliance, spurring increased investment in innovative solutions, seamless integration, and user-centric security models.
The report provides a comprehensive analysis of the competitive landscape in the web application firewall market with detailed profiles of all major companies, including:
- Akamai Technologies Inc.
- Applicure Technology Ltd.
- Barracuda Networks Inc.
- Citrix Systems Inc.
- Cloudflare Inc.
- Ergon Informatik AG
- F5 Networks Inc.
- Fortinet Inc.
- Imperva Inc.
- Nsfocus Information Technology Co. Ltd.
- Penta Security Systems Inc. (Finleap)
- Qualys Inc.
- Radware Ltd.
Latest News and Developments:
- April 2025: Akamai launched Firewall for AI, a specialized Web Application Firewall (WAF) that secured AI applications from adversarial inputs, data scraping, and model exploitation. It offers multilayered protection, real-time AI threat detection, compliance support, and flexible deployment, addressing security gaps that traditional WAFs cannot manage in AI-driven environments.
- March 2025: Progress introduced WAF functionality to its MOVEit Cloud managed file transfer solution. The WAF enhances security by blocking malicious HTTPS traffic, supports PCI DSS 4.0 compliance, automates updates, and offers 24/7 monitoring, ensuring secure, compliant, and streamlined file transfers for sensitive data.
- February 2025: A10 Networks acquired ThreatX Protect to enhance its cybersecurity portfolio with a Web Application and API Protection (WAAP) solution. The platform includes next-gen WAF, API protection, and bot management, addressing evolving threats across hybrid environments and supporting security for AI applications and critical enterprise systems.
- February 2025: Harness and Traceable merged to form a unified DevSecOps platform, combining software delivery and application security. The integration strengthens API protection and WAF capabilities, offering AI-native, end-to-end secure software deployment and real-time threat defense within a single, scalable infrastructure platform.
- December 2024: Penta Security launched Cloudbric WMS, a managed WAF service for AWS Marketplace. The service enhances AWS WAF by offering expert-optimized security rules, real-time monitoring, and configuration via a dedicated console, leveraging Penta’s proven WAPPLES WAF technology to simplify cloud cybersecurity for users.
- June 2024: Check Point launched CloudGuard WAF-as-a-Service (WAFaaS), an AI-powered, fully managed web application firewall. Designed for cloud applications and APIs, it offers zero-day threat prevention, bot defense, DDoS protection, and rapid deployment, easing WAF management while enhancing security through automation and contextual threat analysis.
Web Application Firewall Market Report Scope:
| Report Features | Details |
|---|---|
| Base Year of the Analysis | 2025 |
| Historical Period | 2020-2025 |
| Forecast Period | 2026-2034 |
| Units | Billion USD |
| Scope of the Report |
Exploration of Historical Trends and Market Outlook, Industry Catalysts and Challenges, Segment-Wise Historical and Future Market Assessment:
|
| Deployments Covered | Cloud-based, On-premises |
| Organization Sizes Covered | Large Enterprises, Small and Medium Enterprises |
| Services Covered | Professional services, Managed services |
| End Use Industries Covered | Government and Defense, BFSI, Retail, Healthcare, IT and Telecom, Energy and Utilities, Manufacturing, Others |
| Regions Covered | Asia Pacific, Europe, North America, Latin America, Middle East and Africa |
| Countries Covered | United States, Canada, Germany, France, United Kingdom, Italy, Spain, Russia, China, Japan, India, South Korea, Australia, Indonesia, Brazil, Mexico |
| Companies Covered | Akamai Technologies Inc., Applicure Technology Ltd., Barracuda Networks Inc., Citrix Systems Inc., Cloudflare Inc., Ergon Informatik AG, F5 Networks Inc., Fortinet Inc., Imperva Inc., Nsfocus Information Technology Co. Ltd., Penta Security Systems Inc. (Finleap), Qualys Inc., Radware Ltd. etc. |
| Customization Scope | 10% Free Customization |
| Post-Sale Analyst Support | 10-12 Weeks |
| Delivery Format | PDF and Excel through Email (We can also provide the editable version of the report in PPT/Word format on special request) |
Key Benefits for Stakeholders:
- IMARC’s report offers a comprehensive quantitative analysis of various market segments, historical and current market trends, market forecasts, and dynamics of the web application firewall market from 2020-2034.
- The research study provides the latest information on the market drivers, challenges, and opportunities in the global web application firewall market.
- The study maps the leading, as well as the fastest-growing, regional markets. It further enables stakeholders to identify the key country-level markets within each region.
- Porter's five forces analysis assist stakeholders in assessing the impact of new entrants, competitive rivalry, supplier power, buyer power, and the threat of substitution. It helps stakeholders to analyze the level of competition within the web application firewall industry and its attractiveness.
- Competitive landscape allows stakeholders to understand their competitive environment and provides an insight into the current positions of key players in the market.
Frequently Asked Questions About the Web Application Firewall Market Report
The web application firewall market was valued at USD 7.1 Billion in 2025.
The web application firewall market is projected to exhibit a CAGR of 12.28% during 2026-2034, reaching a value of USD 20.6 Billion by 2034.
Key factors driving the web application firewall market include the increasing frequency of cyberattacks, the rising need for data protection, regulatory compliance requirements, digital transformation across industries, and the growing adoption of cloud and web-based applications. These elements fuel the demand for robust cybersecurity solutions.
In 2025, North America dominated the web application firewall market, driven by the rapid digital transformation across industries, increasing cyber threats, and stringent data protection regulations like CCPA and GDPR. The region's focus on robust cybersecurity infrastructure and advanced technologies further fueled the market’s growth.
Some of the major players in the global web application firewall market include Akamai Technologies Inc., Applicure Technology Ltd., Barracuda Networks Inc., Citrix Systems Inc., Cloudflare Inc., Ergon Informatik AG, F5 Networks Inc., Fortinet Inc., Imperva Inc., Nsfocus Information Technology Co. Ltd., Penta Security Systems Inc. (Finleap), Qualys Inc., Radware Ltd. etc.
Need more help?
- Speak to our experienced analysts for insights on the current market scenarios.
- Include additional segments and countries to customize the report as per your requirement.
- Gain an unparalleled competitive advantage in your domain by understanding how to utilize the report and positively impacting your operations and revenue.
- For further assistance, please connect with our analysts.
 Request Customization
 Speak to an Analyst
 Request Brochure
 Inquire Before Buying
Benefits of Customization
- Personalize this research
- Triangulate with your data
- Get data as per your format and definition
- Gain a deeper dive into a specific application, geography, customer, or competitor
- Any level of personalization
Get in Touch With Us
UNITED STATES
Phone: +1-201-971-6302
INDIA
Phone: +91-120-433-0800
UNITED KINGDOM
Phone: +44-753-714-6104
Email: [email protected]
Client Testimonials


.webp)


