
Whole Milk Powder Market Size, Share, Trends and Forecast by End Use, and Country, 2026-2034
Whole Milk Powder Market 2025, Size and Trends:
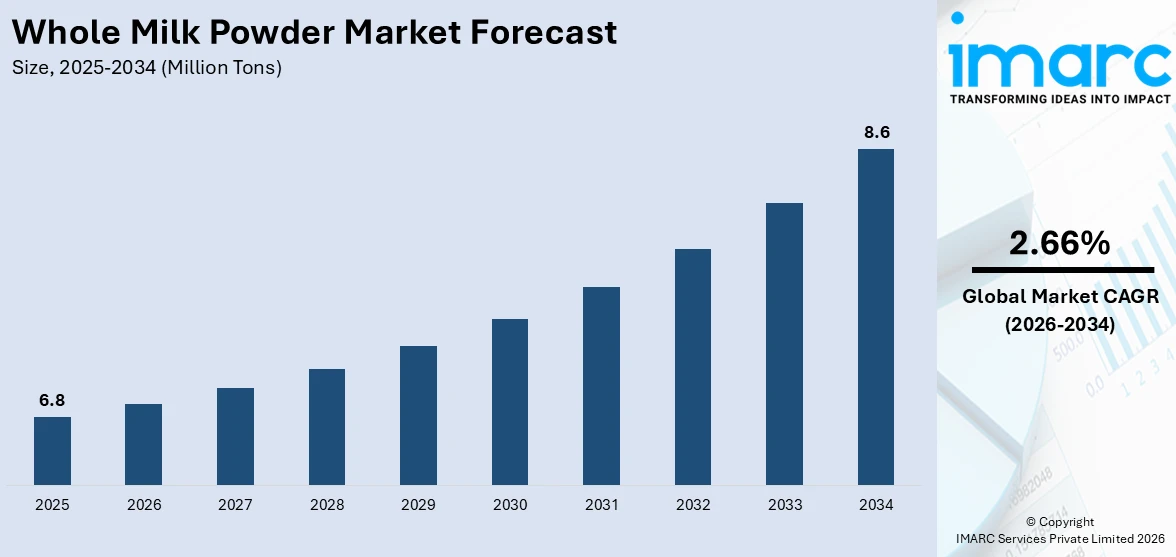
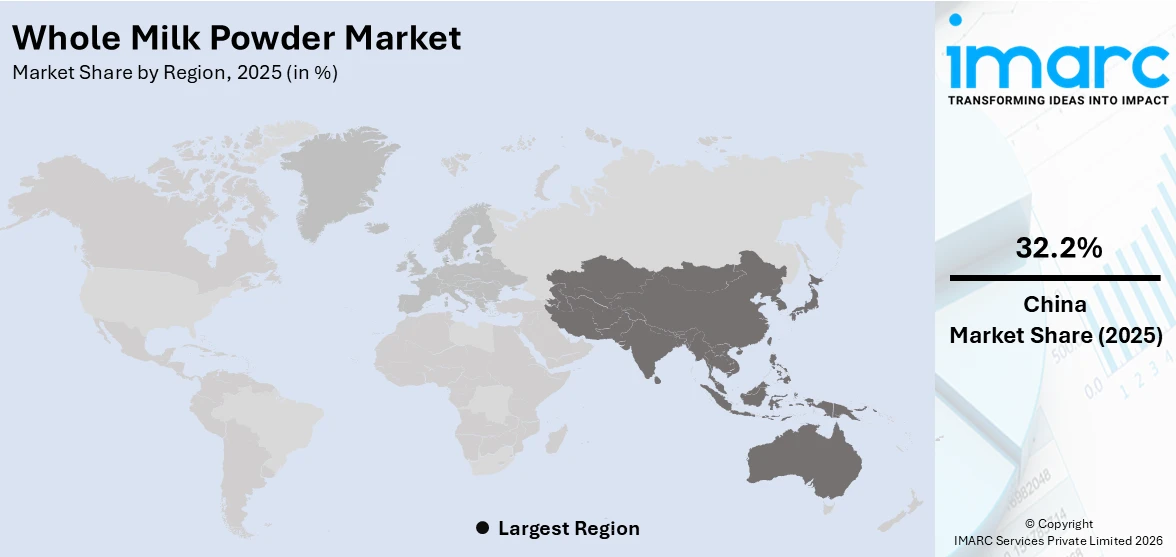
The global whole milk powder market size was valued at 6.8 Million Tons in 2025. Looking forward, IMARC Group estimates the market to reach 8.6 Million Tons by 2034, exhibiting a CAGR of 2.66% from 2026-2034. China currently dominates the market, holding a market share of over 32.2% in 2025. The whole milk powder market share is increasing due to rising dairy demand, convenience food preferences, health consciousness, expanding food and beverage industries, increasing disposable incomes and population expansion, especially in emerging economies.
|
Report Attribute
|
Key Statistics
|
|---|---|
|
Base Year
|
2025
|
|
Forecast Years
|
2026-2034
|
|
Historical Years
|
2020-2025
|
|
Market Size in 2025
|
6.8 Million Tons |
|
Market Forecast in 2034
|
8.6 Million Tons |
| Market Growth Rate (2026-2034) | 2.66% |
The whole milk powder market growth is attributed to the increasing demand for dairy products worldwide, especially in regions such as Asia-Pacific, Africa, and the Middle East, is a significant driver. As income levels rise, particularly in emerging economies, more consumers are opting for dairy-based products, which contributes to the market's expansion. Increased awareness about the benefits of dairy as a source of nutrition, especially for proteins, calcium, and vitamins, is another driver of growth. Whole milk powder has made its way into extensive use in processed foods, confectionery, and beverages, as these categories are seeing significant growth all over. The increasing demand for infant formula, which is usually prepared with whole milk powder due to its nutritional content, is another key factor driving the market. The changing food service and bakery industries are also increasingly using whole milk powder in their products to give them a better taste and texture. Technological advancements in dairy processing, along with the adoption of e-commerce platforms for distribution, will further support the growth trajectory of the market.
To get more information on this market Request Sample
The United States emerged as a key regional market for whole milk powder, driven by the rising demand for dairy-based products among consumers. Health-conscious consumers are seeking milk powder due to its high nutritional value, which includes essential vitamins, proteins, and minerals. The more that people learn about these benefits, the more WMP becomes a preferred ingredient in several food and beverage applications, including infant formula, snacks, and baked goods. Convenience and longer shelf life are additional advantages of whole milk powder, thus increasing preference among consumers seeking storage-friendly dairy products. Demand from the food service industry, especially for bakery products and ready-to-eat meals, is also growing rapidly. Increasing trends in e-commerce have made WMP easier and more accessible to a wider population as well. The market is competitive with numerous domestic and international players, and still, the USA remains the core market on account of robust dairy products and progressive processing technologies.
Whole Milk Powder Market Trends:
Increasing demand in emerging economies
Emerging economies are witnessing increased whole milk powder demand, primarily due to rapid urbanization and increased disposable incomes. In regions like Asia-Pacific and Africa, populations are growing, and consumers are getting more familiar with Western diets that are increasingly based on dairy products. One benefit of whole milk powder is that it has a long shelf life and is very easy to transport. Hence, it is quite appealing to the consumer and the manufacturers. Countries like India and China are a major driver for this growth. The dairy industry in Kenya is also growing rapidly. Milk purchases by processors increased by 19.2% in the first half of 2024 to 437.7 Million Liters from 367.1 Million Liters in the same period last year. This growth is attributed to favorable weather conditions and a decline in dairy input costs. The average price of 100 liters of milk was reported to have shot up to KES 5,083 in the last year, a growth of 7.6%. However, the demand for dairy products in Kenya is still at a high level. Therefore, the country relies on imports, mostly from Uganda. The expansion in population and changing dietary habits are some of the reasons fueling the growing demand for dairy products, including whole milk powder in emerging markets. The urban population in these countries is increasingly looking for quick and nutritious food options. The growth of the retail sector, especially e-commerce, is enabling rural customers to access a variety of dairy products, thereby spurring demand for whole milk powder in the near term. Poor economic conditions in these regions during the earlier phases of development and prospects of a rising middle class are likely to retain this trend.
Growing health awareness
Health-conscious consumers are specifically looking for nutrient-rich foods, so the high nutritional profile of whole milk powder makes it a good choice. The powder will contain essential nutrients such as protein, calcium, vitamins A and D, and healthy fats that make it essential for general health, strength of bone, and maintenance of muscle. The health benefits of dairy products have recently become better known so the portion of whole milk powder has nowadays become part and parcel of the diet of the consumer. The USDA indicates an increase of 7 pounds of dairy consumption per capita in the United States during 2023, further establishing the rise of dairy consumption in the market. Increased interest in health and wellness trends such as clean-label and natural products provides an opportunity for manufacturers to promote whole milk powder as a wholesome, natural food. Its use as a fortificant for other food and beverage products, such as infant formula, meal replacements, and protein supplements, is also expanding. According to the industry reports, this health-based demand will significantly drive market growth, as consumers are now more inclined toward balanced and nutrient-rich diets.
Technological advancements in production
Technical and technological advancements regarding milk powder have had a positive impact and, to a high extent, shaped whole milk powder market trends, mainly as they enhance the quality of the products while also being productive, elevating low costs. Key advancements involved spraying drying technologies by ensuring to take as many micronutrients present during milk preparation along with achieving efficient dissolution within aqueous environments after processing the powdery nature. Packaging technology has continued to advance further in helping prolong the shelf life of whole milk powder, so it remains fresh and does not spoil during transport and storage. The manufacturing processes have also become more cost-effective, allowing the producer to take advantage of a growing demand within both developed and emerging markets. Moreover, quality control systems are deployed to ensure greater product quality and meet the confidence demands between the consumer and the producer. These new technologies enable companies to offer consumers a more secure, high-grade product, making consumers more confident and further opening the markets. Technological developments in producing whole milk powder are therefore another important driver behind the market movement.
Whole Milk Powder Industry Segmentation:
IMARC Group provides an analysis of the key trends in each segment of the global whole milk powder market, along with forecast at the global, regional, and country levels from 2026-2034. The market has been categorized based on end use.
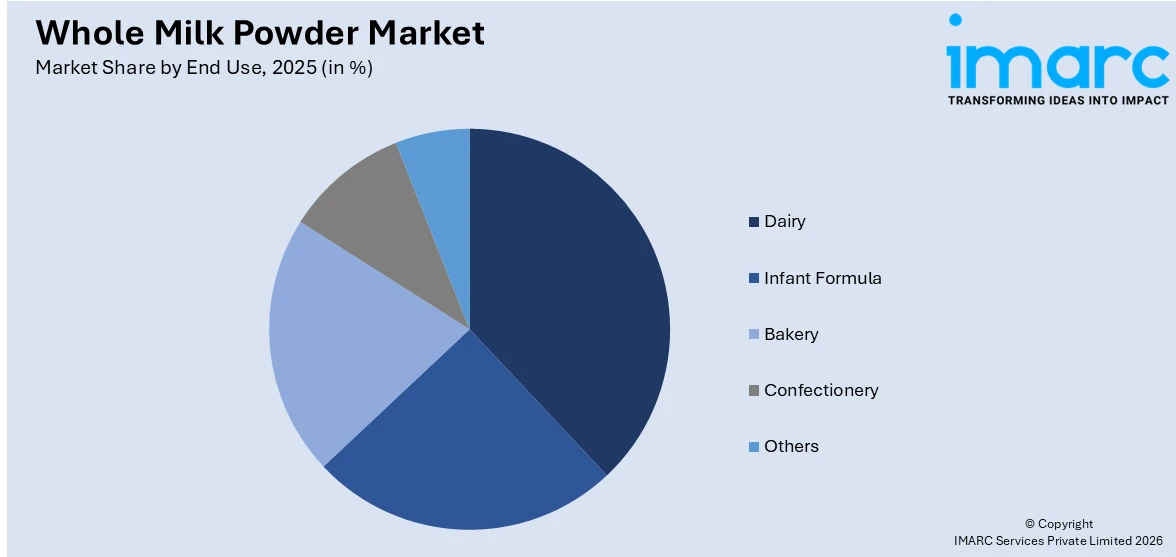
Analysis by End Use:
Access the comprehensive market breakdown Request Sample
- Dairy
- Infant Formula
- Bakery
- Confectionery
- Others
Dairy dominates the market with a significant share of 54.6%. This dominance is on account of the spread across milk beverages, cheese, yogurts, and butter in various dairy products, whose consumption is on the rise. The growing need among consumers for dairy-based products, which contain sources of proteins, calcium, and vitamins, pushes the demand for whole milk powder. The convenience and longer shelf life of milk powder make it an ideal ingredient for manufacturers in the dairy industry. The rising trend toward the consumption of ready-to-eat meals, smoothies, and dairy snacks further bolsters the segment's growth. With a strong global dairy market, especially in emerging economies, the dairy sector continues as the leading end-use segment in the whole milk powder market, contributing to significant market share and growth potential.
Country Analysis:
To get more information on the regional analysis of this market Request Sample
- New Zealand
- China
- European Union
- Brazil
- Argentina
- Others
China holds the largest market share for whole milk powder with a share of 32.2% due to its growing demand for dairy products, particularly infant formula. Its middle-class population is expanding rapidly. Thus, elevated disposable income and increased urbanization are causing consumers in the country to take up dairy-based products more frequently. The large population base ensures high demand levels for milk powder, both locally and as imports. China’s growing health-conscious population is driving the demand for milk powder for various applications, including nutritional supplements and dairy beverages. Additionally, China’s shift toward more nutritious and premium dairy products strengthens the demand for whole milk powder. Infant formula, made from high-quality milk powder, is a major driver of the market, supported by both domestic production and international imports.
Key Regional Takeaways:
New Zealand Whole Milk Powder Market Analysis
The whole milk powder market in New Zealand is quite strong, and this is supported by good agricultural practices and the global demand for the product. According to USDA, in 2023, New Zealand produced about 1.53 Million Metric Tons of WMP. This was up by about 2% from 2022. The dairy sector of New Zealand enjoys a conducive climate, good-quality milk production, and solid trade agreements with Asia. The industry is very competitive, with Fonterra dominating this sector; it exports to countries in Asia and the Middle East. It also makes production more efficient through technological and sustainable practices, strengthening New Zealand's status as a global leader.
China Whole Milk Powder Market Analysis
China is one of the biggest consumers of whole milk powder in the world. Its consumption is driven by the increase in the middle class and the growing health-conscious consumers. Industrial reports have highlighted that the rise in domestic milk production increased the production of milk powder significantly in China during 2023. China produced approximately 41 Million Tons of milk in the same year. Initiatives from the government in the development of the local dairy industry to maximize the utilization of domestic supplies also complement the market. International brands, including Nestlé and Yili Group, have remained at the forefront in penetrating the market through the enhancement of product quality and nutritional content. There has also been a rise in demand for imported dairy products in China. There has been a high demand for whole milk powder, especially for infant formula.
European Union Whole Milk Powder Market Analysis
Whole milk powder in the European Union has depended largely on domestic production and solid export activities. According to the European Commission, the EU produced around 160.8 million metric tons of milk in 2023, with the majority being devoted to whole milk powder, mostly from countries like France, Germany, and the Netherlands. The estimated production of whole milk powder for the European Union was 594,000 Metric Tons by 2033, according to industrial reports. The export of the EU is also impressive, especially toward developing markets in Asia and Africa. As demand for dairy products increases, so does the focus on sustainability and quality standards. The EU's Common Agricultural Policy (CAP) has been supportive of eco-friendly practices in milk production. The presence of major players like Lactalis and Arla Foods ensures market stability and innovations in packaging and processing technologies cater to the diverse preferences of consumers.
Brazil Whole Milk Powder Market Analysis
Domestic and export demands increase Brazil's whole milk powder market. There are exports mostly in neighboring countries and parts of Asia. As revealed by data coming from the USDA Foreign Agricultural Service, in 2023, Brazil was ranked as one of the biggest milk powder-producing countries in the world, having an output of approximately 566,000 Metric Tons, representing almost 13% of global milk powder production. These features make the country an export-friendly country, favorable climate, large dairy farms, and low production cost. The trade between MERCOSUR and the ever-growing dairy intake in Brazil from urbanization and an expanded middle class contributes to that. Vigor Alimentos, Itambé, and other dairy powerhouses are engaged in expanding market shares in the internal and overseas markets.
Argentina Whole Milk Powder Market Analysis
Argentina's dairy powder, especially whole milk powder, exports have highly risen in Latin America and Asia. An industrial report reveals that in the year 2023, Argentina manufactured 150,000 Metric Tons of milk powder and whey. Argentina possesses a massive agricultural land and a well-developed dairy infrastructure. International demand, mainly from China and the Middle East, has been pushing Argentina further to become one of the world's largest exporters of dairy. Argentine dairy production has upgraded, becoming more efficient while being able to meet the quality standards of the international market. SanCor and La Serenísima have been two of its spearheading companies in both production and distribution.

Competitive Landscape:
Market players in the whole milk powder industry are concentrating more on expanding their production capacities, forming strategic partnerships, and enhancing product quality to gain greater market share. Several key players have invested in sophisticated processing technologies that will guarantee the consistency of products and address increasing consumer need for premium dairy products that are high in nutrients. With increasing demands for dairy alternatives and nutritional supplements, some businesses are also focusing on diversification to meet current and future tastes. The significant trend in this sector is the growing demand for high-value and organic whole milk powder. Consumers, due to more awareness about being healthy, increasingly choose products that contain no additives and chemicals in the form, making players invent and produce organically sourced milk powders while also ensuring their sustainability. Players are also utilizing e-commerce channels to increase accessibility and reach while responding to the growing trend of online shopping. Strategic mergers and acquisitions remain another key activity, with companies looking to enhance their market presence and expand their geographic footprint in high-growth regions such as China, India, and Southeast Asia. These efforts create a positive whole milk powder market outlook.
The report provides a comprehensive analysis of the competitive landscape in the keyword market with detailed profiles of all major companies, including:
- Agri-Dairy Products, Inc.
- All American Foods
- Amul (GCMMF)
- Arla Foods amba
- Chicago Dairy Corporation
- Dairy Farmers of America, Inc.
- Fonterra Co-Operative Group Limited
- Lactalis Ingredients
- Vinamilk
- Westland Milk Products
- Z Natural Foods
Latest News and Developments:
- January 2025: Lactalis Ingredients completed a new drying tower at the Walhorn Dairy. The modernization of this production aims to improve the quality of high-quality dairy products, meet customer needs, and ensure sustainability.
- October 2024: Danone India to re-enter dairy market after pulling out in 2018, plans to collaborate with BAIF for supporting over 5,000 dairy farmers of Punjab, invests €20 Million (USD 20.56 Million) in Lalru facility upgrade focusing on sustainable farming and dairy production at the local level.
- September 2024: Fonterra announced a USD 150 Million investment for a new cool store at its Whareroa site in Taranaki, aimed at boosting operations and supply chain resilience. The store will increase capacity by 5,000 tonnes, supporting cheese storage. This follows recent investments in protein and UHT cream plants, driving future growth.
- July 2024: Nestlé R&D has developed a new method to reduce milk powder fat by up to 60% without compromising quality or taste. This innovation, introduced in Ninho Adulto in Brazil, mimics milk fat using proteins, lowering calorie levels while maintaining creaminess and preferred texture for consumers.
Whole Milk Powder Market Report Scope:
| Report Features | Details |
|---|---|
| Base Year of the Analysis | 2025 |
| Historical Period | 2020-2025 |
| Forecast Period | 2026-2034 |
| Units | Million Tons, Million USD |
| Scope of the Report |
Exploration of Historical Trends and Market Outlook, Industry Catalysts and Challenges, Segment-Wise Historical and Future Market Assessment:
|
| End Uses Covered | Dairy, Infant Formulae, Bakery, Confectionery, Others |
| Countries Covered | New Zealand, China, European Union, Brazil, Argentina, Others |
| Companies Covered | Agri-Dairy Products, Inc., All American Foods, Amul (GCMMF), Arla Foods amba, Chicago Dairy Corporation, Dairy Farmers of America, Inc., Fonterra Co-Operative Group Limited, Lactalis Ingredients, Vinamilk, Westland Milk Products, Z Natural Foods, etc. |
| Customization Scope | 10% Free Customization |
| Post-Sale Analyst Support | 10-12 Weeks |
| Delivery Format | PDF and Excel through Email (We can also provide the editable version of the report in PPT/Word format on special request) |
Key Benefits for Stakeholders:
- IMARC’s report offers a comprehensive quantitative analysis of various market segments, historical and current market trends, market forecasts, and dynamics of the whole milk powder market from 2020-2034.
- The research study provides the latest information on the market drivers, challenges, and opportunities in the global whole milk powder market.
- The study maps the leading, and the fastest-growing, regional markets. It further enables stakeholders to identify the key country-level markets within each region.
- Porter's Five Forces analysis assists stakeholders in assessing the impact of new entrants, competitive rivalry, supplier power, buyer power, and the threat of substitution. It helps stakeholders to analyze the level of competition within the whole milk powder industry and its attractiveness.
- Competitive landscape allows stakeholders to understand their competitive environment and provides an insight into the current positions of key players in the market.
Frequently Asked Questions About the Whole Milk Powder Market Report
The whole milk powder market was valued at 6.8 Million Tons in 2025.
The whole milk powder market is estimated to exhibit a CAGR of 2.66% during 2026-2034.
The whole milk powder market is fueled by rising dairy demand, convenience food preferences, health consciousness, expanding food and beverage industries, population growth, and rising disposable incomes, particularly in emerging economies.
China currently dominates the market due to its growing demand for dairy products, particularly infant formula.
Some of the major players in the whole milk powder market include Agri-Dairy Products, Inc., All American Foods, Amul (GCMMF), Arla Foods amba, Chicago Dairy Corporation, Dairy Farmers of America, Inc., Fonterra Co-Operative Group Limited, Lactalis Ingredients, Vinamilk, Westland Milk Products, Z Natural Foods, etc.
Need more help?
- Speak to our experienced analysts for insights on the current market scenarios.
- Include additional segments and countries to customize the report as per your requirement.
- Gain an unparalleled competitive advantage in your domain by understanding how to utilize the report and positively impacting your operations and revenue.
- For further assistance, please connect with our analysts.
 Request Customization
 Speak to an Analyst
 Request Brochure
 Inquire Before Buying
Benefits of Customization
- Personalize this research
- Triangulate with your data
- Get data as per your format and definition
- Gain a deeper dive into a specific application, geography, customer, or competitor
- Any level of personalization
Get in Touch With Us
UNITED STATES
Phone: +1-201-971-6302
INDIA
Phone: +91-120-433-0800
UNITED KINGDOM
Phone: +44-753-714-6104
Email: [email protected]
Client Testimonials


.webp)


