
Zinc Prices, Trend, Chart, Demand, Market Analysis, News, Historical and Forecast Data Report 2026 Edition
Zinc Price Trend, Index and Forecast
Track real-time and historical zinc prices across global regions. Updated monthly with market insights, drivers, and forecasts.
Zinc Prices December 2025
| Region | Price (USD/KG) | Latest Movement |
|---|---|---|
| Africa | 2.99 | -1.2% ↓ Down |
| Northeast Asia | 3.43 | 1.2% ↑ Up |
| Europe | 2.95 | 2.1% ↑ Up |
| India | 2.84 | -5.6% ↓ Down |
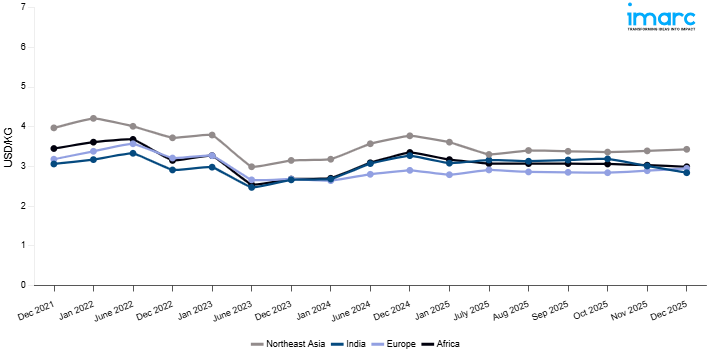
Zinc Price Index (USD/KG):
The chart below highlights monthly zinc prices across different regions.
Get Access to Monthly/Quaterly/Yearly Prices, Request Sample
Market Overview Q3 Ending September 2025
Africa: The market maintained stable pricing conditions reflecting balanced regional supply-demand dynamics and consistent industrial consumption patterns. Supply availability from domestic mining operations in South Africa and other producing nations adequately served regional requirements without significant pricing pressures. Demand-side factors including steady requirements from galvanizing industries and construction sectors supported consumption levels, while emerging infrastructure development projects provided underlying demand support. Currency fluctuations against the US dollar in various African economies and transportation logistics considerations influenced cost structures, though the overall market equilibrium resulted in unchanged pricing throughout the period.
Northeast Asia: Northeast Asian zinc markets experienced downward pricing pressures reflecting weak supply conditions met by subdued demand, particularly from Chinese and broader regional construction and manufacturing sectors. The developing oversupply situation in the global zinc market influenced regional pricing dynamics, with analysts forecasting continued price pressures. China's position as the largest consumer experienced tempered industrial activity, while treatment charges for zinc concentrates increased significantly, providing margin support for processing operations despite weaker refined metal prices. Regional supply chain adjustments and inventory management strategies contributed to the observed downward trajectory throughout the period.
Europe: The market registered downward pricing movements amid weak demand from construction and manufacturing sectors, with market conditions expected to continue without significant rebounds. Supply-side dynamics remained relatively stable, though demand-side challenges from subdued construction activity and cautious industrial consumption patterns influenced pricing directions. Energy cost considerations affecting smelting operations and competitive import dynamics contributed to market pressures, while environmental compliance requirements added to production cost structures. Anticipated supply surplus conditions and ongoing demand lag supported bearish market sentiment, resulting in the modest downward price adjustment observed during the reporting period.
India: The regional market demonstrated upward pricing momentum driven by rising demand for galvanized steel extensively used in construction and automotive industries, supported by government infrastructure development initiatives. Domestic production from major operations including Hindustan Zinc supported supply stability, while growing industrial requirements and infrastructure expansion sustained the upward pricing movement throughout the period.
Zinc Price Trend, Market Analysis, and News
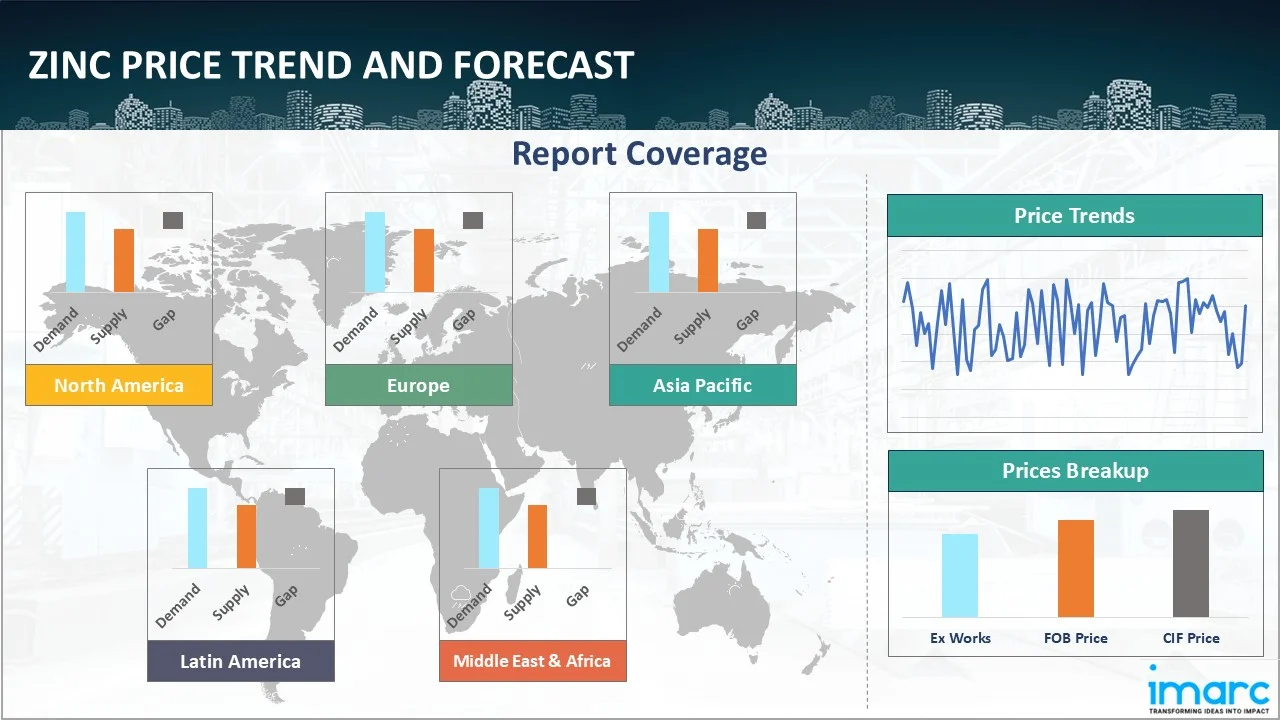
IMARC's latest publication, “Zinc Prices, Trend, Chart, Demand, Market Analysis, News, Historical and Forecast Data Report 2026 Edition,” presents a detailed examination of the zinc market, providing insights into both global and regional trends that are shaping prices. This report delves into the spot price of zinc at major ports and analyzes the composition of prices, including FOB and CIF terms. It also presents detailed zinc prices trend analysis by region, covering North America, Europe, Asia Pacific, Latin America, and Middle East and Africa. The factors affecting zinc pricing, such as the dynamics of supply and demand, geopolitical influences, and sector-specific developments, are thoroughly explored. This comprehensive report helps stakeholders stay informed with the latest market news, regulatory updates, and technological progress, facilitating informed strategic decision-making and forecasting.
Zinc Industry Analysis
The global zinc market size reached 14.02 Million Tons in 2025. By 2034, industry analysts expect the market to reach 17.51 Million Tons, reflecting a projected CAGR of 2.30% during 2026-2034. This growth is being driven by expanding usage of zinc in galvanization for infrastructure and construction, rising demand from the automotive and electronics industries, increased adoption in alloy production, and robust consumption in the chemical sector. Additionally, recycling advancements and new mining investments are expected to support long-term market growth.
Latest developments in the zinc industry:
- June 2025: Hindustan Zinc approved a major expansion project valued at INR 120 billion (approximately USD 1.39 billion). The initiative aims to boost its capacity by 250 kilo-tonnes within 36 months, nearly doubling its current output of 1,129 KT, funded through a mix of internal accruals and debt.
- September 2024: Enerpoly, a Swedish company specializing in zinc-ion battery cell technology, established a large-scale manufacturing facility in northern Sweden. Production is expected to begin in 2025, with a targeted final capacity throughput of 100 MWh annually by 2026.
- July 2024: EcoZen, a new low-carbon "green" zinc brand, was launched by Hindustan Zinc Limited, the largest integrated zinc producer in India and the second largest in the world. This brand represents Asia’s first low-carbon zinc, with a carbon footprint of less than one ton of carbon equivalent per ton of zinc.
- December 2023: Rallis India Limited, a Tata company and major player in the Indian agri-inputs market, introduced an innovative patented zinc fertilizer for soil application called NAYAZINC. This fertilizer can be used across diverse crops, soil types, and agroclimatic settings, providing farmers with an effective alternative to zinc sulphate.
Product Description
Zinc is a bluish-white metallic element (chemical symbol Zn) that belongs to the group of essential non-ferrous base metals. It is known for its corrosion resistance, ductility, and ability to form strong alloys. Zinc is widely used in galvanization, where it provides a protective coating for steel and iron, preventing rust and extending material lifespan. In addition, zinc is a key component in die-casting alloys, brass, and various chemical compounds such as zinc oxide and zinc sulfate, which are utilized in rubber, paints, fertilizers, and pharmaceuticals. The metal’s role in batteries and electronics is also expanding with the growing need for energy storage solutions. Its versatility and durability ensure zinc’s continued relevance across multiple industrial applications.
Report Coverage
| Key Attributes | Details |
|---|---|
| Product Name | Zinc |
| Report Features | Exploration of Historical Trends and Market Outlook, Industry Demand, Industry Supply, Gap Analysis, Challenges, Ammonia Price Analysis, and Segment-Wise Assessment. |
| Currency/Units | US$ (Data can also be provided in local currency) or Metric Tons |
| Region/Countries Covered | The current coverage includes analysis at the global and regional levels only. Based on your requirements, we can also customize the report and provide specific information for the following countries: Asia Pacific: China, India, Indonesia, Pakistan, Bangladesh, Japan, Philippines, Vietnam, Thailand, South Korea, Malaysia, Nepal, Taiwan, Sri Lanka, Hongkong, Singapore, Australia, and New Zealand* Europe: Germany, France, United Kingdom, Italy, Spain, Russia, Turkey, Netherlands, Poland, Sweden, Belgium, Austria, Ireland, Switzerland, Norway, Denmark, Romania, Finland, Czech Republic, Portugal and Greece* North America: United States and Canada Middle East & Africa: Saudi Arabia, UAE, Israel, Iran, South Africa, Nigeria, Oman, Kuwait, Qatar, Iraq, Egypt, Algeria, and Morocco* Latin America: Brazil, Mexico, Argentina, Columbia, Chile, Ecuador, Peru* *The list of countries presented is not exhaustive. Information on additional countries can be provided if required by the client. |
| Information Covered for Key Suppliers |
|
| Customization Scope | The report can be customized as per the requirements of the customer |
| Report Price and Purchase Option |
Plan A: Monthly Updates - Annual Subscription
Plan B: Quarterly Updates - Annual Subscription
Plan C: Biannually Updates - Annual Subscription
|
| Post-Sale Analyst Support | 360-degree analyst support after report delivery |
| Delivery Format | PDF and Excel through email (We can also provide the editable version of the report in PPT/Word format on special request) |
Key Benefits for Stakeholders:
- IMARC’s report presents a detailed analysis of zinc pricing, covering global and regional trends, spot prices at key ports, and a breakdown of FOB and CIF prices.
- The study examines factors affecting zinc price trend, including input costs, supply-demand shifts, and geopolitical impacts, offering insights for informed decision-making.
- The competitive landscape review equips stakeholders with crucial insights into the latest market news, regulatory changes, and technological advancements, ensuring a well-rounded, strategic overview for forecasting and planning.
- IMARC offers various subscription options, including monthly, quarterly, and biannual updates, allowing clients to stay informed with the latest market trends, ongoing developments, and comprehensive market insights. The zinc price charts ensure our clients remain at the forefront of the industry.
Frequently Asked Questions About the Zinc Price Trend Report
The zinc prices in December 2025 were 2.99 USD/KG in Africa, 3.43 USD/KG in Northeast Asia, 2.95 USD/KG in Europe, and 2.84 USD/KG in India.
The zinc prices data is updated on a monthly basis.
We provide the pricing data primarily in the form of an Excel sheet and a PDF.
Yes, our report includes a forecast for zinc prices.
The regions covered include North America, Europe, Asia Pacific, Middle East, and Latin America. Countries can be customized based on the request (additional charges may be applicable).
Yes, we provide both FOB and CIF prices in our report.
Need more help?
- Speak to our experienced analysts for insights on the current market scenarios.
- Include additional segments and countries to customize the report as per your requirement.
- Gain an unparalleled competitive advantage in your domain by understanding how to utilize the report and positively impacting your operations and revenue.
- For further assistance, please connect with our analysts.
 Request Customization
 Inquire Before Buying
 Speak to an Analyst
 Request Brochure
Benefits of Customization
- Personalize this research
- Triangulate with your data
- Get data as per your format and definition
- Gain a deeper dive into a specific application, geography, customer, or competitor
- Any level of personalization
Get in Touch With Us
UNITED STATES
Phone: +1-201-971-6302
INDIA
Phone: +91-120-433-0800
UNITED KINGDOM
Phone: +44-753-714-6104
Email: [email protected]
Client Testimonials


.webp)


Why Choose Us
IMARC offers trustworthy, data-centric insights into commodity pricing and evolving market trends, enabling businesses to make well-informed decisions in areas such as procurement, strategic planning, and investments. With in-depth knowledge spanning more than 1000 commodities and a vast global presence in over 150 countries, we provide tailored, actionable intelligence designed to meet the specific needs of diverse industries and markets.
1000
+Commodities
150
+Countries Covered
3000
+Clients
20
+Industry
Robust Methodologies & Extensive Resources
IMARC delivers precise commodity pricing insights using proven methodologies and a wealth of data to support strategic decision-making.
Subscription-Based Databases
Our extensive databases provide detailed commodity pricing, import-export trade statistics, and shipment-level tracking for comprehensive market analysis.
Primary Research-Driven Insights
Through direct supplier surveys and expert interviews, we gather real-time market data to enhance pricing accuracy and trend forecasting.
Extensive Secondary Research
We analyze industry reports, trade publications, and market studies to offer tailored intelligence and actionable commodity market insights.
Trusted by 3000+ industry leaders worldwide to drive data-backed decisions. From global manufacturers to government agencies, our clients rely on us for accurate pricing, deep market intelligence, and forward-looking insights.