
N-Hexane Prices, Trend, Chart, Market Analysis, News, Demand, Historical and Forecast Data Report 2026 Edition
N-Hexane Price Trend, Index and Forecast
Track the latest insights on n-hexane price trend and forecast with detailed analysis of regional fluctuations and market dynamics across North America, Latin America, Central Europe, Western Europe, Eastern Europe, Middle East, North Africa, West Africa, Central and Southern Africa, Central Asia, Southeast Asia, South Asia, East Asia, and Oceania.
N-Hexane Prices Outlook Q2 2026
- USA: USD 1613/MT
- China: USD 1378/MT
- Netherlands: USD 1387/MT
- South Korea: USD 2710/MT
- India: USD 1554/MT
N-Hexane Price Chart
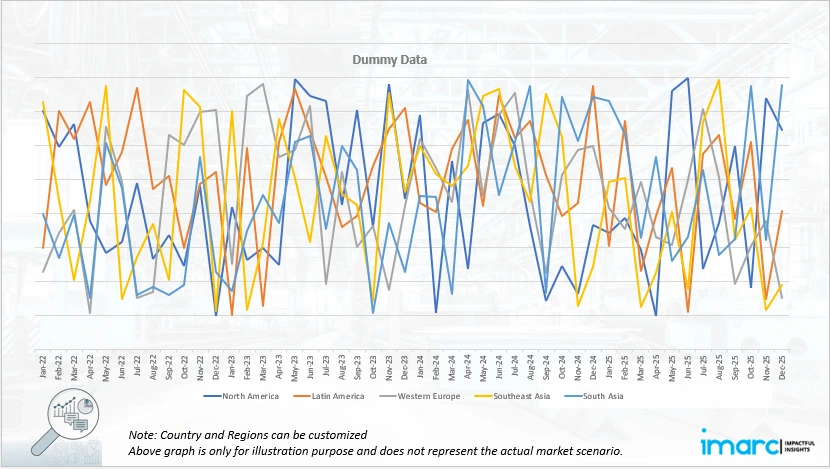
Get real-time access to monthly/quarterly/yearly prices Request Sample
During the second quarter of 2026, the n-hexane prices in the USA reached 1613 USD/MT in June. Prices declined as improved supply availability and softer upstream cost pressure reduced market support during the quarter. Domestic production remained sufficient to meet requirements from extraction, chemical processing, adhesives, and laboratory applications, limiting supply concerns among buyers. Lower procurement pressure from some downstream industries encouraged more competitive supplier offers.
During the second quarter of 2026, the n-hexane prices in China reached 1378 USD/MT in June. Prices increased as stronger demand from extraction, chemical processing, and industrial solvent applications supported market activity. Higher crude linked feedstock expenses influenced production economics and encouraged suppliers to maintain firmer quotations. Domestic manufacturers experienced increased cost pressure from raw material procurement and operational expenses, affecting overall pricing strategies.
During the second quarter of 2026, the n-hexane prices in Netherlands reached 1387 USD/MT in June. Prices increased as tighter supply conditions and stronger procurement activity supported higher market quotations. European buyers faced challenges related to supply availability and transportation efficiency, which influenced replacement costs across the region. Demand from chemical processing, extraction industries, and industrial solvent applications remained stable, supporting regular purchasing activity.
During the second quarter of 2026, the n-hexane prices in South Korea reached 2710 USD/MT in June. Prices increased significantly as strong demand from electronics, chemical processing, and industrial manufacturing sectors supported market conditions. South Korea’s advanced manufacturing industries continued requiring high quality solvents for specialized applications, maintaining steady procurement activity. Higher raw material costs and increased production expenses encouraged suppliers to revise quotations upward.
During the second quarter of 2026, the n-hexane prices in India reached 1554 USD/MT in June. Prices increased as stronger demand from edible oil extraction, pharmaceuticals, chemicals, and industrial solvent applications supported market activity. Rising feedstock costs increased production and procurement expenses, encouraging suppliers to maintain higher quotations. Import dependence for certain supply requirements exposed buyers to international price movements and transportation expenses.
N-Hexane Prices Outlook Q2 2025
- USA: USD 1678/MT
- China: USD 1141/MT
- Netherlands: USD 1183/MT
- South Korea: USD 1806/MT
- India: USD 1393/MT
During the second quarter of 2025, n-hexane prices in the USA reached 1678 USD/MT in June. The U.S. n-hexane market showed a stable to slightly firm trend. While demand from industrial solvents and chemical processing remained moderate, logistical constraints and rising fuel costs added some pressure to supply chains. Producers maintained adequate output, but buyers adopted cautious purchasing strategies amid inflation concerns. Imports from Asia were steady but did not significantly disrupt domestic pricing. Overall, the market remained balanced, with prices reflecting a stable supply-demand environment and moderate cost-side influences.
During the second quarter of 2025, n-hexane prices in China reached 1141 USD/MT in June. China's n-hexane prices strengthened in this quarter, supported by robust demand from edible oil extraction and pharmaceutical industries. Despite relatively stable crude oil prices, localized supply constraints, regulatory inspections, and port congestion contributed to a firming market. Domestic producers operated steadily, but growing downstream activity, especially in food processing and pharma, kept demand elevated. Export activity also remained stable, adding additional pull-on local availability. Overall, the market saw upward pricing pressure, with sentiment remaining strong throughout the quarter due to healthy industrial consumption.
During the second quarter of 2025, the n-hexane prices in the Netherlands reached 1183 USD/MT in June. The n-hexane market followed a slightly mixed trend in the region. Early in the quarter, prices saw modest gains due to active demand from food-grade solvent applications and tight inventories across Europe. However, weakening demand in adhesives and industrial coatings offset the gains later in the quarter. Suppliers adjusted pricing cautiously, keeping in mind broader economic uncertainties and import competition. With stable supply and fluctuating demand patterns, the market remained cautious, and prices moved within a narrow, balanced range by quarter-end.
During the second quarter of 2025, the n-hexane prices in South Korea reached 1806 USD/MT in June. South Korea's n-hexane market remained largely steady. Demand from edible oil processing and pharmaceuticals provided consistent consumption, while weak industrial demand in adhesives and construction kept price increases in check. Refiners operated at regular rates, and no major supply shocks occurred. Imports from regional producers, including China and Southeast Asia, helped balance domestic needs. Buyers followed conservative procurement strategies due to stable availability and minimal cost fluctuations. Overall, the market showed a flat pricing trajectory with limited volatility.
During the second quarter of 2025, the n-hexane prices in India reached 1393 USD/MT in June. India's n-hexane market saw a stable pricing environment, supported by steady demand from edible oil extraction and pharmaceutical sectors. Construction-related consumption remained sluggish, but it was offset by consistent buying from food processing units. Domestic production was sufficient, and supply disruptions were minimal. While feedstock prices remained range-bound, cautious buying behavior and adequate inventories helped maintain pricing balance. Imports complemented local supply without creating pressure. Overall, prices remained within a narrow band, with no significant upward or downward shifts during the quarter.
Regional Coverage
The report provides a detailed analysis of the market across different regions, each with unique pricing dynamics influenced by localized market conditions, supply chain intricacies, and geopolitical factors. This includes price trends, price forecast, and supply and demand trends for each region, along with spot prices by major ports. The report also provides coverage of FOB and CIF prices and the key factors influencing n-hexane prices.
Europe N-Hexane Price Trend
Q2 2026:
The n-hexane price index in Europe moved upward as supply challenges, higher logistics expenses, and steady industrial demand supported stronger market conditions. Demand from extraction industries, chemical manufacturers, pharmaceuticals, and specialty solvent users remained consistent, maintaining regular procurement activity. Supply chain disruptions affected delivery schedules and increased replacement costs for buyers relying on regional and imported supplies. Higher energy and feedstock expenses also influenced production economics, encouraging suppliers to maintain firmer offers. European distributors managed inventories carefully as companies focused on securing sufficient material availability for ongoing operations. Transportation constraints and changing trade conditions added pressure on regional supply networks.
Q2 2025:
As per the n-hexane price index, Europe saw a more dynamic price trajectory. Prices showed modest rises early in the quarter—propelled by firm demand in oil‑extraction industries and tighter availability—but then gave way to declines as construction‑sector weakness deepened. Rising feedstock and energy costs supported production, though subdued demand in coatings and adhesives, along with economic softness, dampened overall pricing momentum. The result was a mixed and cautious pricing environment across the region.
This analysis can be extended to include detailed n-hexane price information for a comprehensive list of countries.
| Region | Countries Covered |
|---|---|
| Europe | Germany, France, United Kingdom, Italy, Spain, Russia, Turkey, Netherlands, Poland, Sweden, Belgium, Austria, Ireland, Switzerland, Norway, Denmark, Romania, Finland, Czech Republic, Portugal, and Greece, among other European countries. |
North America N-Hexane Price Trend
Q2 2026:
The n-hexane price index in North America moved downward as improved supply availability and balanced market conditions reduced pricing pressure. Domestic production remained sufficient to support demand from extraction, chemical processing, and industrial solvent applications. Lower pressure on feedstock availability helped reduce production cost concerns for suppliers, allowing more competitive market offers. Buyers benefited from improved inventory conditions and greater flexibility in sourcing requirements. Demand remained stable from key industrial users, but purchasing activity was not strong enough to create significant supply tightness. Logistics conditions improved compared with previous periods, supporting smoother distribution and reducing additional cost burdens. Producers adjusted pricing strategies to maintain competitiveness while managing balanced supply conditions.
Q2 2025:
In North America, the n‑hexane market showed a neutral to mildly firm trend. While the construction sector remained sluggish, limiting gains in adhesives and coatings demand, niche support came from infrastructure and manufacturing-related projects. Supply held steady, with stable production and adequate inventories underpinning market balance. Procurement was measured amid economic caution, helping prices maintain a neutral profile, with neither strong upward nor downward pressure dominating.
Specific n-hexane historical data within the United States and Canada can also be provided.
| Region | Countries Covered |
|---|---|
| North America | United States and Canada |
Middle East and Africa N-Hexane Price Trend
Q2 2026:
The study includes n-hexane price trends across the Middle East and Africa, considering essential factors that have a direct impact on market prices, such as regional industrial growth, healthcare expansion, and political stability. Geopolitical tensions and evolving trade routes generally influenced price fluctuations.
Q2 2025:
The report explores the n-hexane trends and n-hexane price chart in the Middle East and Africa, considering factors like regional industrial growth, the availability of natural resources, and geopolitical tensions that uniquely influence market prices.
In addition to region-wise data, information on n-hexane prices for countries can also be provided.
| Region | Countries Covered |
|---|---|
| Middle East & Africa | Saudi Arabia, UAE, Israel, Iran, South Africa, Nigeria, Oman, Kuwait, Qatar, Iraq, Egypt, Algeria, and Morocco, among other Middle Eastern and African countries. |
Asia Pacific N-Hexane Price Trend
Q2 2026:
The n-hexane prices across Asia Pacific increased as stronger industrial demand, higher feedstock costs, and supply constraints supported firmer market conditions. Demand from edible oil extraction, chemical manufacturing, pharmaceuticals, electronics, and industrial solvent applications remained stable across major regional markets. China experienced increased production costs, while South Korea faced stronger demand from advanced manufacturing sectors, supporting higher quotations. India also witnessed stronger procurement activity due to continued requirements from extraction and chemical industries. Higher transportation expenses and supply chain challenges influenced regional trade flows and increased delivered costs. Export demand from Asian suppliers affected supply availability as producers balanced domestic consumption with international commitments.
Q2 2025:
N‑hexane prices in the Asia‑Pacific region remained largely steady. Strong demand from the edible oil extraction sector helped anchor price levels. In contrast, weaker activity in construction‑related coatings, lower feedstock crude oil costs, and dampened export demand prevented notable upward movement. Inventory accumulation and cautious, short‑term procurement strategies prevailed among buyers. Overall, the market tone was neutral, with balanced supply and demand dynamics resulting in flat pricing across the quarter.
This n-hexane price analysis can be expanded to include a comprehensive list of countries within the region.
| Region | Countries Covered |
|---|---|
| Asia Pacific | China, India, Indonesia, Pakistan, Bangladesh, Japan, Philippines, Vietnam, Thailand, South Korea, Malaysia, Nepal, Taiwan, Sri Lanka, Hongkong, Singapore, Australia, and New Zealand, among other Asian countries. |
Latin America N-Hexane Price Trend
Q2 2026:
Latin America's n-hexane market is heavily influenced by its abundant natural resources, particularly in Chile and Brazil. However, political uncertainty and varied regulatory frameworks can cause significant volatility in n-hexane costs.
Q2 2025:
Latin America's n-hexane market is predominantly influenced by its rich natural reserves, particularly in countries like Chile and Brazil. However, political instability and inconsistent regulatory frameworks can lead to significant volatility in n-hexane prices. Infrastructure challenges and logistical inefficiencies often impact the supply chain, affecting the region's ability to meet international demand consistently. Moreover, the n-hexane price index, economic fluctuations, and currency devaluation are critical factors that need to be considered when analyzing n-hexane pricing trends in this region.
This comprehensive review can be extended to include specific countries within the region.
| Region | Countries Covered |
|---|---|
| Latin America | Brazil, Mexico, Argentina, Columbia, Chile, Ecuador, and Peru, among other Latin American countries. |
N-Hexane Pricing Report, Market Analysis, and News
IMARC's latest publication, “N-Hexane Prices, Trend, Chart, Demand, Market Analysis, News, Historical and Forecast Data Report 2026 Edition,” provides an in-depth analysis of the n-hexane market dynamics. This report examines spot price variations at major ports and explores price compositions, including FOB and CIF terms. Detailed n-hexane price trend analysis by region highlights global shifts across North America, Europe, Asia Pacific, Latin America, and Middle East and Africa. The factors affecting n-hexane pricing, such as supply-demand dynamics, geopolitical influences, and sector-specific developments, are rigorously evaluated. This comprehensive report equips stakeholders with the latest market news, regulatory updates, and technological advancements, aiding in informed strategic decision-making and forecasting.
N-Hexane Industry Analysis
The global n-hexane industry size reached USD 2,800.2 Million in 2025. By 2034, IMARC Group expects the market to reach USD 3,616.3 Million, at a projected CAGR of 2.80% during 2026-2034. The market growth is driven by rising demand from edible oil extraction, chemical processing, and industrial solvent applications. Growth in pharmaceutical manufacturing, adhesive production, and specialty chemical industries continues to support consumption.
Latest News and Developments:
- February 2026: The European Chemicals Agency (ECHA) expanded the REACH SVHC Candidate List to 253 substances on February 4, 2026, adding n-hexane and Bisphenol AF. The update introduces immediate compliance requirements for manufacturers, importers, and suppliers handling products used in adhesives, coatings, cosmetics, automotive fluids, and advanced polymers.
Product Description
N-hexane is a straight chain hydrocarbon solvent with the chemical formula C6H14. It is a colorless liquid with high volatility, low water solubility, and strong dissolving ability for oils and fats. These properties make it widely used in edible oil extraction, where it helps separate oils from seeds and other agricultural materials. It is also used in chemical manufacturing, adhesives, rubber processing, cleaning applications, and laboratory processes. Industrial grade n hexane is valued for its effectiveness as a nonpolar solvent and its ability to dissolve organic compounds. Due to its performance characteristics, it remains an important raw material in several industrial sectors. Manufacturers focus on purity levels and production quality depending on application requirements, especially in food processing, pharmaceuticals, and specialty chemical industries.
Report Coverage
| Key Attributes | Details |
|---|---|
| Product Name | N-Hexane |
| Report Features | Exploration of Historical Trends and Market Outlook, Industry Demand, Industry Supply, Gap Analysis, Challenges, N-Hexane Price Analysis, and Segment-Wise Assessment. |
| Currency/Units | US$ (Data can also be provided in local currency) or Metric Tons |
| Region/Countries Covered | The current coverage includes analysis at the global and regional levels only. Based on your requirements, we can also customize the report and provide specific information for the following countries: Asia Pacific: China, India, Indonesia, Pakistan, Bangladesh, Japan, Philippines, Vietnam, Thailand, South Korea, Malaysia, Nepal, Taiwan, Sri Lanka, Hongkong, Singapore, Australia, and New Zealand Europe: Germany, France, United Kingdom, Italy, Spain, Russia, Turkey, Netherlands, Poland, Sweden, Belgium, Austria, Ireland, Switzerland, Norway, Denmark, Romania, Finland, Czech Republic, Portugal and Greece North America: United States and Canada Latin America: Brazil, Mexico, Argentina, Columbia, Chile, Ecuador, and Peru Middle East & Africa: Saudi Arabia, UAE, Israel, Iran, South Africa, Nigeria, Oman, Kuwait, Qatar, Iraq, Egypt, Algeria, and Morocco The list of countries presented is not exhaustive. Information on additional countries can be provided if required by the client. |
| Information Covered for Key Suppliers |
|
| Customization Scope | The report can be customized as per the requirements of the customer |
| Report Price and Purchase Option |
Plan A: Monthly Updates - Annual Subscription
Plan B: Quarterly Updates - Annual Subscription
Plan C: Biannually Updates - Annual Subscription
|
| Post-Sale Analyst Support | 360-degree analyst support after report delivery |
| Delivery Format | PDF and Excel through email (We can also provide the editable version of the report in PPT/Word format on special request) |
Key Benefits for Stakeholders:
- IMARC’s report presents a detailed analysis of n-hexane pricing, covering global and regional trends, spot prices at key ports, and a breakdown of Ex Works, FOB, and CIF prices.
- The study examines factors affecting n-hexane price trend, including raw material costs, supply-demand shifts, geopolitical impacts, and industry developments, offering insights for informed decision-making.
- The competitive landscape review equips stakeholders with crucial insights into the latest market news, regulatory changes, and technological advancements, ensuring a well-rounded, strategic overview for forecasting and planning.
- IMARC offers various subscription options, including monthly, quarterly, and biannual updates, allowing clients to stay informed with the latest market trends, ongoing developments, and comprehensive market insights. The n-hexane price charts ensure our clients remain at the forefront of the industry.
Need more help?
- Speak to our experienced analysts for insights on the current market scenarios.
- Include additional segments and countries to customize the report as per your requirement.
- Gain an unparalleled competitive advantage in your domain by understanding how to utilize the report and positively impacting your operations and revenue.
- For further assistance, please connect with our analysts.
 Request Customization
 Inquire Before Buying
 Speak to an Analyst
 Request Brochure
Benefits of Customization
- Personalize this research
- Triangulate with your data
- Get data as per your format and definition
- Gain a deeper dive into a specific application, geography, customer, or competitor
- Any level of personalization
Get in Touch With Us
UNITED STATES
Phone: +1-201-971-6302
INDIA
Phone: +91-120-433-0800
UNITED KINGDOM
Phone: +44-753-714-6104
Email: [email protected]
Client Testimonials




.webp)




.webp)













Related Reports

Why Choose Us
IMARC offers trustworthy, data-centric insights into commodity pricing and evolving market trends, enabling businesses to make well-informed decisions in areas such as procurement, strategic planning, and investments. With in-depth knowledge spanning more than 1000 commodities and a vast global presence in over 150 countries, we provide tailored, actionable intelligence designed to meet the specific needs of diverse industries and markets.
1000
+Commodities
150
+Countries Covered
3000
+Clients
20
+Industry

Robust Methodologies & Extensive Resources
IMARC delivers precise commodity pricing insights using proven methodologies and a wealth of data to support strategic decision-making.

Subscription-Based Databases
Our extensive databases provide detailed commodity pricing, import-export trade statistics, and shipment-level tracking for comprehensive market analysis.

Primary Research-Driven Insights
Through direct supplier surveys and expert interviews, we gather real-time market data to enhance pricing accuracy and trend forecasting.

Extensive Secondary Research
We analyze industry reports, trade publications, and market studies to offer tailored intelligence and actionable commodity market insights.
Trusted by 3000+ industry leaders worldwide to drive data-backed decisions. From global manufacturers to government agencies, our clients rely on us for accurate pricing, deep market intelligence, and forward-looking insights.