
Precipitated Silica Prices, Trend, Chart, Demand, Market Analysis, News, Historical and Forecast Data Report 2026 Edition
Precipitated Silica Price Trend, Index and Forecast
Track the latest insights on precipitated silica price trend and forecast with detailed analysis of regional fluctuations and market dynamics across North America, Latin America, Central Europe, Western Europe, Eastern Europe, Middle East, North Africa, West Africa, Central and Southern Africa, Central Asia, Southeast Asia, South Asia, East Asia, and Oceania.
Precipitated Silica Prices Outlook Q3 2026
- Germany: USD 1386/MT
- USA: USD 1341/MT
- China: USD 1075/MT
- Brazil: USD 1300/MT
- Japan: USD 1433/MT
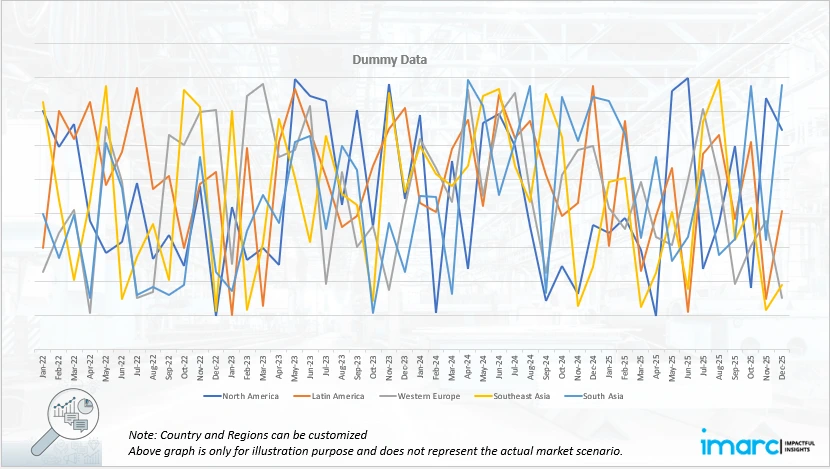
Precipitated Silica Price Chart
Get real-time access to monthly/quarterly/yearly prices Request Sample
During the third quarter of 2026, the precipitated silica prices in Germany reached 1386 USD/MT in September. Prices moved higher as offers for standard and specialty grades firmed in line with costlier procurement terms from suppliers within the region. Tire and rubber goods manufacturers kept intake close to scheduled requirements and did not hold back in expectation of a correction.
During the third quarter of 2026, the precipitated silica prices in the USA reached 1341 USD/MT in September. Prices advanced as domestic producers kept precipitation plants at firm operating rates while enquiries from the rubber and coatings sectors stayed active. Buyers in the tire and industrial hose segments booked material ahead of consumption to protect their delivery schedules.
During the third quarter of 2026, the precipitated silica prices in China reached 1075 USD/MT in September. Prices strengthened as producers carried dearer sodium silicate and acid costs into their offers. Rubber footwear compounders and tire makers maintained steady intake, which kept volumes moving out of the producing centers. Export enquiries absorbed part of the available material and reduced the lots left for local buyers.
During the third quarter of 2026, the precipitated silica prices in Brazil reached 1300 USD/MT in September. Prices climbed as material arriving from outside the region landed at dearer values, which allowed domestic sellers to quote higher. Tire retreaders and rubber goods plants purchased regularly to keep their lines running. Local output is narrow, so buyers relied on imported parcels to bridge the gap between use and domestic availability.
During the third quarter of 2026, the precipitated silica prices in Japan reached 1433 USD/MT in September. Prices moved upward as buyers reliant on imported material met firmer offers from supplying origins during the quarter. Demand from tire makers, precision rubber parts producers and oral care brands held steady and absorbed the volumes on offer. Traders reported fewer parcels available for prompt shipment, which left purchasers competing for the material in hand.
Precipitated Silica Prices Outlook Q2 2026
- Germany: USD 1350/MT
- USA: USD 1300/MT
- China: USD 1050/MT
- Brazil: USD 1250/MT
- Japan: USD 1400/MT
During the second quarter of 2026, the precipitated silica prices in Germany reached 1350 USD/MT in June. The market experienced steady procurement activity from tire and coatings manufacturers, supported by stable downstream industrial demand. Supply conditions remained relatively balanced, although periodic tightening of raw material availability influenced purchasing sentiment. Energy cost fluctuations also contributed to cautious production planning among suppliers.
During the second quarter of 2026, the precipitated silica prices in the USA reached 1300 USD/MT in June. The market was influenced by consistent demand from automotive and construction-related applications, particularly in rubber reinforcement segments. Domestic production costs remained elevated due to feedstock and operational expenses, which affected supplier pricing strategies. Import flows provided partial balance, though logistical considerations influenced procurement timing.
During the second quarter of 2026, the precipitated silica prices in China reached 1050 USD/MT in June. The market was shaped by stable but moderate demand from tire manufacturing and industrial rubber applications. Production levels remained consistent, supported by adequate availability of raw materials. However, export-oriented demand provided additional support to pricing structure. Domestic buyers followed cautious procurement patterns due to uneven downstream performance across sectors.
During the second quarter of 2026, the precipitated silica prices in Brazil reached 1250 USD/MT in June. The market was supported by steady demand from automotive and industrial rubber processing sectors. Import dependency influenced domestic pricing trends, as international freight conditions and supplier availability played a key role in market direction. Local consumption remained consistent, with gradual improvement in industrial activity supporting procurement levels. Supply chain adjustments and inventory management strategies among distributors contributed to upward price movements.
During the second quarter of 2026, the precipitated silica prices in Japan reached 1400 USD/MT in June. The market reflected strong demand from high performance rubber and electronics related applications. Limited domestic production capacity led to higher reliance on imports, which influenced pricing levels. Procurement activity remained steady, with manufacturers focusing on long term supply contracts to ensure stability. Energy and operational costs also contributed to elevated pricing conditions.
Regional Coverage
The report provides a detailed analysis of the market across different regions, each with unique pricing dynamics influenced by localized market conditions, supply chain intricacies, and geopolitical factors. This includes price trends, price forecast and supply and demand trends for each region, along with spot prices by major ports. The report also provides coverage of FOB and CIF prices, as well as the key factors influencing precipitated silica prices.
Europe Precipitated Silica Price Trend
Q3 2026:
The precipitated silica price index in Europe moved upward through the quarter, with the German market setting the direction. Converters there secured replacement material on firmer terms and carried that change into their own quotations. Rubber goods manufacturers across the region kept intake aligned with scheduled output instead of deferring purchases. Oral care producers maintained routine offtake of the grades used as mild abrasives and thickeners. Availability of specialty material stayed on the tighter side, which gave sellers room to hold their numbers. Buyers in the coatings and adhesives segments covered confirmed orders and paid up where delivery timing mattered. Cargoes arriving at the main entry points carried higher values than in the previous period. Sellers showed little interest in discounting while enquiries held steady.
Q2 2026:
The precipitated silica price index in Europe showed a firm tone, supported by consistent demand from tyre manufacturing and industrial rubber processing. Supply conditions remained stable across key producing locations, but production expenses related to energy and feedstock inputs created upward pressure on offers. Market participants maintained balanced inventory strategies, which prevented abrupt fluctuations. Demand from automotive related industries stayed steady, supporting consistent offtake levels. Import flows within the region remained regular, ensuring adequate availability.
| Region | Countries Covered |
|---|---|
| Europe | Germany, France, United Kingdom, Italy, Spain, Russia, Turkey, Netherlands, Poland, Sweden, Belgium, Austria, Ireland, Switzerland, Norway, Denmark, Romania, Finland, Czech Republic, Portugal, and Greece, among other European countries. |
North America Precipitated Silica Price Trend
Q3 2026:
The precipitated silica price index in North America strengthened during the quarter, with the United States market providing the lead. Producers there kept precipitation units running at firm rates and placed output against committed positions. Demand from tire compounding, industrial rubber and coatings formulators stayed active through the period. Canadian buyers followed the same direction and met firmer numbers on material drawn from across the border. Compounders covered confirmed requirements and paid a premium where delivery timing was critical. Spot availability of treated grades remained limited, which reinforced the upward move. Intermediaries kept conservative positions and released fewer parcels to the open market.
Q2 2026:
In North America, precipitated silica price index trends moved upward. The market was supported by steady demand from tire reinforcement and rubber processing industries, where consumption levels remained firm across automotive manufacturing cycles. Rising production expenses linked to feedstock inputs such as sodium silicate and sulfuric acid contributed to higher cost pass through by producers. Industrial activity in coatings, adhesives, and specialty applications also maintained consistent offtake, limiting any downside pressure on prices. Import dependency on Asian supply chains added further support, as freight and logistics conditions influenced landed costs.
| Region | Countries Covered |
|---|---|
| North America | United States and Canada |
Middle East and Africa Precipitated Silica Price Trend
Q3 2026:
The study includes precipitated silica price trends across the Middle East and Africa, taking into consideration variables that have a direct impact on market prices, such as regional industrial expansion, natural resource availability, and geopolitical conflicts.
Q2 2026:
According to the precipitated silica price chart, supply chain disruptions, seasonal variations in demand, and geopolitical pressures were the main causes of the price fluctuations in the Middle East and Africa.
| Region | Countries Covered |
|---|---|
| Middle East & Africa | Saudi Arabia, UAE, Israel, Iran, South Africa, Nigeria, Oman, Kuwait, Qatar, Iraq, Egypt, Algeria, and Morocco, among other Middle Eastern and African countries. |
Asia Pacific Precipitated Silica Price Trend
Q3 2026:
The precipitated silica price index in Asia Pacific rose through the quarter, led by firmer values in China and Japan. Chinese producers carried higher raw material costs into their offers while keeping precipitation lines at steady rates. Japanese importers faced dearer replacement terms from supplying origins and adjusted local quotations accordingly. Rubber and footwear compounders in the region maintained regular intake rather than stepping back from the market. Export competition among suppliers eased as domestic requirements absorbed part of the available material. Trading houses reported fewer ready parcels than in the previous period. Buyers seeking uniform particle size accepted the higher numbers to secure reliable deliveries.
Q2 2026:
The precipitated silica market in Asia Pacific recorded a generally firm pricing trend, supported by strong consumption from tyre production and silicone based applications. Production activity remained active across major manufacturing hubs, though input cost variations influenced supplier pricing decisions. Demand from industrial sectors stayed steady, supporting consistent market absorption. Export activity contributed to tighter availability in certain areas, reinforcing price firmness. Supply chains remained stable, though periodic adjustments in logistics influenced short term movement.
| Region | Countries Covered |
|---|---|
| Asia Pacific | China, India, Indonesia, Pakistan, Bangladesh, Japan, Philippines, Vietnam, Thailand, South Korea, Malaysia, Nepal, Taiwan, Sri Lanka, Hongkong, Singapore, Australia, and New Zealand, among other Asian countries. |
Latin America Precipitated Silica Price Trend
Q3 2026:
The precipitated silica price index in Latin America moved upward during the quarter, with Brazil setting the direction for the region. Purchasers there met higher numbers as material brought in from outside the region arrived at dearer values. Tire producers and rubber goods plants kept consumption steady and did not step back from the market. With domestic output narrow, importers carried most of the weight of bridging the gap between use and local production. Buyers needing specific surface characteristics booked ahead of their own production runs instead of relying on prompt parcels. Traders quoted higher numbers for near term delivery and found willing takers. Distributors passed the firmer landed costs into their offers to industrial accounts.
Q2 2026:
The precipitated silica market in Latin America recorded an upward pricing trend, supported by steady improvement in industrial activity and gradual recovery in rubber processing demand. Import driven supply conditions remained consistent, while tighter availability at certain distribution points supported firmer offers from suppliers. Procurement activity strengthened slightly as downstream sectors resumed regular operating schedules. Currency related import cost pressures also contributed to higher landed pricing, reinforcing the overall upward movement across the regional market.
| Region | Countries Covered |
|---|---|
| Latin America | Brazil, Mexico, Argentina, Columbia, Chile, Ecuador, and Peru, among other Latin American countries. |
Precipitated Silica Pricing Report, Market Analysis, and News
IMARC's latest publication, “Precipitated Silica Prices, Trend, Chart, Demand, Market Analysis, News, Historical and Forecast Data Report 2026 Edition,” presents a detailed examination of the precipitated silica market, providing insights into both global and regional trends that are shaping prices. This report delves into the spot price of precipitated silica at major ports and analyzes the composition of prices, including FOB and CIF terms. It also presents detailed precipitated silica prices trend analysis by region, covering North America, Europe, Asia Pacific, Latin America, and Middle East and Africa. The factors affecting precipitated silica pricing, such as the dynamics of supply and demand, geopolitical influences, and sector specific developments, are thoroughly explored. This comprehensive report helps stakeholders stay informed with the latest market news, regulatory updates, and technological progress, facilitating informed strategic decision-making and forecasting.
Precipitated Silica Industry Analysis
The global precipitated silica market size reached USD 3.3 Billion in 2025. By 2034, IMARC Group expects the market to reach USD 6.2 Billion, at a projected CAGR of 7.20% during 2026-2034. Market growth is being driven by rising use of precipitated silica as a reinforcing filler in energy efficient tires, expanding demand for mild abrasive and thickening grades in oral care products, and steady consumption of free flowing grades in food, feed and industrial formulations.
Latest News and Developments:
- June 2026: Evonik and Egesil Kimya achieved ISCC Plus certification for their precipitated silica plant in Adapazarı, Turkey, the company's first certified silica site in the EMEA region. The facility started commercial production of ULTRASIL eCO, a circular silica based on mass balance.
Product Description
Precipitated silica is a synthetic amorphous form of silicon dioxide, supplied as a white, finely divided powder. It is manufactured rather than mined, which separates it from quartz sand and other crystalline forms. Its chemical formula is SiO2, written as O2Si in Hill notation, and the commercial powder carries silanol groups on its surface together with bound water. It is insoluble in water and in organic solvents, chemically inert under ordinary conditions, and stable when kept dry. The particles are porous and light, giving the powder a low bulk density and a high specific surface area. These features provide reinforcing, thickening, thixotropic and anticaking functionality. Industrially it serves the tire and rubber, oral care, food and feed, coatings, adhesives and battery sectors. In end use it acts as a reinforcing filler in tire treads and rubber goods, as a mild abrasive and thickener in toothpaste, as an anticaking agent in powdered foods and feed premixes, and as a filler in battery separators. Industrially, precipitated silica is commonly produced by acidulation of sodium silicate with sulfuric acid, followed by filtration, drying and milling of the precipitate.
Report Coverage
| Key Attributes | Details |
|---|---|
| Product Name | Precipitated Silica |
| Report Features | Exploration of Historical Trends and Market Outlook, Industry Demand, Industry Supply, Gap Analysis, Challenges, Precipitated Silica Price Analysis, and Segment-Wise Assessment. |
| Currency/Units | US$ (Data can also be provided in local currency) or Metric Tons |
| Region/Countries Covered |
The current coverage includes analysis at the global and regional levels only. |
| Information Covered for Key Suppliers |
|
| Customization Scope | The report can be customized as per the requirements of the customer |
| Report Price and Purchase Option |
Plan A: Monthly Updates - Annual Subscription
Plan B: Quarterly Updates - Annual Subscription
Plan C: Biannually Updates - Annual Subscription
|
| Post-Sale Analyst Support | 360-degree analyst support after report delivery |
| Delivery Format | PDF and Excel through email (We can also provide the editable version of the report in PPT/Word format on special request) |
Key Benefits for Stakeholders:
- IMARC’s report presents a detailed analysis of precipitated silica pricing, covering global and regional trends, spot prices at key ports, and a breakdown of Ex Works, FOB, and CIF prices.
- The study examines factors affecting precipitated silica price trend, including raw material costs, supply-demand shifts, geopolitical impacts, and industry developments, offering insights for informed decision-making.
- The competitive landscape review equips stakeholders with crucial insights into the latest market news, regulatory changes, and technological advancements, ensuring a well-rounded, strategic overview for forecasting and planning.
- IMARC offers various subscription options, including monthly, quarterly, and biannual updates, allowing clients to stay informed with the latest market trends, ongoing developments, and comprehensive market insights. The precipitated silica price charts ensure our clients remain at the forefront of the industry.
Need more help?
- Speak to our experienced analysts for insights on the current market scenarios.
- Include additional segments and countries to customize the report as per your requirement.
- Gain an unparalleled competitive advantage in your domain by understanding how to utilize the report and positively impacting your operations and revenue.
- For further assistance, please connect with our analysts.
 Request Customization
 Inquire Before Buying
 Speak to an Analyst
 Request Brochure
Benefits of Customization
- Personalize this research
- Triangulate with your data
- Get data as per your format and definition
- Gain a deeper dive into a specific application, geography, customer, or competitor
- Any level of personalization
Get in Touch With Us
UNITED STATES
Phone: +1-201-971-6302
INDIA
Phone: +91-120-433-0800
UNITED KINGDOM
Phone: +44-753-714-6104
Email: [email protected]
Client Testimonials























Related Reports

Why Choose Us
IMARC offers trustworthy, data-centric insights into commodity pricing and evolving market trends, enabling businesses to make well-informed decisions in areas such as procurement, strategic planning, and investments. With in-depth knowledge spanning more than 1000 commodities and a vast global presence in over 150 countries, we provide tailored, actionable intelligence designed to meet the specific needs of diverse industries and markets.
1000
+Commodities
150
+Countries Covered
3000
+Clients
20
+Industry

Robust Methodologies & Extensive Resources
IMARC delivers precise commodity pricing insights using proven methodologies and a wealth of data to support strategic decision-making.

Subscription-Based Databases
Our extensive databases provide detailed commodity pricing, import-export trade statistics, and shipment-level tracking for comprehensive market analysis.

Primary Research-Driven Insights
Through direct supplier surveys and expert interviews, we gather real-time market data to enhance pricing accuracy and trend forecasting.

Extensive Secondary Research
We analyze industry reports, trade publications, and market studies to offer tailored intelligence and actionable commodity market insights.
Trusted by 3000+ industry leaders worldwide to drive data-backed decisions. From global manufacturers to government agencies, our clients rely on us for accurate pricing, deep market intelligence, and forward-looking insights.