
Asia Pacific Negative Pressure Wound Therapy Market Size, Share, Trends and Forecast by Device, Component, Wound Type, Indication, End User, and Country, 2026-2034
Asia Pacific Negative Pressure Wound Therapy Market Size and Share:
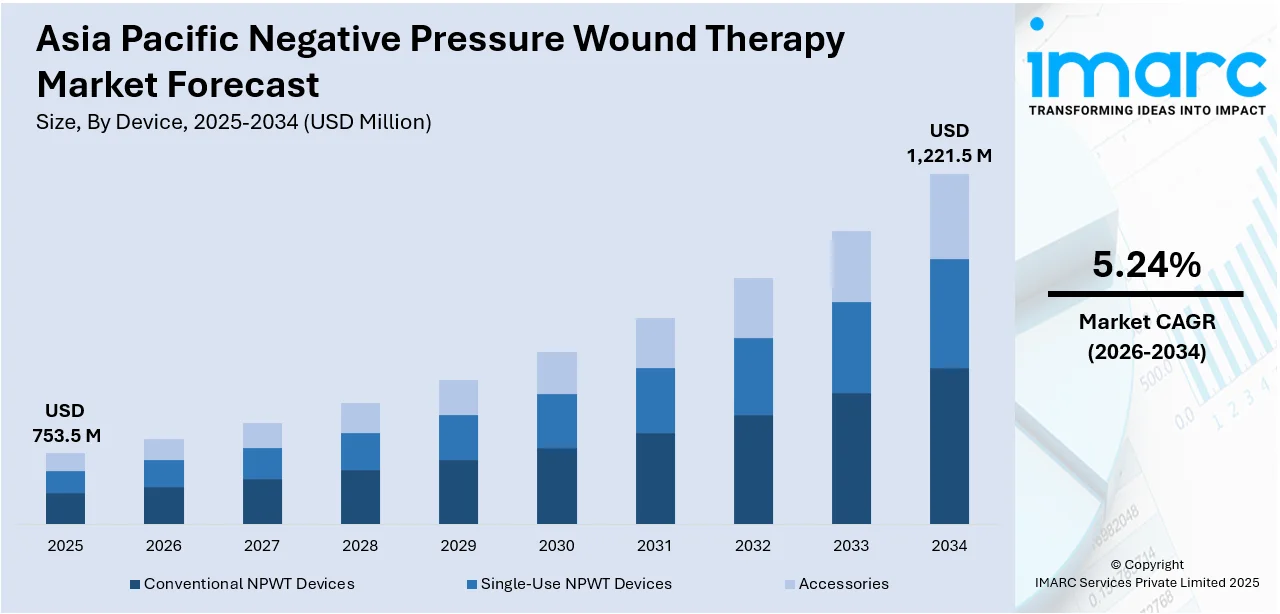
The Asia Pacific negative pressure wound therapy market size was valued at USD 753.5 Million in 2025. Looking forward, IMARC Group estimates the market to reach USD 1,221.5 Million by 2034, exhibiting a CAGR of 5.24% from 2026-2034. Rising prevalence of chronic and acute wounds, increasing diabetes cases, growing geriatric population, advancements in NPWT technologies, expanding healthcare infrastructure, demand for homecare solutions, supportive reimbursement policies, skilled professionals, awareness of wound care benefits, and growing ambulatory care services are some of the factors positively impacting the Asia Pacific negative pressure wound therapy market share.
|
Report Attribute
|
Key Statistics
|
|---|---|
|
Base Year
|
2025
|
|
Forecast Years
|
2026-2034
|
|
Historical Years
|
2020-2025
|
|
Market Size in 2025
|
USD 753.5 Million |
|
Market Forecast in 2034
|
USD 1,221.5 Million |
| Market Growth Rate (2026-2034) | 5.24% |
The market in Asia Pacific is predominantly driven by the growing prevalence of chronic and acute wounds requiring advanced treatment options. In parallel, the increasing number of geriatric patients with a greater susceptibility to pressure ulcers and diabetic foot ulcers is also driving the market. In addition, the increase in usage of advanced wound care products by healthcare professionals is becoming a major growth enhancer for the market. According to latest research studies, patients treated with Negative Pressure Wound Therapy (NPWT) showed reduced organism load by significant figures (P = 0.0078) and exhibited relatively shorter stay in mean hospital stay (P = 0.0001) as well, thus proving efficient toward faster recovery. NPWT was significantly effective for wounds in patients under 40 years with wound durations of less than 10 days. Enhanced granulation tissue formation was observed in NPWT-treated cases, with minor complications, demonstrating its superiority over conventional wound management methods in this rural tertiary care setting. Besides this, the growing demand for homecare settings due to the convenience and cost-effectiveness is creating growth opportunities in the market.
To get more information on this market Request Sample
Additionally, the consistent development of technologies in negative pressure wound therapy devices is favorably impacting the Asia Pacific negative pressure wound therapy market growth. Furthermore, increasing healthcare infrastructure investments and rising availability of qualified professionals are increasing the use of new treatments. Further factors driving the market are supportive reimbursement policies and advanced initiatives promoting the management of wounds. Besides, growing awareness of patients about the advantages of negative pressure wound therapy is driving the market. Some other factors which drive the market include rapid urbanization, the growing incidence of diabetes and obesity, and extensive R&D activities.
Asia Pacific Negative Pressure Wound Therapy Market Trends:
Rising Prevalence of Surgical Site Infections
The increasing occurrence of surgical site infections (SSIs) is significantly influencing Asia Pacific negative pressure wound therapy market demand. This trend stems from a higher volume of surgical procedures performed due to advancements in medical technology and access to healthcare. SSIs often require advanced wound management solutions to prevent complications, making negative pressure wound therapy (NPWT) an essential treatment option. Additionally, healthcare providers are prioritizing evidence-based practices that emphasize the efficacy of NPWT in reducing hospital stays and minimizing infection risks. Hospitals and clinics in emerging economies are adopting these solutions as part of broader efforts to improve surgical outcomes. As per latest industry reports, around 84,176 NPWT procedures were performed in China in 2022. This rise in adoption is further reinforced by the availability of cost-efficient NPWT devices tailored to meet regional demands.
Growth in Ambulatory Care Services
The Asia Pacific negative pressure wound therapy market outlook is positively shaped by the expansion of ambulatory care services across the region. These facilities offer outpatient surgical procedures, requiring efficient post-operative wound care solutions that align with shorter recovery times. NPWT is increasingly integrated into these settings due to its portability, ease of use, and effectiveness in managing complex wounds. The focus on providing quality care at reduced costs in ambulatory care centers has made them a key market driver. In 2019–20, older adults in Australia accessed ambulatory mental health care at lower rates compared to the general population, with contact rates of 227.8, 221.7, and 194 per 1,000 for the 65–74, 75–84, and 85+ age groups, respectively, versus 393.2 per 1,000 for all ages. The rate of significant improvement after ambulatory episodes was lower for older adults (45.9%) than the general population (50.7%), with conditions like dementia becoming more prevalent among those aged 85 and above. Additionally, government and private sector initiatives aimed at increasing the number of these facilities are accelerating the adoption of NPWT devices, particularly compact, single-use systems that cater to outpatient environments.
Growing Awareness of Personalized Wound Care Solutions
Increased awareness of tailored wound care plans is one of the most popular Asia Pacific negative pressure wound therapy market trends. Consumers are seeking customized treatment programs for certain specific requirements, including chronic wounds and injuries caused by lifestyle-related disorders. Recent journal articles report on the global prevalence of chronic wounds. Healing would typically take around 30 days if conditions are perfect, but infections and other complications have been shown to delay this. Skin, covering 1.5–2 m² and accounting for 15% of body weight, underlines the importance of effective care, while materials like polyhexanide (PHMB) are widely used due to their antimicrobial properties. Historical evidence of wound care dates back 20,000–30,000 years, and emerging technologies like smart hydrogels and biopolymers are aimed at improving the effectiveness and affordability of treatment. Manufacturers are pushing back with more sophisticated NPWT devices with customizable settings for pressures and integration with digital monitoring solutions. This also works hand in hand with improving patient outcomes and satisfaction needs from healthcare providers. In addition, innovation is led by collaborations between the manufacturers of medical equipment and healthcare service providers. Such innovation leads to the provision of user-friendly, patient-centered solutions.
Asia Pacific Negative Pressure Wound Therapy Industry Segmentation:
IMARC Group provides an analysis of the key trends in each segment of the Asia Pacific negative pressure wound therapy market, along with forecasts at the country and regional levels from 2026-2034. The market has been categorized based on device, component, wound type, indication, and end user.
Analysis by Device:
- Conventional NPWT Devices
- Single-Use NPWT Devices
- Accessories
Conventional NPWT devices lead the market in 2025. The dominance of conventional NPWT devices in 2025 is attributed to their proven effectiveness in managing a wide range of complex and chronic wounds. These devices are widely adopted in hospitals and clinics due to their ability to offer customizable therapy settings, making them highly versatile for treating wounds with varying degrees of severity. Their durability and established use in clinical settings further bolster their market share. The growing preference for single-use NPWT devices complements this trend, particularly in home care and ambulatory surgical centers, where portability and ease of use are prioritized.
Analysis by Component:
- Canisters and Dressings
- Pumps
Pumps lead the market in 2025, reflecting their indispensable role in wound therapy systems. As the core component of these systems, pumps ensure the consistent application of negative pressure to facilitate wound healing by promoting tissue granulation, removing exudate, and reducing bacterial load. Innovations in pump technology, including quieter operation, lightweight designs, and improved user interfaces, drive their increasing adoption across diverse healthcare settings. These advancements improve both patient compliance and healthcare provider efficiency, making pumps the preferred choice for wound care solutions. The Asia Pacific region’s growing healthcare investments, increasing chronic disease prevalence, and rising adoption of advanced wound care products underscore the continued prominence of pumps as a leading component in the NPWT market.
Analysis by Wound Type:
- Chronic Wounds
- Acute Wounds
Chronic wounds represent the largest segment in the NPWT market in 2025, driven by the increasing prevalence of diabetes, vascular diseases, and aging populations across the Asia Pacific region. These wounds require prolonged care and advanced treatment solutions, making NPWT an essential modality for promoting healing and preventing complications. The therapy’s ability to enhance granulation tissue formation and manage exudate effectively has solidified its role in addressing chronic wound challenges. Acute wounds, such as surgical and traumatic wounds, also show strong growth potential due to the rising demand for advanced post-surgical care solutions. NPWT’s efficacy in expediting wound closure, minimizing infection risk, and improving recovery times positions it as an invaluable tool in managing these wounds. In a study of 255 patients, those treated with NPWT had significantly fewer blister occurrences (95% vs. 87.4%, P = 0.05) and required fewer dressing changes when BMI was <30 (0.8% vs. 33.3%). NPWT patients had a longer hospital stay (5.18 days vs. 4.55 days, P = 0.01), likely due to a higher proportion undergoing bilateral surgeries. The study, conducted between 2018 and 2022, highlights NPWT’s effectiveness in improving wound outcomes after total knee arthroplasty. Awareness campaigns and educational initiatives regarding advanced wound care solutions further support the adoption of NPWT across chronic wound types.
Analysis by Indication:
- Surgical and Traumatic Wounds
- Pressure Ulcers
- Venous Ulcers
- Diabetic Foot Ulcer
- Burns
- Others
Diabetic foot ulcer leads the market in 2025, driven by the increasing prevalence of diabetes and the growing awareness of advanced wound care solutions. NPWT has become a standard of care for managing diabetic foot ulcers due to its ability to promote tissue growth, reduce infection risks, and minimize the need for amputations. Pressure ulcers also account for a significant share, with their prevalence increasing among aging populations and immobile patients in healthcare facilities. The demand for NPWT in treating venous ulcers has risen due to its proven effectiveness in managing these challenging wound types by facilitating venous return and promoting healing. This segment’s growth is further supported by increasing healthcare investments, technological advancements in NPWT systems, and the rising focus on patient-centric wound care solutions across the Asia Pacific region.
Analysis by End User:
Access the comprehensive market breakdown Request Sample
- Hospitals and Clinics
- Ambulatory Surgical Centers
- Home Care Settings
- Others
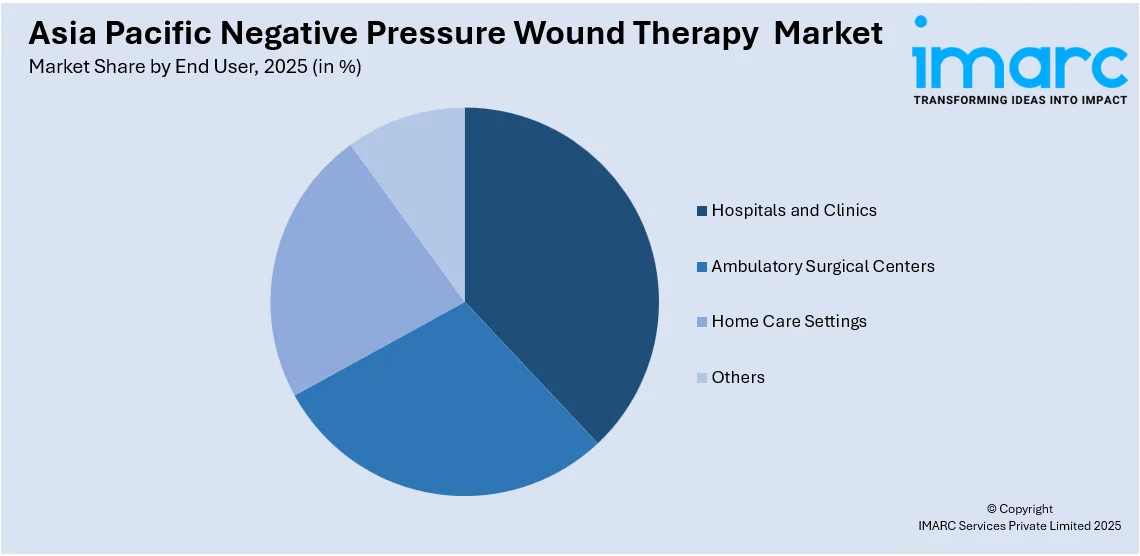
Hospitals and clinics dominate the NPWT market in 2025 due to their access to advanced wound care systems, skilled healthcare professionals, and the ability to manage complex wound cases. These facilities remain the primary point of care for chronic and acute wounds, making them the largest consumers of NPWT systems.
Ambulatory surgical centers are emerging as a significant segment due to the rising demand for cost-effective outpatient procedures and shorter hospital stays. These centers increasingly adopt portable and single-use NPWT devices to enhance recovery outcomes for surgical patients. Increased healthcare awareness, government support for advanced wound care technologies, as well as the expansion of healthcare infrastructure further fuel the growth of this end-user segment.
Home care settings are witnessing rapid growth, supported by the convenience and accessibility of NPWT systems designed for at-home use. Single-use devices, in particular, are gaining traction among patients requiring long-term care, reducing the need for frequent hospital visits. These trends reflect a growing preference for decentralized and patient-centric care models in the Asia Pacific region, thereby augmenting the growth of the segment.
Analysis by Country:
- China
- Japan
- India
- South Korea
- Australia
- Indonesia
- Others
China leads the market in 2025, supported by a robust healthcare infrastructure, growing diabetic population, and significant government initiatives aimed at promoting advanced wound care. The country's strong manufacturing capabilities also enable the availability of cost-effective NPWT devices, driving their adoption in hospitals, clinics, and home care settings. Japan remains a key contributor, with its aging population and technological advancements in medical devices spurring the demand for innovative wound care solutions. Several regions in China are placing their focus on adopting innovative healthcare solutions and enhancing patient outcomes. Other emerging markets in the region demonstrate promising opportunities due to increasing healthcare investments and rising awareness of advanced wound management practices.
Competitive Landscape:
Key players in the market are implementing strategic initiatives to ensure sustained growth by focusing on introducing technologically advanced NPWT devices that enhance patient outcomes and improve usability. These innovations include portable, lightweight devices and systems with integrated digital monitoring capabilities. To expand their market presence, these firms are investing in strategic collaborations and acquisitions, enabling broader access to distribution networks and healthcare providers. As per the Asia Pacific negative pressure wound therapy market report, key players are prioritizing regulatory compliance and adhering to quality standards to gain approval for new products in different regions. Marketing efforts are emphasizing the cost-effectiveness and therapeutic benefits of NPWT, aimed at increasing adoption among healthcare professionals.
The report provides a comprehensive analysis of the competitive landscape in the Asia Pacific negative pressure wound therapy market with detailed profiles of all major companies.
Latest News and Developments:
- On March 18, 2024, KeAi Communications Co., Ltd. reported that Chinese researchers have developed microneedle-based dressings to enhance diabetic wound healing. These microneedles facilitate efficient drug delivery to wound beds, offering advantages over traditional dressings. This innovation complements existing treatments, including negative pressure wound therapy, by providing a minimally invasive option for managing diabetic wounds.
- On July 12, 2024, Seoul-based CGBIO announced its participation in the Florida International Medical Expo (FIME) 2024, held at the Miami Beach Convention Center in Florida, USA. At this event, CGBIO showcased its surgical and Negative Pressure Wound Therapy (NPWT) products, including CURASYS2 and CURAVAC, to medical professionals and distributors from Latin America. This initiative aligns with CGBIO's strategy to strengthen its position in the global medical device market by expanding its presence in the growing Latin American healthcare sector.
- On February 2, 2024, PT Darya-Varia Laboratoria Tbk formalized a strategic partnership with PT Bersama Indonesia Gerakkan and PT Anugerah Pharmindo Lestari to market WELSUC Negative Pressure Wound Therapy (NPWT) healthcare products in Indonesia. This collaboration aims to address the limited availability of NPWT machines in the country by leveraging the extensive distribution networks and strong reputations of the companies involved.
Asia Pacific Negative Pressure Wound Therapy Market Report Scope:
| Report Features | Details |
|---|---|
| Base Year of the Analysis | 2025 |
| Historical Period | 2020-2025 |
| Forecast Period | 2026-2034 |
| Units | Million USD |
| Scope of the Report |
Exploration of Historical Trends and Market Outlook, Industry Catalysts and Challenges, Segment-Wise Historical and Future Market Assessment:
|
| Devices Covered | Conventional NPWT Devices, Single-Use NPWT Devices, Accessories |
| Components Covered | Canisters and Dressings, Pumps |
| Wound Types Covered | Chronic Wounds, Acute Wounds |
| Indications Covered | Surgical and Traumatic Wounds, Pressure Ulcers, Venous Ulcers, Diabetic Foot Ulcer, Burns, Others |
| End Users Covered | Hospitals and Clinics, Ambulatory Surgical Centers, Home Care Settings, Others |
| Countries Covered | China, Japan, India, South Korea, Australia, Indonesia, Others |
| Customization Scope | 10% Free Customization |
| Post-Sale Analyst Support | 10-12 Weeks |
| Delivery Format | PDF and Excel through Email (We can also provide the editable version of the report in PPT/Word format on special request) |
Key Benefits for Stakeholders:
- IMARC’s report offers a comprehensive quantitative analysis of various market segments, historical and current market trends, market forecasts, and dynamics of the Asia Pacific negative pressure wound therapy market from 2020-2034.
- The research study provides the latest information on the market drivers, challenges, and opportunities in the Asia Pacific negative pressure wound therapy market.
- Porter's Five Forces analysis assists stakeholders in assessing the impact of new entrants, competitive rivalry, supplier power, buyer power, and the threat of substitution. It helps stakeholders to analyze the level of competition within the Asia Pacific negative pressure wound therapy industry and its attractiveness.
- Competitive landscape allows stakeholders to understand their competitive environment and provides an insight into the current positions of key players in the market.
Frequently Asked Questions About the Asia Pacific Negative Pressure Wound Therapy Market Report
The Asia Pacific negative pressure wound therapy market was valued at USD 753.5 Million in 2025.
The growth of the Asia Pacific negative pressure wound therapy market is driven by the rising prevalence of chronic wounds, increasing diabetes cases, growing geriatric populations, advancements in wound care technologies, and expanding healthcare infrastructure. Greater awareness and adoption of cost-effective wound management solutions also contribute significantly.
The Asia Pacific negative pressure wound therapy market is projected to exhibit a CAGR of 5.24% during 2026-2034, reaching a value of USD 1,221.5 Million by 2034.
Conventional NPWT devices dominate the Asia Pacific negative pressure wound therapy market due to their widespread use in managing complex wounds and proven effectiveness in clinical settings. They are preferred for treating severe or large wounds, offering consistent outcomes.
China holds the largest regional market share in the Asia Pacific due to its vast population, expanding healthcare spending, and the widespread awareness of advanced wound care solutions. Government initiatives further support the adoption of NPWT devices.
Need more help?
- Speak to our experienced analysts for insights on the current market scenarios.
- Include additional segments and countries to customize the report as per your requirement.
- Gain an unparalleled competitive advantage in your domain by understanding how to utilize the report and positively impacting your operations and revenue.
- For further assistance, please connect with our analysts.
 Request Customization
 Speak to an Analyst
 Request Brochure
 Inquire Before Buying
Benefits of Customization
- Personalize this research
- Triangulate with your data
- Get data as per your format and definition
- Gain a deeper dive into a specific application, geography, customer, or competitor
- Any level of personalization
Get in Touch With Us
UNITED STATES
Phone: +1-201-971-6302
INDIA
Phone: +91-120-433-0800
UNITED KINGDOM
Phone: +44-753-714-6104
Email: [email protected]
Client Testimonials


.webp)


