
Asia Pacific Signal Generator Market Size, Share, Trends and Forecast by Product, Technology, Application, End Use, and Country, 2026-2034
Market Overview:
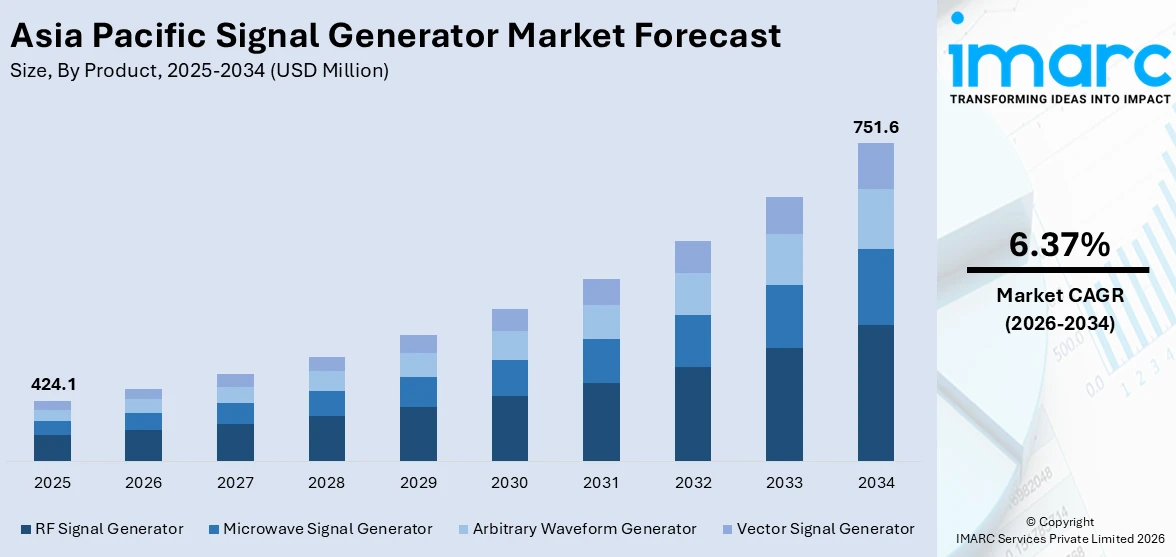
The Asia Pacific signal generator market size reached USD 424.1 Million in 2025. Looking forward, IMARC Group expects the market to reach USD 751.6 Million by 2034, exhibiting a growth rate (CAGR) of 6.37% during 2026-2034.
|
Report Attribute
|
Key Statistics
|
|---|---|
|
Base Year
|
2025
|
|
Forecast Years
|
2026-2034
|
|
Historical Years
|
2020-2025
|
|
Market Size in 2025
|
USD 424.1 Million |
|
Market Forecast in 2034
|
USD 751.6 Million |
| Market Growth Rate (2026-2034) | 6.37% |
A signal generator produces electric signals in the form of a wave. They are also known as frequency synthesizers and are commonly used for designing, manufacturing, troubleshooting and repairing electronic devices and systems. Some of the commonly available signal generators include function, arbitrary waveform, radio frequency (RF), microwave, digital pattern and frequency generators. They find extensive applications in the telecommunication, aerospace, defense and automotive industries and the electronics manufacturing sector.
To get more information on this market Request Sample
The widespread adoption of signal generators in electric vehicles (EVs) for testing and troubleshooting sensors is one of the key factors driving the market growth. Automobile manufacturers also use signal generators to test in-car entertainment systems, reverse parking sensors and remote keys. Furthermore, the growing utilization of Long-Term Evolution (LTE) service and the development of effective wireless and Bluetooth services, are providing a thrust to the market growth. This, along with the adoption of the fifth generation (5G) technology in mobile computing devices and cellular services, has enhanced the utilization of signal generators for high-speed serial data signals. This, in turn, is expected to create a positive outlook for the market further.
Key Market Segmentation:
IMARC Group provides an analysis of the key trends in each sub-segment of the Asia Pacific signal generator market report, along with forecasts at the regional and country level from 2026-2034. Our report has categorized the market based on product, technology, application, and end use.
Breakup by Product:
- RF Signal Generator
- Microwave Signal Generator
- Arbitrary Waveform Generator
- Vector Signal Generator
Breakup by Technology:
- Global System for Mobile Phones (GSM)
- Code Division Multiple Access (CDMA)
- Wideband Code Division Multiple Access (WCDMA)
- Long Term Evolution (LTE)
- Others
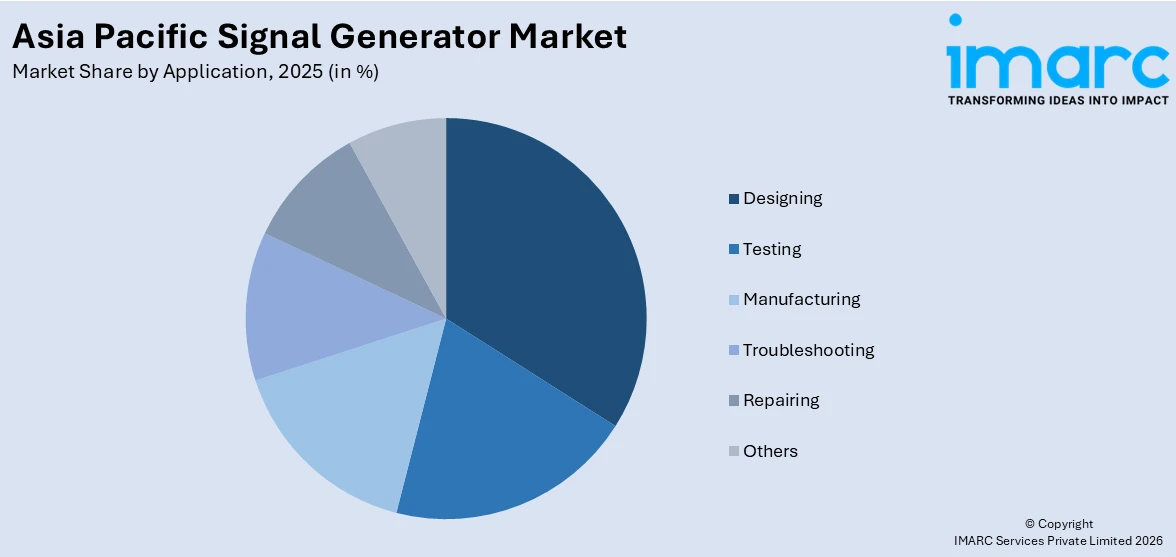
Breakup by Application:
Access the comprehensive market breakdown Request Sample
- Designing
- Testing
- Manufacturing
- Troubleshooting
- Repairing
- Others
Breakup by End Use:
- Communication Industry
- Aerospace and Defense Industry
- Mechanical Industry
- Electronics Industry
- Healthcare
- Others
Breakup by Country:
- China
- Japan
- India
- South Korea
- Australia
- Indonesia
- Others
Competitive Landscape:
The competitive landscape of the industry has also been examined along with the profiles of the key players.
Report Coverage:
| Report Features | Details |
|---|---|
| Base Year of the Analysis | 2025 |
| Historical Period | 2020-2025 |
| Forecast Period | 2026-2034 |
| Units | Million USD |
| Segment Coverage | Product, Technology, Application, End Use, Country |
| Countries Covered | China, Japan, India, South Korea, Australia, Indonesia, Others |
| Customization Scope | 10% Free Customization |
| Post-Sale Analyst Support | 10-12 Weeks |
| Delivery Format | PDF and Excel through Email (We can also provide the editable version of the report in PPT/Word format on special request) |
Key Questions Answered in This Report:
- How has the Asia Pacific signal generator market performed so far and how will it perform in the coming years?
- What has been the impact of COVID-19 on the Asia Pacific signal generator market?
- What are the key regional markets?
- What is the breakup of the market based on the product?
- What is the breakup of the market based on the technology?
- What is the breakup of the market based on the application?
- What is the breakup of the market based on the end use?
- What are the various stages in the value chain of the industry?
- What are the key driving factors and challenges in the industry?
- What is the structure of the Asia Pacific signal generator market and who are the key players?
- What is the degree of competition in the industry?
Need more help?
- Speak to our experienced analysts for insights on the current market scenarios.
- Include additional segments and countries to customize the report as per your requirement.
- Gain an unparalleled competitive advantage in your domain by understanding how to utilize the report and positively impacting your operations and revenue.
- For further assistance, please connect with our analysts.
 Request Customization
 Speak to an Analyst
 Request Brochure
 Inquire Before Buying
Benefits of Customization
- Personalize this research
- Triangulate with your data
- Get data as per your format and definition
- Gain a deeper dive into a specific application, geography, customer, or competitor
- Any level of personalization
Get in Touch With Us
UNITED STATES
Phone: +1-201-971-6302
INDIA
Phone: +91-120-433-0800
UNITED KINGDOM
Phone: +44-753-714-6104
Email: [email protected]
Client Testimonials


.webp)


