
Automated Fare Collection Market Size, Share, Trends and Forecast by Component, System Type, Technology, Application, and Region, 2026-2034
Automated Fare Collection Market Size, Share, Trends & Forecast (2026-2034)
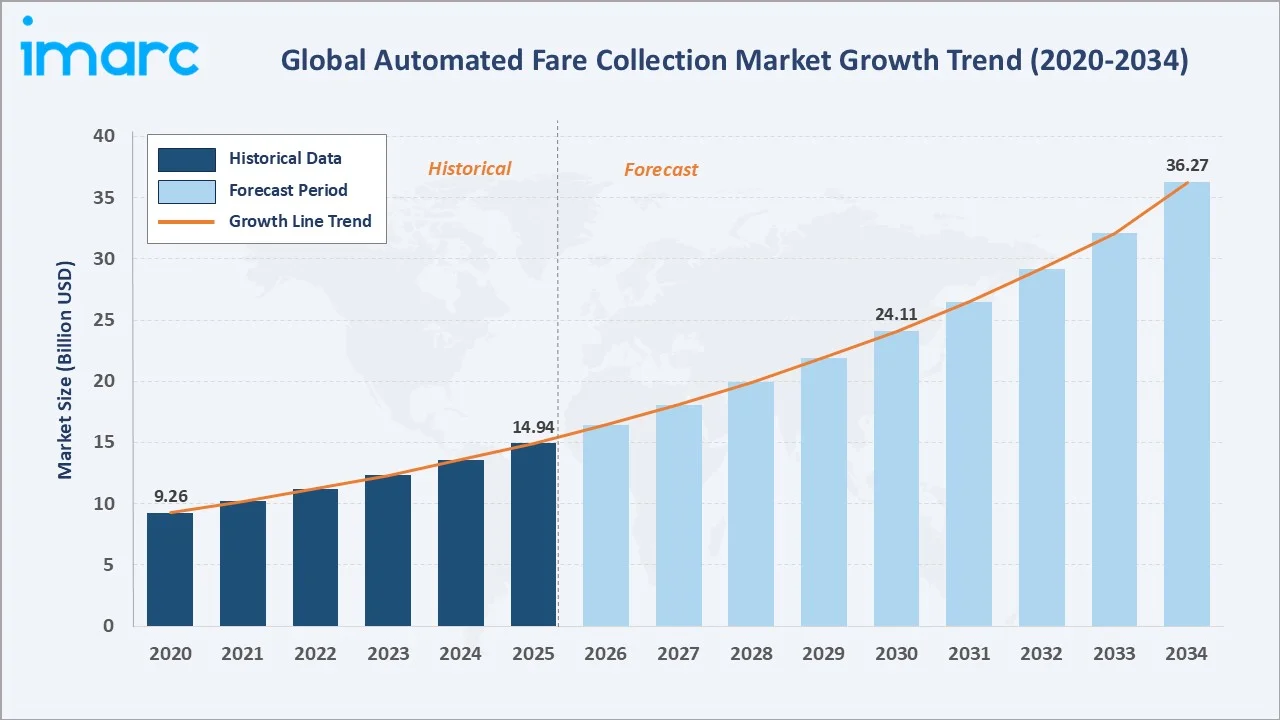
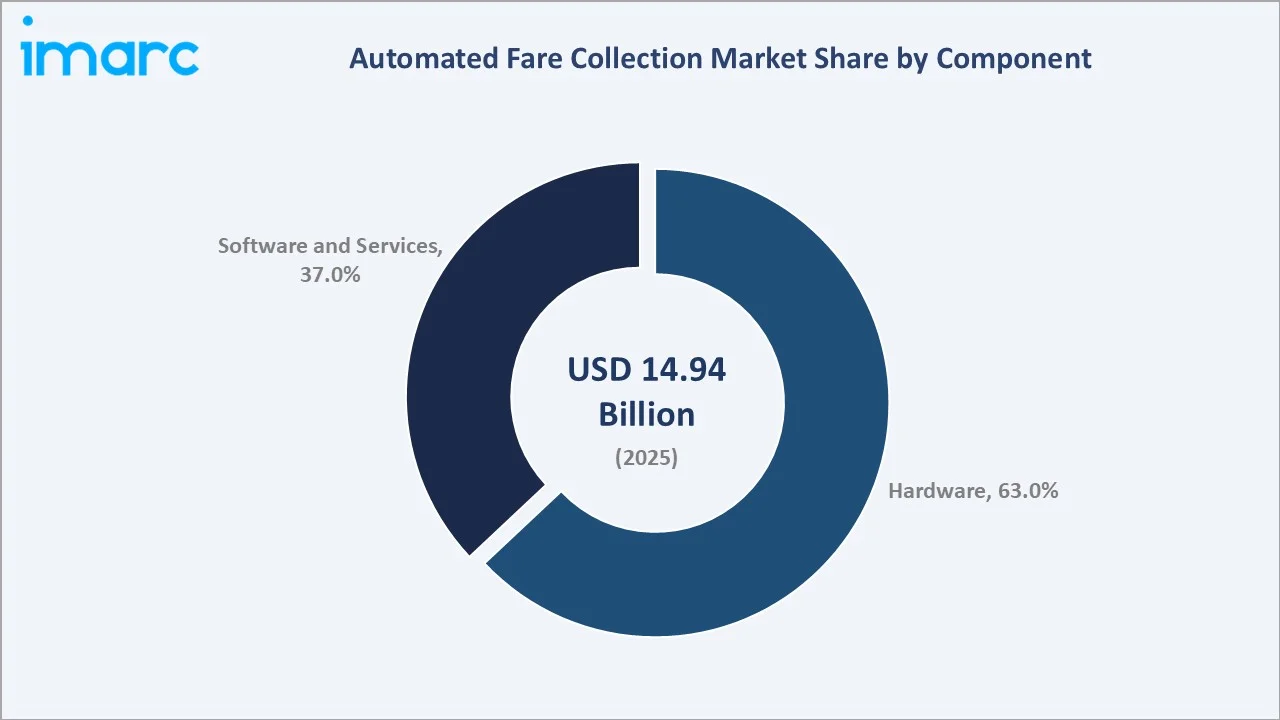
The global automated fare collection market reached USD 14.94 Billion in 2025 and is projected to reach USD 36.27 Billion by 2034, growing at a CAGR of 10.04% during 2026-2034. The market is driven by increasing investments in smart transportation infrastructure, urban transit modernization, and digital payment adoption. Growing demand for contactless, seamless, and efficient passenger ticketing systems across metro, bus, rail, and multimodal transport networks is further accelerating market growth. India’s metro network expanded significantly from 248 km in 2014 to 1,013 km in 2025, supported by investments of ₹2.5 lakh crore (USD 28.86 billion), and domestic production of more than 2,000 metro coaches. As metro networks scale, transit operators require faster, secure, and interoperable AFC solutions to manage high passenger volumes and improve commuter convenience. Hardware leads the component at 63.0%. Smart card leads technology at 46.0%. North America leads regionally at 35.0%.
Market Snapshot
|
Metric |
Value |
|
Market Size (2025) |
USD 14.94 Billion |
|
Forecast Market Size (2034) |
USD 36.27 Billion |
|
CAGR (2026-2034) |
10.04% |
|
Base Year |
2025 |
|
Historical Period |
2020-2025 |
|
Forecast Period |
2026-2034 |
|
Dominant Component |
Hardware (63.0%, 2025) |
|
Dominant Technology |
Smart Card (46.0%, 2025) |
|
Leading Region |
North America (35.0%, 2025) |
The global automated fare collection (AFC) market is growing rapidly, increasing from USD 9.26 billion in 2020 to USD 14.94 billion in 2025. It is projected to reach USD 24.11 billion by 2030 and further expand to USD 36.27 billion by 2034. Growth is supported by rising investments in smart transit systems, digital ticketing, and contactless payment infrastructure. Increasing urbanization, metro rail expansion, and demand for seamless multimodal mobility are expected to strengthen market adoption over the forecast period.
To get more information on this market, Request Sample
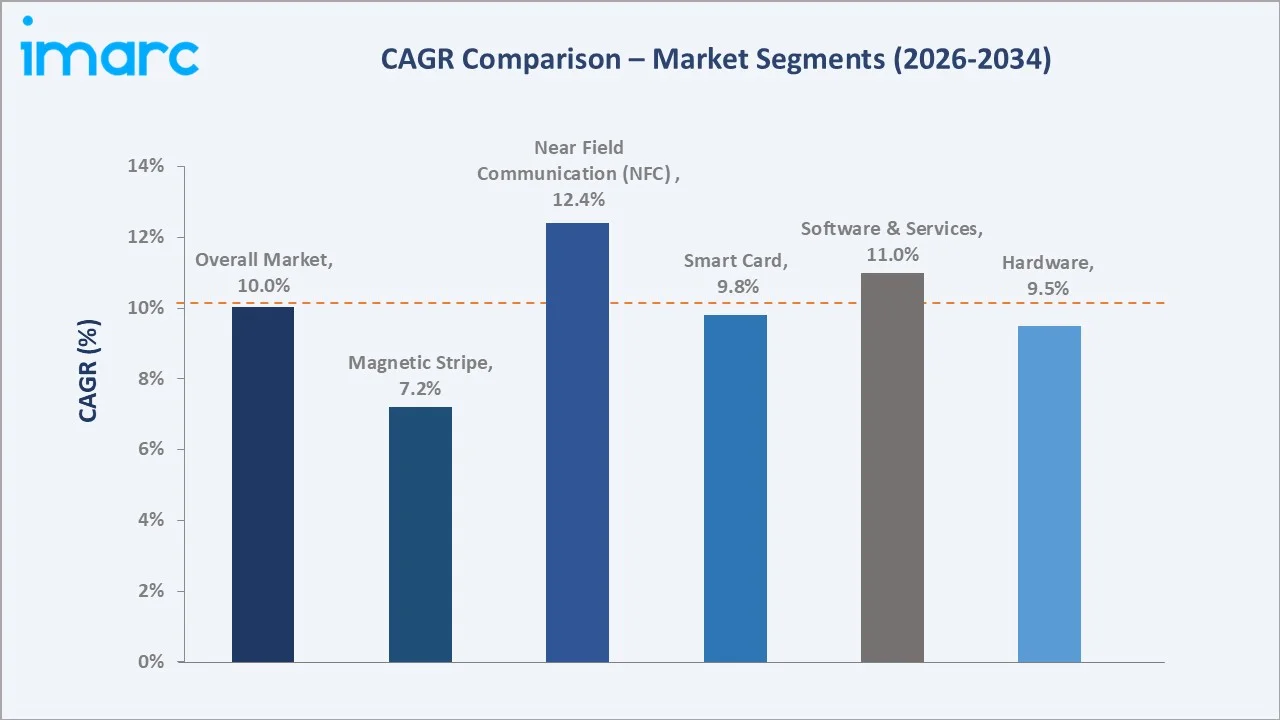
Software and Services grows fastest at ~11.0% CAGR through Account-Based Ticketing (ABT), MaaS platform, cloud AFC SaaS, and AI-driven fare optimization. Near field communication (NFC) grows at ~12.4% CAGR through open-loop EMV contactless bank card and Google Pay transit acceptance.
Executive Summary
The global automated fare collection market is growing strongly, supported by smart transit modernization, metro expansion, and rising digital payment adoption. Market value increased from USD 9.26 billion in 2020 to USD 14.94 billion in 2025 and is projected to reach USD 36.27 billion by 2034. Demand is driven by contactless ticketing, QR payments, smart cards, and interoperable fare systems. Rapid urbanization and multimodal transport integration are further encouraging AFC deployment. Overall, the market outlook remains positive as cities invest in efficient, secure, and passenger-friendly mobility infrastructure. Hardware at 63.0% leads through gates, TVMs, and validators. Smart card at 46.0% leads the market. North America leads regionally at 35.0%.
Key Market Insights
|
Insight |
Data |
|
Dominant Component |
Hardware - 63.0% share (2025) |
|
Dominant Technology |
Smart Card - 46.0% market share (2025) |
|
Leading Region |
North America - 35.0% share (2025) |
|
Market Opportunity |
Open-loop EMV contactless bank card transit; account-based ticketing ABT cloud; MaaS multi-modal platform; AI-driven dynamic pricing; biometric face-pay fare gate; APAC urbanization metro rail expansion |
Key Analytical Observations Supporting The Above Data:
- Hardware at 63.0%: The hardware dominates as AFC systems require physical infrastructure such as ticket vending machines, fare gates, validators, smart card readers, and point-of-sale terminals. Continuous deployment of metro, bus, and rail networks keeps hardware demand strong.
- Smart Card at 46.0%: The smart card dominates due to its reliability, fast transaction processing, and widespread adoption across metro, rail, and bus transit systems. Smart cards enable secure, reusable, and convenient fare payments while supporting high passenger throughput in busy transportation networks.
- North America at 35.0%: North America dominates regionally due to its advanced public transit infrastructure, high adoption of contactless payments, and strong investment in smart mobility systems.
Automated Fare Collection Market Overview
The global automated fare collection market encompasses transit fare payment hardware, software and services platforms, and technology interfaces across transit modes, including metro rail, bus rapid transit, commuter rail, light rail, ferry, and highway tolling. The market’s uniqueness lies in its role as a core enabler of smart, cashless, and seamless public mobility. It connects hardware, software, digital payments, and passenger data analytics to improve fare collection efficiency, reduce queues, and support multimodal transport integration. Macroeconomic factors include rapid urbanization, increasing public transportation investments, and government spending on smart city and transit infrastructure projects.
Market Dynamics
To evaluate market opportunities, Request Sample
Market Drivers
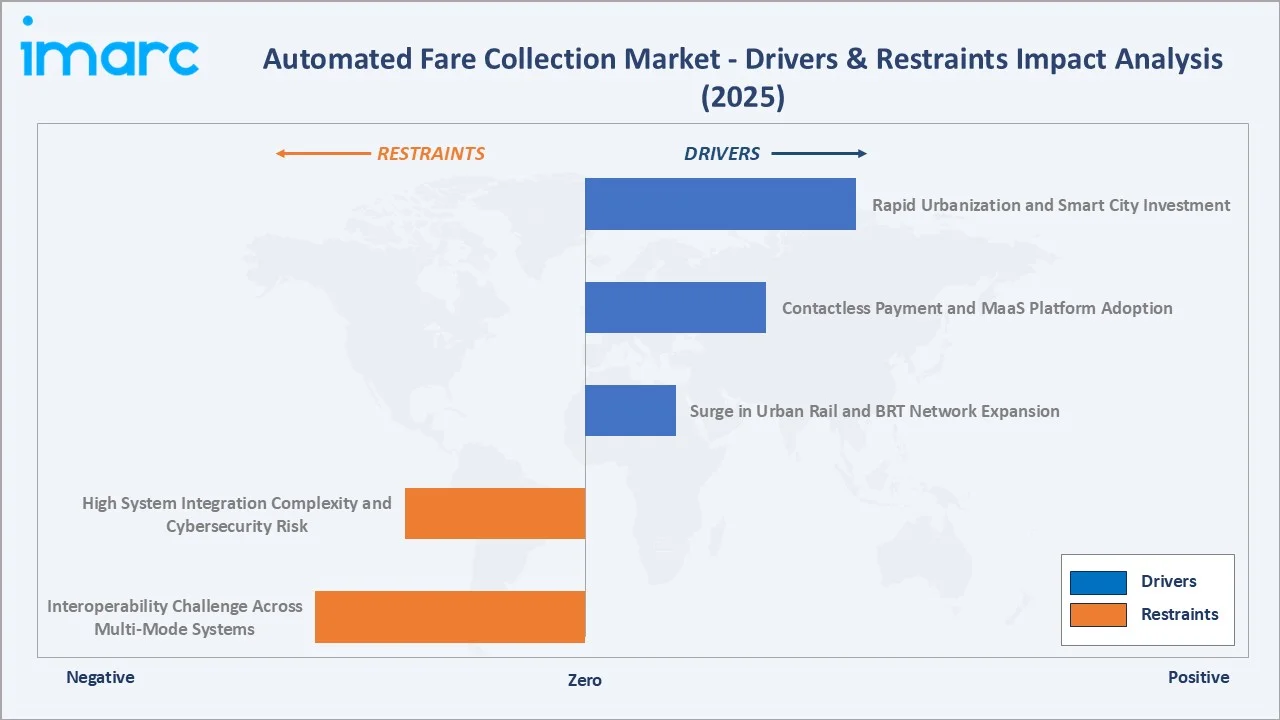
- Rapid Urbanization and Smart City Investment: Around 55% of the global population currently lives in urban areas, and this share is projected to rise to 68% by 2050. United Nations projections indicate that urbanization and population growth could add about 2.5 billion people to cities by 2050, with nearly 90% of this increase expected in Asia and Africa. This rapid urbanization and smart city investment are major drivers as growing urban populations increase reliance on public transportation systems. Governments are investing heavily in smart cities, metro rail networks, bus rapid transit systems, and integrated mobility platforms that require efficient fare management solutions.
- Contactless Payment and MaaS Platform Adoption: Contactless payment and MaaS platform adoption, enabling faster, cashless, and more convenient passenger transactions. Digital transactions increased from 222 crore transactions worth Rs. 772 lakh crore in CY 2013 to 20,787 crore transactions valued at Rs. 2,758 lakh crore in CY 2024. Smart cards, QR codes, NFC wallets, and open-loop bank card payments reduce queues and improve boarding efficiency across metro, bus, and rail networks. MaaS platforms further support integrated trip planning, ticketing, and payments across multiple transport modes. As cities move toward seamless digital mobility, demand for interoperable AFC systems continues to rise.
- Surge in Urban Rail and BRT Network Expansion: Surge in urban rail and BRT network expansion is driving the market as new metro, light rail, commuter rail, and bus rapid transit corridors require efficient ticketing infrastructure. Growing passenger volumes increase the need for fare gates, validators, smart cards, QR ticketing, and account-based payment systems. AFC solutions help reduce queues, speed up boarding, and improve revenue collection for transit operators. As cities expand multimodal transport networks, interoperable fare systems are becoming essential for seamless passenger movement.
Market Restraints
- High System Integration Complexity and Cybersecurity Risk: AFC platforms must connect fare gates, validators, payment gateways, mobile apps, smart cards, and back-office systems. Integrating these components across multiple transport operators can increase deployment time, cost, and technical challenges. As AFC systems handle passenger data and digital payments, they are also exposed to risks such as data breaches, payment fraud, and system hacking. These concerns make strong cybersecurity, interoperability standards, and continuous system monitoring essential for market adoption.
- Interoperability Challenge Across Multi-Mode Systems: Different transport modes often operate on separate ticketing technologies, payment standards, and back-office platforms. Integrating metro, bus, rail, ferry, and shared mobility services into a unified fare system can be technically complex and costly. Lack of standardization may result in fragmented passenger experiences and limited fare integration. These challenges can delay smart mobility initiatives and increase implementation and maintenance expenses for transit authorities.
Market Opportunities
- Contactless and Cashless Ticketing Solutions: Contactless and cashless ticketing solutions present a strong opportunity as transit operators move toward faster, safer, and more convenient passenger payments. QR codes, smart cards, NFC wallets, and open-loop bank card payments reduce ticket queues and improve station throughput. In April 2026, the Automatic Fare Collection system was launched at Bhopal and Indore metro stations by Madhya Pradesh Metro Rail Corporation Limited. With this modern electronic and cashless ticketing system, passengers no longer need to wait in long ticket queues and can enter and exit metro stations digitally. As metro, bus, and rail networks modernize, demand for secure and interoperable digital ticketing platforms is expected to grow.
- Mobile Ticketing and QR Code-Based Fare Collection: Mobile ticketing and QR code-based fare collection enable passengers to buy, store, and validate tickets directly through smartphones. QR-based systems reduce dependence on physical tickets, smart cards, and cash counters, lowering operational costs for transit operators. They are easy to deploy across metro, bus, rail, and feeder services, making them suitable for expanding urban transit networks. Growing smartphone penetration and digital payment adoption further support wider use of mobile-based AFC solutions.
Market Challenges
- Legacy System Modernization and Migration Issues: Many transit networks still rely on older ticketing hardware, closed-loop smart cards, and fragmented back-office platforms. Upgrading these systems to contactless, mobile, or account-based ticketing can be costly and technically complex. Migration also requires integration with existing fare rules, passenger databases, payment systems, and operator workflows. These challenges can delay AFC upgrades and increase implementation risk for transit authorities.
- Payment Fraud and Ticketing Security Concerns: Digital fare systems are exposed to risks such as card cloning, QR code misuse, payment manipulation, and unauthorized access. As AFC platforms handle passenger data and financial transactions, any security breach can affect trust and revenue collection. Transit operators must invest in encryption, tokenization, authentication, and real-time fraud monitoring. These added security requirements increase system complexity, implementation costs, and ongoing maintenance needs.
Emerging Market Trends
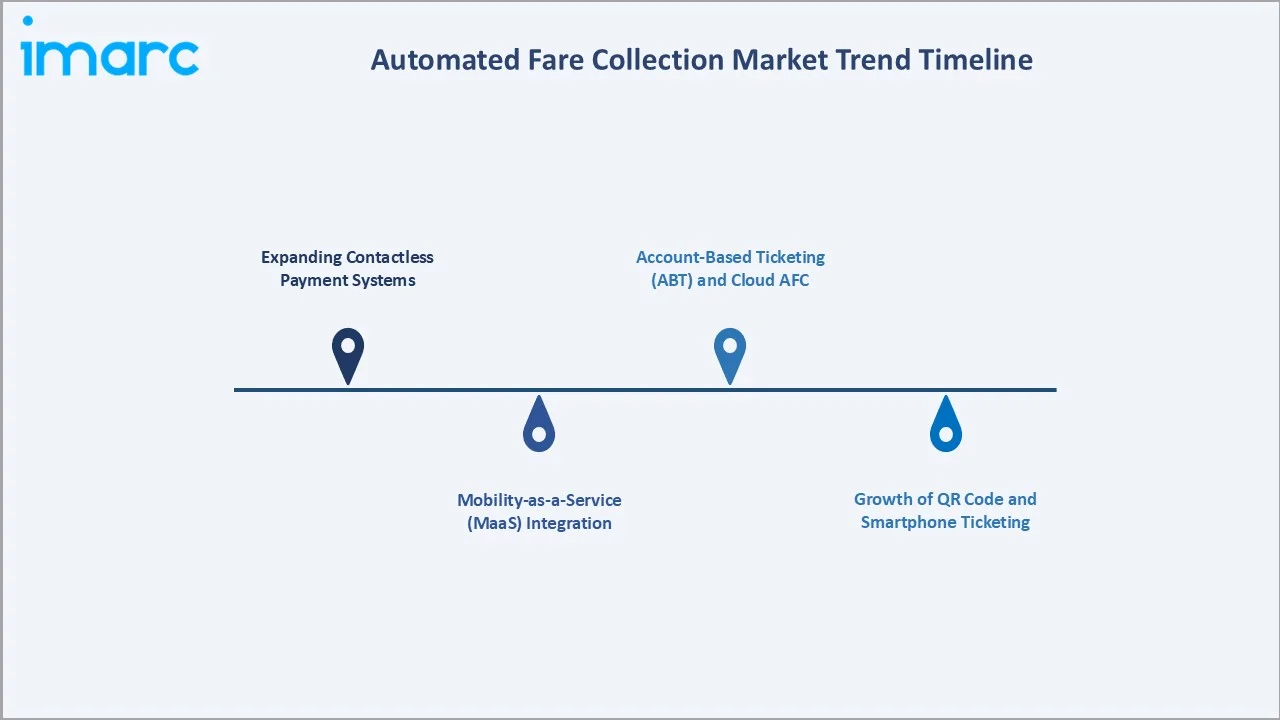
1. Expanding Contactless Payment Systems
Expanding contactless payment systems are emerging as passengers increasingly prefer fast, cashless, and touch-free travel payments. Transit operators are adopting NFC cards, mobile wallets, QR codes, and open-loop bank card payments to reduce queues and improve boarding speed. In December 2025, Conduent Transportation launched Italy’s first integrated transit EMV (Europay, Mastercard, and Visa) contactless payment system in partnership with Brescia Mobilità and Arriva Italia. The system enables passengers to use a single ticket across Brescia Mobilità’s urban network and Arriva Italia’s extra-urban network by paying with contactless debit or credit cards or NFC-enabled digital wallets. These systems enhance passenger convenience while lowering cash-handling and ticketing costs.
2. Account-Based Ticketing (ABT) and Cloud AFC
Account-based ticketing (ABT) and cloud AFC are emerging as transit operators shift fare logic from physical cards to centralized digital accounts. This allows passengers to use multiple identifiers, such as smart cards, QR codes, mobile wallets, or bank cards, while fares are calculated in the back office. Cloud-based AFC reduces infrastructure complexity, enables faster updates, and supports scalable deployment across metro, bus, rail, and multimodal networks. These systems also improve data analytics, revenue management, and integration with MaaS platforms.
3. Mobility-as-a-Service (MaaS) Integration
Mobility-as-a-Service (MaaS) integration is emerging as cities seek to unify multiple transport modes into a single digital platform. MaaS enables passengers to plan, book, pay for, and access metro, bus, rail, ride-hailing, bike-sharing, and other mobility services through one application. This requires interoperable AFC systems capable of supporting seamless fare payments across different operators and transport networks. As demand for connected and user-centric mobility grows, MaaS integration is driving the adoption of advanced, cloud-based, and account-based fare collection solutions.
4. Growth of QR Code and Smartphone Ticketing
QR code and smartphone ticketing are emerging as passengers increasingly prefer mobile-based, cashless, and card-free fare payments. These systems allow users to purchase, store, and validate tickets through smartphones, reducing queues and dependence on physical ticket counters. In February 2026, Uttar Pradesh Metro Rail Corporation (UPMRC) launched a QR code-based ticketing system for Lucknow Metro, allowing commuters to book tickets from home through the official “Lucknow Metro Official” mobile app on Android and iOS. For operators, QR ticketing lowers card issuance costs and supports faster deployment across metro, bus, and rail networks.
Industry Value Chain Analysis
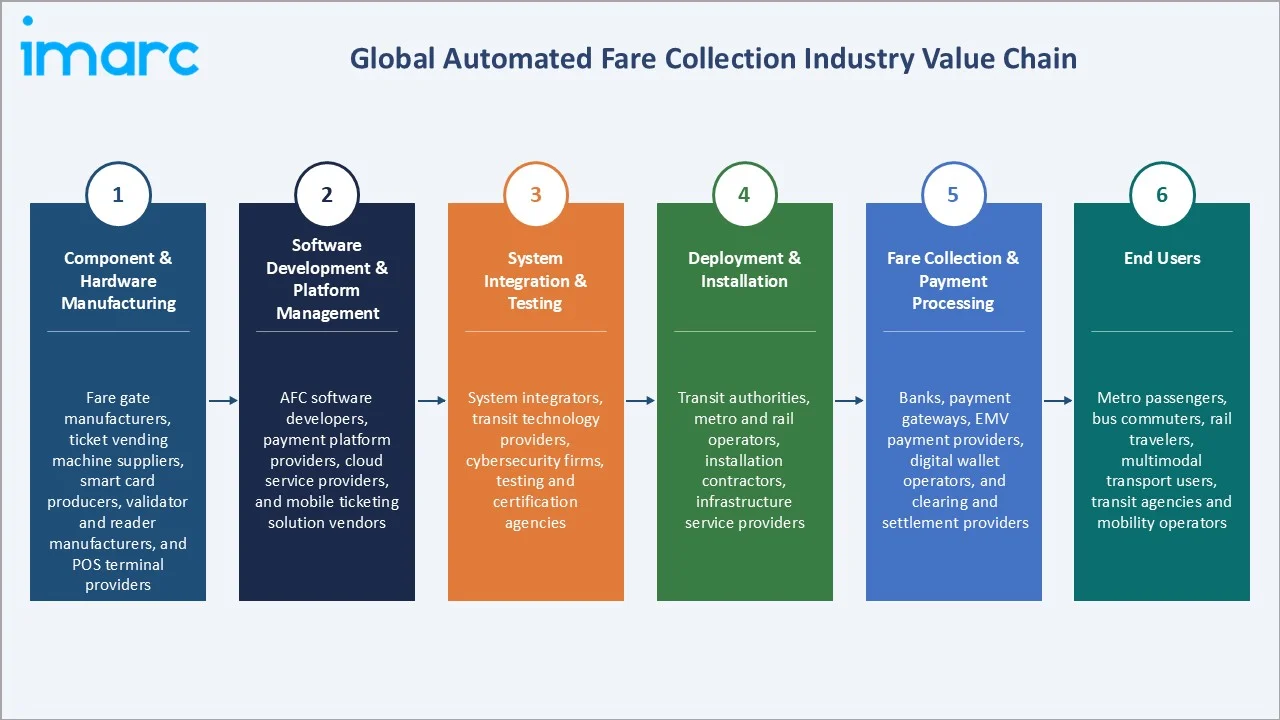
The global automated fare collection value chain integrates component & hardware manufacturing, software development & platform management, system integration & testing, deployment & installation, fare collection & payment processing, and end users.
|
Stage |
Key Participants |
|
Component & Hardware Manufacturing |
Fare gate manufacturers, ticket vending machine suppliers, smart card producers, validator and reader manufacturers, and POS terminal providers |
|
Software Development & Platform Management |
AFC software developers, payment platform providers, cloud service providers, and mobile ticketing solution vendors |
|
System Integration & Testing |
System integrators, transit technology providers, cybersecurity firms, testing and certification agencies |
|
Deployment & Installation |
Transit authorities, metro and rail operators, installation contractors, infrastructure service providers |
|
Fare Collection & Payment Processing |
Banks, payment gateways, EMV payment providers, digital wallet operators, and clearing and settlement providers |
|
End Users |
Metro passengers, bus commuters, rail travelers, multimodal transport users, transit agencies and mobility operators |
The software development, platform management, and system integration segment represents the highest value-added stage in the automated fare collection value chain. This layer enables fare processing, payment interoperability, account-based ticketing, cybersecurity, passenger analytics, and integration across multiple transportation modes, creating significant recurring revenue and differentiation opportunities.
Technology Landscape in the Automated Fare Collection Industry
Smart Card and NFC Technology
Smart cards and NFC technology enable fast, secure, and contactless passenger transactions. NFC-enabled smart cards and mobile devices allow commuters to tap and travel, reducing boarding times and improving throughput at stations and transit gates. These technologies support interoperability across multiple transport modes while enhancing payment security and user convenience. Their widespread adoption is accelerating the transition toward cashless, integrated, and digitally connected public transportation systems.
Cybersecurity and Fraud Prevention Technologies
AFC systems increasingly handle digital payments, passenger identities, and sensitive transaction data. Transit operators are deploying encryption, tokenization, multi-factor authentication, and real-time fraud detection tools to protect against cyberattacks, payment fraud, and unauthorized access. Advanced security frameworks also help ensure compliance with data privacy regulations and payment standards. As contactless and account-based ticketing adoption grows, robust cybersecurity capabilities are becoming essential for maintaining system reliability and passenger trust.
Virtual Transit Cards and Tokenization Technologies
Virtual transit cards and tokenization technologies enable passengers to store transit credentials securely within mobile wallets and digital applications. Tokenization replaces sensitive card information with unique digital tokens, reducing the risk of payment fraud and data breaches. These technologies support seamless fare payments across smartphones, wearables, and contactless devices while eliminating the need for physical transit cards. As transit operators move toward mobile-first and account-based ticketing models, virtual credentials and tokenized payments are becoming key enablers of secure, flexible, and interoperable fare collection systems.
Market Segmentation Analysis
The report covers the following segments:
|
Segment Category |
Leading Segment |
Market Share |
Year |
|
Component |
Hardware |
63.0% |
2025 |
|
System Type |
Ticket Vending Machine (TVM) |
🔒 |
2025 |
|
Technology |
Smart Card |
46.0% |
2025 |
|
Application |
Railways and Transportation |
🔒 |
2025 |
|
Region |
North America |
35.0% |
2025 |

By Component
Hardware leads at 63.0% (2025), through fare gates, tripod turnstiles, full-height gates, ticket vending machines (TVMs), contactless validators, point-of-sale terminals, and central AFC processing servers installed across global metro, bus, and rail transit.
To access detailed market analysis, Request Sample
Software and services at 37.0% grows fastest at ~11.0% CAGR through AFC management software, Account-Based Ticketing cloud backend (ABT), MaaS integration API, AI-driven fare analytics, and managed AFC services (SLA maintenance and support).
By Technology
Smart card leads at 46.0% (2025), due to its proven reliability, fast transaction speed, and widespread deployment across metro, rail, and bus transit networks. Smart cards support secure, reusable, and high-volume fare transactions, making them ideal for managing large commuter populations efficiently.
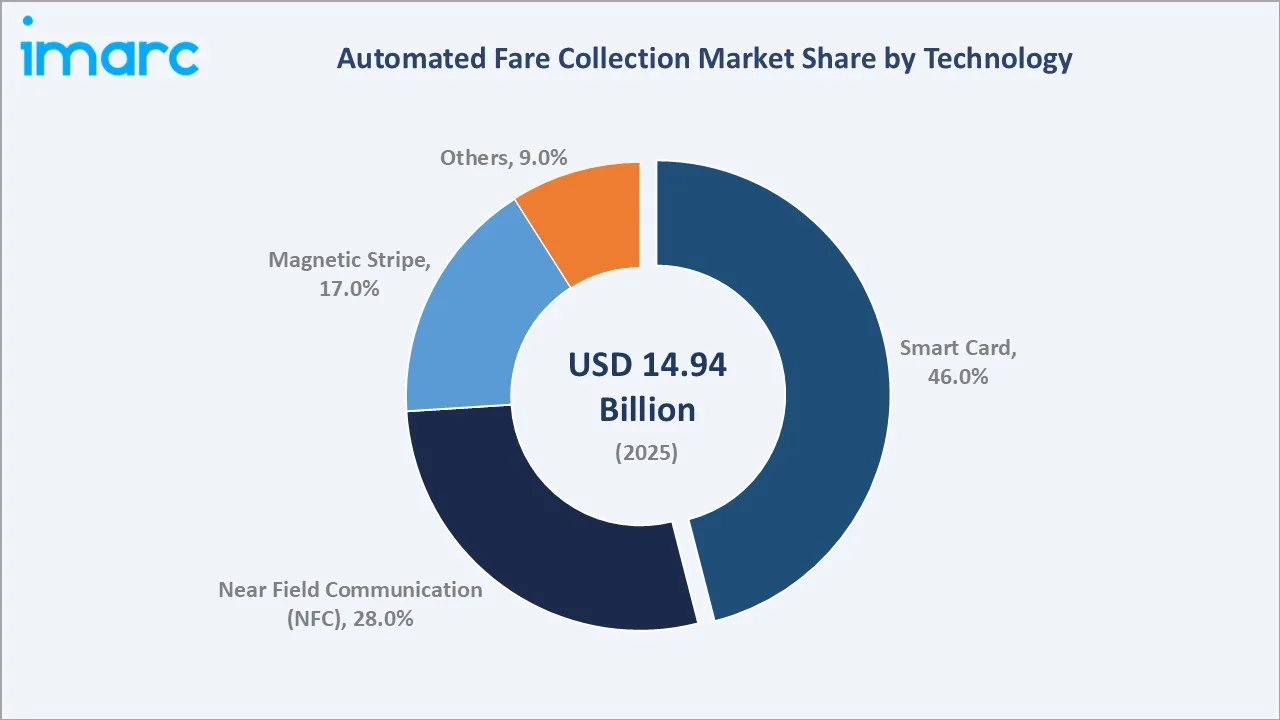
Near field communication (NFC) at 28.0% grows fastest at ~12.4% CAGR through open-loop EMV contactless bank card, Apple Pay, Google Pay, and Samsung Pay transit acceptance, disrupting closed-loop smart card. Magnetic stripe at 17.0% declines as legacy systems are replaced by smart cards and NFC. Others at 9.0% includes QR code mobile ticketing, biometric face recognition, and barcode.
Regional Market Insights
|
Region |
Share (2025) |
Key AFC Market Drivers & Characteristics |
|
North America |
35.0% |
Reflecting advanced public transit infrastructure, widespread adoption of contactless payments, strong smart mobility investments, and ongoing modernization of metro, bus, and rail networks. |
|
Asia Pacific |
31.0% |
Reflects rapid urbanization, large-scale metro and high-speed rail expansion, rising digital payment adoption, and substantial government investments in smart city and transportation infrastructure projects. |
|
Europe |
24.0% |
Reflects strong deployment of interoperable ticketing systems, increasing adoption of open-loop EMV payments, and continued investment in sustainable, multimodal public transportation networks. |
|
Latin America |
6.0% |
Reflects growing investment in metro systems, bus rapid transit networks, and digital fare collection technologies aimed at improving transit efficiency and passenger convenience. |
|
Middle East & Africa |
4.0% |
Reflects expanding smart city initiatives, new metro and rail projects, rising contactless payment adoption, and increasing investment in modern public transportation infrastructure. |
North America's 35.0% dominance is supported by advanced transit infrastructure, widespread contactless payment adoption, and ongoing investments in smart mobility systems. Asia Pacific's 31.0% driven by rapid urbanization, large-scale metro expansion, and growing deployment of digital ticketing solutions across China, India, Japan, and Southeast Asia.
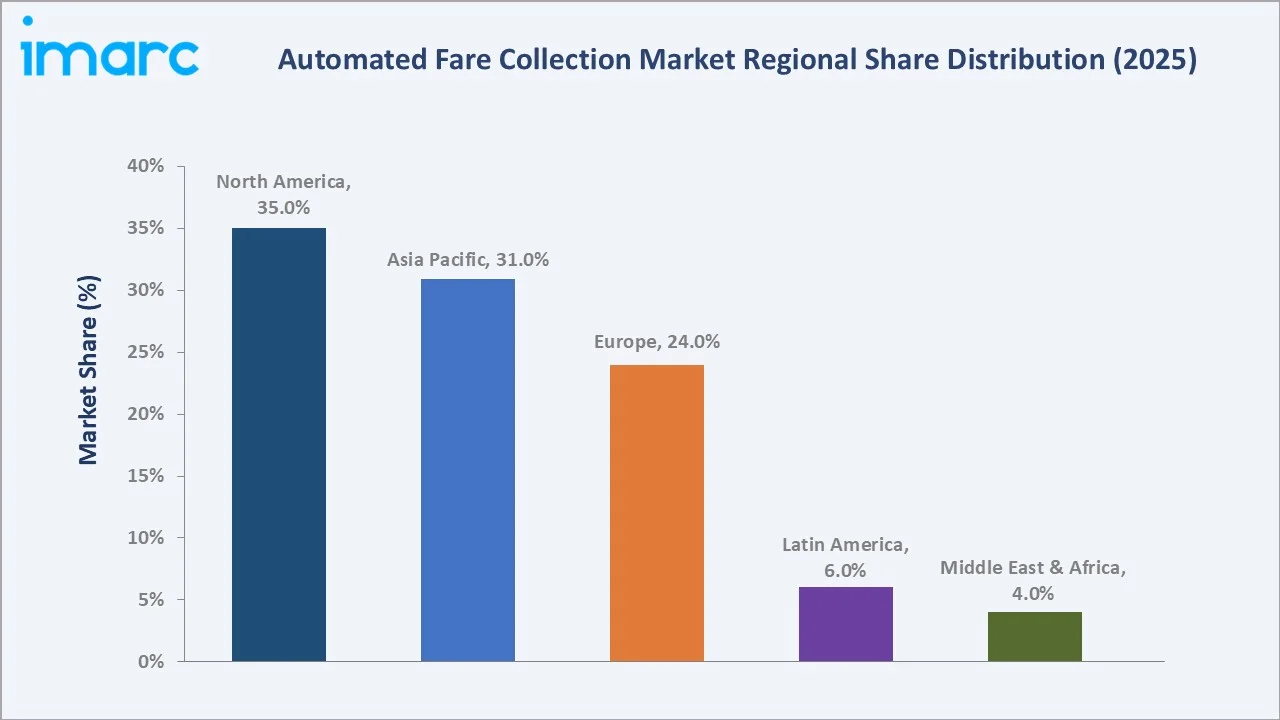
Europe's 24.0% benefits from strong adoption of interoperable fare systems, open-loop EMV payments, and sustainable public transportation initiatives. Latin America's 6.0% witnessing growth through investments in metro and bus rapid transit networks. The Middle East & Africa’s 4.0% expanding AFC adoption through smart city projects and modern rail infrastructure development.
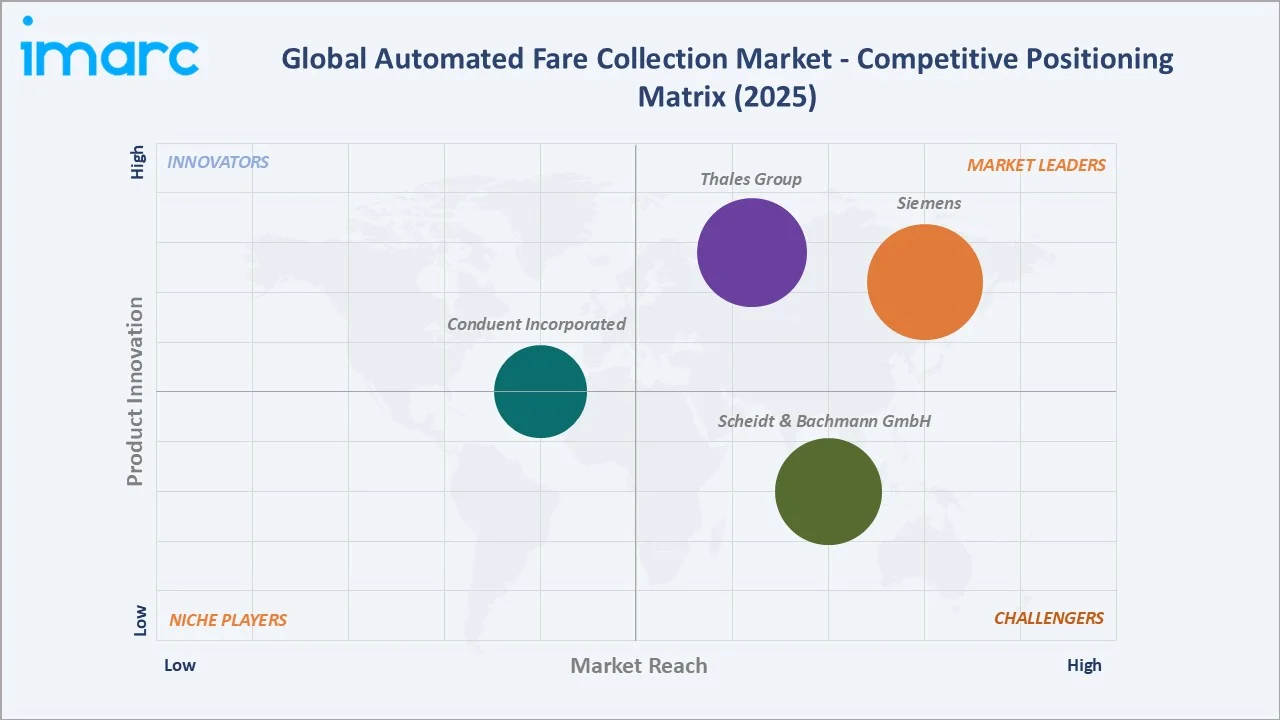
Competitive Landscape
The automated fare collection market is moderately concentrated, with competition led by established transit technology providers, payment solution vendors, and system integrators. Major players compete through innovations in account-based ticketing, contactless EMV payments, mobile ticketing, cloud-based AFC platforms, and multimodal fare integration. Strategic partnerships with transit authorities, smart city projects, and public transportation operators remain key growth strategies.
|
Company |
Key Products |
Market Position |
Core Strength |
|
Siemens |
eos.ticketingsuite, abo.digital, XiXo |
Market Leader |
Siemens, with its Mobility division, acts as a major global player in Automated Fare Collection (AFC), delivering turnkey rail solutions, digital check-in/be-out smartphone apps, and account-based cloud ticketing that seamlessly integrate payment and operations. |
|
Thales Group |
Thales D1 platform |
Market Leader |
The Thales Group is a global leader in mass transit ticketing, providing state-of-the-art Automatic Fare Collection (AFC) gates, contactless smartcard validators, ticket vending machines, and cloud-ready ticketing back-office software. |
|
Scheidt & Bachmann GmbH |
FareGo PG|50, FareGo Suite |
Strong Challenger |
Scheidt & Bachmann GmbH is a global market leader and premier systems provider in the Automated Fare Collection (AFC) industry. Operating under its specialized FareGo brand, the company designs, manufactures, and manages end-to-end intelligent ticketing and hardware ecosystems for public transit networks worldwide. |
|
Conduent Incorporated |
EasyTap Open Payment, Mobility as a Service (MaaS) solutions, Fleet Management CAD/AVL |
Established Player |
Conduent Incorporated acts as a major global supplier of automated fare collection (AFC) systems for public transit agencies. Its solutions optimize transportation systems by replacing manual ticketing with secure contactless, account-based, and mobile payments to boost revenue, deter evasion, and reduce operational costs. |
Companies are also investing in cybersecurity, AI-driven analytics, and open-loop payment technologies to differentiate their offerings. As transit networks modernize globally, vendors are increasingly focusing on interoperability, scalability, and passenger-centric digital mobility solutions to strengthen their market positions.
Key Company Profiles
Siemens
Siemens is a leading global provider of intelligent transportation and mobility technologies, with a strong presence in the automated fare collection market through its digital mobility and rail solutions portfolio. The company offers integrated AFC systems that support smart ticketing, contactless payments, fare gates, validators, back-office platforms, and multimodal transit management. Siemens serves metro, rail, bus, and urban transit operators worldwide, helping improve passenger convenience, operational efficiency, and revenue management.
- Key Products: eos.ticketingsuite, abo.digital, XiXo.
- Strategic Focus: Expanding its automated fare collection capabilities through integrated digital mobility solutions that combine smart ticketing, contactless payments, account-based ticketing, and multimodal transport integration.
Thales Group
Thales Group is a prominent provider of transportation, digital identity, and payment technologies with a strong presence in the automated fare collection market. The company delivers end-to-end AFC solutions, including smart ticketing systems, contactless payment platforms, fare gates, validators, mobile ticketing applications, and secure back-office management systems. Thales serves metro, rail, bus, and multimodal transit operators worldwide, helping improve passenger convenience, revenue protection, and operational efficiency.
- Key Products: Thales D1 platform.
- Strategic Focus: Advancing automated fare collection through secure digital ticketing, contactless payment solutions, and account-based ticketing platforms.
Market Concentration Analysis
The automated fare collection market is moderately concentrated, with a group of established transportation technology providers accounting for a significant share of global deployments. Companies such as Siemens, Thales Group, Scheidt & Bachmann GmbH, and Conduent Incorporated maintain strong positions through long-term transit contracts, integrated AFC platforms, and global project experience. Market concentration is higher in large-scale metro and rail projects where system integration expertise, cybersecurity capabilities, and interoperability are critical. However, competition is increasing as digital payment providers, cloud platform vendors, and regional AFC specialists enter the market. Innovation in account-based ticketing, open-loop payments, MaaS integration, and cloud-based fare systems remains the primary competitive differentiator.
Investment & Growth Opportunities
Highest Growth Segments
Software and services (~11.0% CAGR), NFC open-loop EMV (~12.4% CAGR through bank card transit), Asia Pacific metro expansion (~13% CAGR), biometric AFC (~15-18% CAGR from emerging base), AI dynamic pricing (~12% CAGR), and LATAM transit modernization (~11% CAGR from lower base) represent AFC highest-growth investment vectors through 2034.
Investment Themes
- Account-based ticketing cloud platform: Investment in cloud-based ABT platforms offers strong potential as transit operators shift toward centralized fare accounts, open payments, and multimodal ticketing with lower infrastructure complexity.
- Asia Pacific metro and BRT expansion: Rapid metro, rail, and BRT growth across Asia Pacific creates investment opportunities in AFC gates, validators, QR ticketing, smart cards, and integrated payment systems.
Future Market Outlook (2026-2034)
The global automated fare collection market is projected to grow from USD 14.94 Billion in 2025 to USD 36.27 Billion by 2034, delivering a 10.04% CAGR over the forecast period through urbanization and metro rail expansion, contactless EMV open-loop disruption, government transit modernization funding, ABT and MaaS digital transformation, and biometric AFC emerging. The market's anchor value of USD 24.11 Billion in 2030 represents AFC at digital and open-loop inflection.
Three structural forces define global automated fare collection market growth through 2034. First, rapid urbanization and expansion of metro, rail, and bus rapid transit networks are increasing demand for efficient fare management systems. Second, growing adoption of contactless payments, mobile ticketing, and account-based ticketing is accelerating the shift toward digital and cashless transit experiences. Third, the integration of Mobility-as-a-Service (MaaS), cloud platforms, and real-time passenger analytics is driving the development of interoperable, data-driven, and passenger-centric fare collection ecosystems.
Research Methodology
Primary Research
Primary research comprised interviews with transit authorities, AFC system providers, payment solution vendors, system integrators, and public transport operators. Discussions covered ticketing technology adoption, contactless payment usage, deployment challenges, passenger convenience, and fare system modernization. These insights helped validate market trends, technology preferences, and growth assumptions across regions and transit modes.
Secondary Research
Secondary research encompassed the review of transit authority reports, company annual reports, investor presentations, government transportation databases, smart city initiatives, and industry publications. It also included analysis of metro and rail expansion projects, digital payment trends, AFC technology deployments, and regulatory developments. These sources were used to assess market size, competitive dynamics, technology adoption, and long-term growth opportunities.
Forecasting Models
Forecasting models combined historical AFC deployment trends, public transportation ridership, digital payment adoption rates, and transit infrastructure investments to estimate future market growth. A hybrid methodology incorporating time-series analysis, technology adoption curves, and transportation sector indicators was used to project demand. Scenario-based forecasting also evaluated the impact of smart city investments, metro and rail expansion, contactless payment penetration, and Mobility-as-a-Service (MaaS) adoption through 2034.
Automated Fare Collection Market Report Scope:
| Report Features | Details |
|---|---|
| Base Year of the Analysis | 2025 |
| Historical Period | 2020-2025 |
| Forecast Period | 2026-2034 |
| Units | Billion USD |
| Scope of the Report | Exploration of Historical Trends and Automated Fare Collection Market Outlook, Industry Catalysts and Challenges, Segment-Wise Historical and Future Market Assessment:
|
| Components Covered | Hardware, Software and Services |
| System Types Covered | Ticket Vending Machine (TVM), Ticket Office Machine (TOM), Fare Gates, IC Cards |
| Technologies Covered | Smart Card, Magnetic Stripe, Near Field Communication (NFC), Others |
| Applications Covered | Railways and Transportation, Parking, Entertainment, Others |
| Regions Covered | Asia Pacific, Europe, North America, Latin America, Middle East and Africa |
| Countries Covered | United States, Canada, Germany, France, United Kingdom, Italy, Spain, Russia, China, Japan, India, South Korea, Australia, Indonesia, Brazil, Mexico |
| Companies Covered | Siemens, Thales Group, Scheidt & Bachmann GmbH, Conduent Incorporated, etc. |
| Customization Scope | 10% Free Customization |
| Post-Sale Analyst Support | 10-12 Weeks |
| Delivery Format | PDF and Excel through Email (We can also provide the editable version of the report in PPT/Word format on special request) |
Key Benefits for Stakeholders:
- IMARC’s industry report offers a comprehensive quantitative analysis of various market segments, historical and current market trends, automated fare collection market forecasts, and dynamics of the market from 2020-2034.
- The research report provides the latest information on the market drivers, challenges, and opportunities in the global automated fare collection market.
- The study maps the leading, as well as the fastest-growing, regional markets. It further enables stakeholders to identify the key country-level markets within each region.
- Porter's five forces analysis assists stakeholders in assessing the impact of new entrants, competitive rivalry, supplier power, buyer power, and the threat of substitution. It helps stakeholders to analyze the level of competition within the automated fare collection industry and its attractiveness.
- The competitive landscape allows stakeholders to understand their competitive environment and provides insight into the current positions of key players in the market.
Frequently Asked Questions About the Automated Fare Collection Market Report
The global automated fare collection market reached USD 14.94 Billion in 2025, driven by rising investments in smart transit infrastructure, metro and BRT expansion, and growing adoption of contactless payments. Increasing demand for cashless, seamless, and interoperable ticketing systems is accelerating AFC deployment across public transportation networks.
The global automated fare collection market grows at 10.04% CAGR during 2026-2034, reaching USD 36.27 Billion by 2034. The CAGR reflects urbanization, EMV open-loop disruption, government transit funding, ABT cloud, and Asia Pacific metro expansion.
Hardware leads at 63.0% as fare gates, validators, ticket vending machines, card readers, and POS terminals form the core physical infrastructure of AFC systems. Continuous metro, rail, and bus network expansion keeps demand for these components strong.
Smart card leads at 46.0% due to its high transaction speed, reliability, and widespread deployment across metro, rail, and bus networks. Its ability to support secure, reusable, and high-volume fare transactions makes it the preferred ticketing medium for transit operators.
North America leads at 35.0% due to advanced public transit infrastructure, high contactless payment adoption, and strong smart mobility investments. Ongoing modernization of metro, bus, and rail networks further supports regional dominance.
Leading companies include Siemens, Thales Group, Scheidt & Bachmann GmbH, and Conduent Incorporated, among others.
The market is projected to reach approximately USD 24.11 Billion by 2030, supported by smart transit modernization and rising contactless payment adoption. Metro, rail, and BRT expansion will continue to drive demand for AFC hardware, software, and integrated ticketing platforms.
Three priority investment opportunities in the automated fare collection market include account-based ticketing (ABT) and cloud-based AFC platforms, which enable scalable, interoperable, and lower-cost fare management systems. Open-loop contactless payment infrastructure, supporting EMV bank cards, mobile wallets, and NFC payments, offers strong growth potential as transit agencies transition toward cashless mobility. Additionally, Asia Pacific metro and BRT expansion projects present significant opportunities for fare gates, validators, QR ticketing, smart card systems, and integrated mobility platforms as urban transportation networks continue to expand rapidly.
Need more help?
- Speak to our experienced analysts for insights on the current market scenarios.
- Include additional segments and countries to customize the report as per your requirement.
- Gain an unparalleled competitive advantage in your domain by understanding how to utilize the report and positively impacting your operations and revenue.
- For further assistance, please connect with our analysts.
 Request Customization
 Speak to an Analyst
 Request Brochure
 Inquire Before Buying
Benefits of Customization
- Personalize this research
- Triangulate with your data
- Get data as per your format and definition
- Gain a deeper dive into a specific application, geography, customer, or competitor
- Any level of personalization
Get in Touch With Us
UNITED STATES
Phone: +1-201-971-6302
INDIA
Phone: +91-120-433-0800
UNITED KINGDOM
Phone: +44-753-714-6104
Email: [email protected]
Client Testimonials


.webp)


