
Central Asia E-commerce Market Size, Share, Trends and Forecast by Product Type, Transaction, Payment Mode, and Country, 2026-2034
Central Asia E-commerce Market Size and Share:
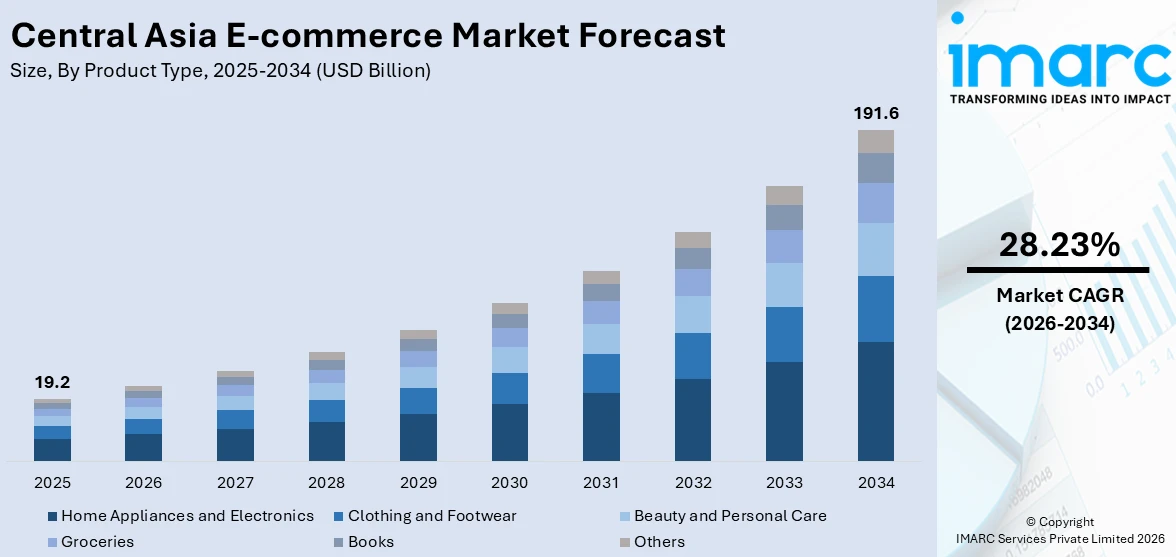
The Central Asia e-commerce market size reached USD 19.2 Billion in 2025. The market is expected to reach USD 191.6 Billion by 2034, exhibiting a growth rate (CAGR) of 28.23% during 2026-2034. The market growth is attributed to the increasing internet penetration and the adoption of numerous e-commerce platforms, the significant expansion in cross-border trade opportunities, and the development of secure digital payment systems.
Market Insights:
- Based on region, Kazakhstan dominated the market in 2025.
- On the basis of product type, home appliances and electronics leads the market in 2025.
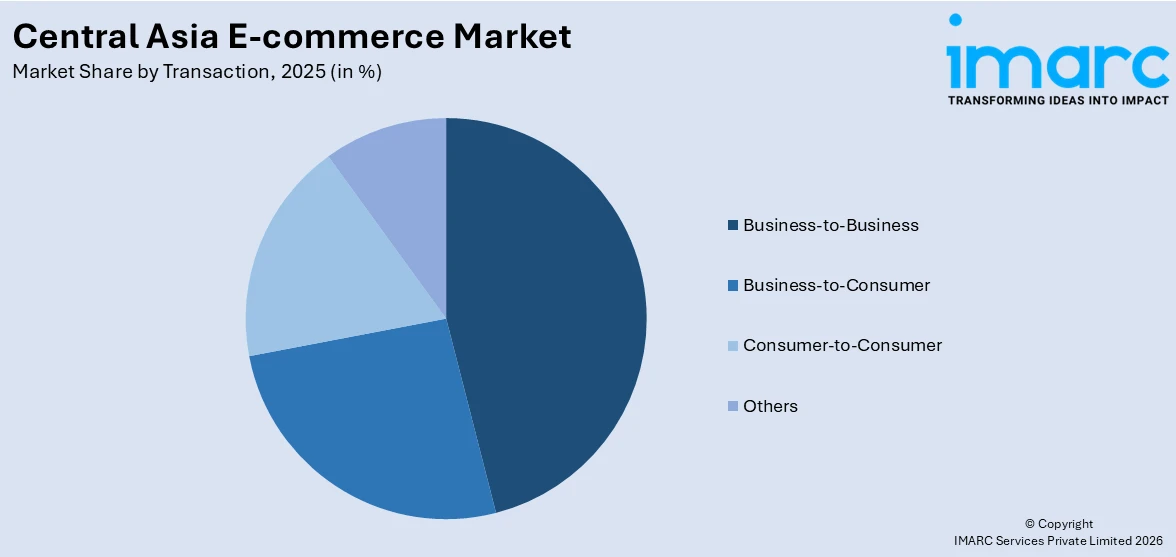
- Based on the transactions, business-to-business transactions hold the largest share of the market in 2025.
- On the basis of payment mode, cash payments represented the largest segment in 2025.
Market Size and Forecast:
- 2025 Market Size: USD 19.2 Billion
- 2034 Projected Market Size: USD 191.6 Billion
- CAGR (2026-2034): 28.23%
E-commerce, or electronic commerce, refers to the buying and selling of goods and services over the Internet. It encompasses numerous online transactions, including retail sales, business-to-business exchanges, and electronic marketplaces. It operates virtual storefronts that allow customers to browse and purchase products or services conveniently from their computers or mobile devices. It eliminates the need for physical presence, enabling transactions to occur across geographical boundaries. It often incorporates secure payment gateways to facilitate online payments and ensure the protection of sensitive financial information. As a result, e-commerce is gaining immense traction across central Asia.
To get more information on this market Request Sample
The market is primarily driven by the growing internet penetration. In addition, as more people gain access to the internet and digital devices, the online consumer base expands, creating a larger potential market for e-commerce businesses, thus influencing the market growth. Moreover, several advancements in payment systems and logistics infrastructure are overcoming traditional barriers to online transactions, and the availability of secure online payment options and efficient delivery services are escalating consumer trust in e-commerce, thus representing another major growth-inducing factor. Besides this, the changing consumer preferences and the widespread adoption of e-commerce platforms are accelerating online transaction market growth. Furthermore, the convenience of shopping online, access to numerous products, and the ability to compare prices easily led to a shift from traditional brick-and-mortar retail to online shopping, thus creating a positive market outlook.
Central Asia E-commerce Market Trends/Drivers:
The increasing internet penetration
The escalating levels of internet penetration across the region are leading to the widespread adoption of e-commerce, providing businesses with unprecedented opportunities to reach a broader consumer base, thus influencing market growth. Moreover, several advancements in telecommunications infrastructure and increased affordability of digital devices represent another major growth-inducing factor. This trend has led to greater connectivity and accessibility, allowing individuals from urban and rural areas, to access online platforms and engage in e-commerce activities. Besides this, the increasing internet penetration expanded the potential customer base for e-commerce businesses while shifting consumer behaviors and expectations toward online shopping, thus accelerating market growth. Along with this, consumers now demand convenience and immediacy, the shift from traditional retail to online shopping is transforming the retail industry, creating new opportunities and challenges for established and emerging players, thus augmenting the Central Asia e-commerce market share.
The significant expansion in cross-border trade opportunities
The market is experienced a profound transformation due to the significant expansion of cross-border trade opportunities. In addition, the advent of e-commerce has blurred geographical boundaries, allowing consumers to explore and purchase products from international markets with unprecedented ease, thus contributing to market growth. Moreover, the growth of reliable logistics networks is positioning Central Asia as a prime player in cross-border e-commerce representing another major growth-inducing factor. Along with this, consumers now have access to numerous products that were once out of reach, enabling them to explore unique items, compare prices, and make informed purchasing decisions, thus propelling market growth. Besides this, cross-border e-commerce is enriching the consumer experience while opening doors for local businesses to tap into global markets, thus accelerating market growth. Apart from this, small and medium-sized enterprises (SMEs) can now reach an international audience without the constraints of physical store locations which is fostering cultural exchange and international collaboration, further enhancing the Central Asia e-commerce market outlook.
Government Support and Digital Infrastructure Development
Central Asian governments are increasingly prioritizing the development of digital infrastructure to drive e-commerce expansion. Moreover, investments in internet connectivity, digital literacy initiatives, and regulatory reform is contributing to an environment more favorable for online purchases. Further, nations such as Kazakhstan and Kyrgyzstan are making investments in bringing internet penetration to rural areas, enabling a greater percentage of the population to participate in e-commerce. Apart from this, electronic payment systems are being enhanced, with efforts such as the launch of e-wallets and online banking to increase consumer confidence in online transactions. Governments are also taking efforts to develop positive regulatory conditions that promote the development of e-commerce. Such support reduces the entry barriers for local as well as foreign businesses seeking to enter the market. Through the development of the requisite digital infrastructure, governments are setting the stage for long-term growth in the market.
Growth Drivers of the Central Asia E-Commerce Market:
The market is largely fueled by expanding internet penetration and mobile coverage. In recent years, the number of internet users in the region has expanded considerably with the government's efforts to enhance digital infrastructure. This increase in internet penetration has led to an expanding base of online consumers, with mobile commerce particularly prominent as a result of the global proliferation of smartphones. Furthermore, the use of electronic payment systems and the growth in e-payment platforms have increased security as well as the convenience of online transactions for customers. Other than this, growth in disposable income, together with expanding young, technology-adopting population, further propels the Central Asia e-commerce market growth. These, together with the growing availability of local platforms and enhanced logistics networks, are driving the expansion of the e-commerce market in Central Asia, thus providing an excellent environment for e-commerce growth among businesses.
Opportunities in the Central Asia E-Commerce Market:
The market offers tremendous opportunities, especially for companies seeking to tap into an emerging, underserved market. As internet penetration continues to broaden, local and international businesses can serve a young and increasingly prosperous consumer base. Besides this, there is a significant demand for both foreign and domestic goods, which opens a chance for businesses to bring in a vast selection of goods, such as those not easily accessible within the region. Also, mobile shopping trends and complex digital payment systems continue to gain traction, making new opportunities available for mobile-first e-commerce solutions. In addition, businesses can take advantage of cross-border e-commerce, as local consumers often shop from global sites. Additionally, the development of logistics and delivery infrastructure further boosts businesses' opportunities to set up seamless supply chains, providing more convenience and shorter delivery times. This fast-growing market offers a growth environment for investment and innovation.
Challenges in the Central Asia E-Commerce Market:
Despite its growth, as per the Central Asia e-commerce market research report, the market faces several challenges that hinder its full potential. The underdeveloped logistics and delivery infrastructure results in delayed shipments and restricted delivery options, particularly in rural areas. This problem is compounded by a lack of reliable tracking systems, which can further erode consumer confidence in online purchases. Furthermore, the digital payment ecosystem of the region, though improving, still requires improvement in several areas, including fraud prevention, security issues, and low trust in digital payments. The regulatory environment is also changing, with non-uniform enforcement of tariffs and e-commerce laws, creating hassles for firms in maintaining compliance. Moreover, the relatively low digital literacy rate, particularly in rural areas, restricts the capacity of a substantial percentage of the population to participate deeply in e-commerce. All these issues create constraints to the expansion of e-commerce and demand huge investments in infrastructure, education, and regulation.
Central Asia E-Commerce Industry Segmentation:
IMARC Group provides an analysis of the key trends in each segment of the Central Asia E-commerce market report, along with forecasts at the regional and country levels from 2026-2034. Our report has categorized the market based on product type, transaction and payment mode.
Breakup by Product Type:
- Home Appliances and Electronics
- Clothing and Footwear
- Beauty and Personal Care
- Groceries
- Books
- Others
Home appliances and electronics represent the most popular product type
The report has provided a detailed breakup and analysis of the market based on the product type. This includes home appliances and electronics, clothing and footwear, beauty and personal care, groceries, books, others. According to the report, home appliances and electronics accounted for the largest market share.
The growing internet penetration and digital literacy in the region are allowing consumers to explore and make informed decisions about various products online, thus influencing market growth. Additionally, the rising demand for home appliances and electronics as they are essential components of modern living, garner significant attention from consumers seeking convenience, efficiency, and improved lifestyles, thus contributing to the market growth.
Moreover, e-commerce platforms provide consumers in Central Asia with numerous kinds of home appliances and electronics, allowing them to compare specifications, prices, and reviews with ease, thus representing another major growth-inducing factor. This level of convenience is particularly attractive for products that require detailed research and consideration, such as electronic gadgets and appliances.
Furthermore, the competitive pricing and frequent discounts offered by e-commerce platforms for home appliances and electronics are driving the market growth. Also, consumers are drawn to online platforms due to the potential for cost savings, especially for high-ticket items.
Breakup by Transaction:
Access the comprehensive market breakdown Request Sample
- Business-to-Business
- Business-to-Consumer
- Consumer-to-Consumer
- Others
Business-to-business transactions hold the largest share of the market
A detailed breakup and analysis of the market based on the transaction has also been provided in the report. This includes business-to-business, business-to-consumer, consumer-to-consumer, and others. According to the report, business-to-business accounted for the largest market share.
B2B transactions cater to the intricate needs of businesses involved in manufacturing, distribution, and supply chains, thus influencing market growth. In addition, the presence of various industries, including agriculture, textiles, and energy, all of which heavily rely on inter-business transactions to procure raw materials, components, and equipment, thus contributing to the market growth.
Moreover, the Central Asian countries' geographical position as crossroads between Europe and Asia enhances their role in international trade representing another major growth-inducing factor. B2B e-commerce uses this strategic location by allowing businesses to engage in seamless cross-border trade, increasing the region's potential as a hub for connecting suppliers and buyers from diverse regions.
Besides this, B2B e-commerce platforms provide centralized and efficient channels for procurement, negotiation, and bulk purchases, facilitating smoother business operations. In a region where relationships and trust are essential in business interactions, B2B platforms offer a convenient means to establish and maintain long-term partnerships, thus accelerating market growth. Furthermore, Central Asian economies have a growing emphasis on diversification and international collaboration that align with B2B e-commerce goals by providing a platform for businesses to discover new suppliers, explore innovative products, and access a global network of potential partners, thus propelling market growth.
Breakup by Payment Mode:
- Cash Payment
- Bank Transfer
- Card Payment
- Digital Wallet
- Others
Cash payments presently account for the largest market share
A detailed breakup and analysis of the market based on the payment mode have also been provided in the report. This includes cash payments, bank transfers, card payments, digital wallet, and others. According to the report, cash payments accounted for the largest market share.
Cash payment is driven by the changing consumer preferences. In addition, in Central Asian countries, there is a strong preference for using cash in day-to-day transactions which is perceived as a tangible and trustworthy form of payment, deeply ingrained in local customs and traditions, thus influencing the market growth.
Moreover, some regions in Central Asia still face limitations in digital infrastructure, including internet access and reliable online payment systems resulting in the widespread adoption of cash payment, which represents another major growth-inducing factor. Along with this, cash transactions offer a sense of security and control to consumers wary of potential online fraud or data breaches associated with digital payment methods, thus propelling market growth. This is particularly true in markets where digital literacy about secure online transactions is still developing. Besides this, a lack of awareness among consumers about the convenience and security of other digital methods leads to a reliance on familiar cash transactions, thus accelerating the market growth.
Breakup by Country:
- Kazakhstan
- Uzbekistan
- Kyrgyzstan
- Tajikistan
- Turkmenistan
Kazakhstan exhibits a clear dominance in the market
The report has also provided a comprehensive analysis of all the major regional markets, which include Kazakhstan, Uzbekistan, Kyrgyzstan, Tajikistan, and Turkmenistan. According to the report, Kazakhstan was the largest market.
Kazakhstan's relatively advanced technological infrastructure, including widespread internet access and mobile connectivity, lays a strong foundation for e-commerce expansion, thus influencing market growth. Also, the growing population and increasing urbanization rates compared to its regional counterparts provide a substantial consumer base for online businesses to tap into, thus contributing to market growth.
Moreover, the implementation of favorable government initiatives aimed at fostering the digital economy policies promoting entrepreneurship, technology adoption, and digital literacy are creating a conducive environment for businesses in the digital realm representing another major growth-inducing factor.
Furthermore, Kazakhstan's strategic geographical location at the crossroads of Europe and Asia positions it as a natural hub for cross-border trade that allows Kazakhstani e-commerce businesses to engage in international commerce more seamlessly, capitalizing on the growing trend of cross-border e-commerce, thus creating a positive market outlook.
Competitive Landscape:
At present, key players are strategically implementing various measures to strengthen their positions and stay competitive. These actions encompass innovations, partnerships, customer-centric approaches, and technological advancements. Additionally, leading e-commerce players are expanding their reach beyond urban centers, tapping into rural and less-connected areas involving setting up distribution centers, improving logistics infrastructure, and offering customized solutions to cater to diverse demographics. According to the Central Asia e-commerce market forecast, introduction of innovative payment solutions, including digital wallets, buy-now-pay-later options, and installment plans is set to simplify transactions and enhance convenience for customers. Besides this, key players are investing in educating customers about online shopping, safety, and best practices, building trust through transparent policies and security measures while enhancing customer confidence in the digital marketplace.
The report has provided a comprehensive analysis of the competitive landscape in the market. Detailed profiles of all major companies have also been provided. Some of the key players in the market include:
- Air Astana JSC
- AliExpress (Alibaba Group)
- Amazon.com Inc.
- Arba.uz
- ChocoFamily Holding
- eBay Inc.
- eSavdo
- Kaspi Magazin (Kaspi.kz, AO)
- Kolesa.kz
- Lamoda.kz
- OLX Group (Naspers(Prosus))
- Sulpak
- Svetofor
- Technodom.kz
- Wildberries
Latest News and Developments:
- July 2025: Airports of Kyrgyzstan OJSC launched a joint project to build a multimodal logistics and e-commerce hub at Manas International Airport in Bishkek. Partnering with Kyrgyz Pochtasy OJSC and Customs Infrastructure, the hub will include warehousing, fulfillment zones, customs terminals, logistics modules, IT infrastructure, and digital services. Airports of Kyrgyzstan will provide land and design support, Kyrgyz Pochtasy will handle digital and cross-border logistics, and Customs Infrastructure will finance and implement advanced technologies. A dedicated working group has been formed to develop the business plan, assemble operational teams, and seek international partnerships.
- May 2025: Wildberries, a leading Eurasian e-commerce platform, launched its advanced AI-powered analytics service, Jam, for sellers in Kazakhstan. The subscription-based tool provides in-depth insights into audience targeting, search trends, sales funnels, and seasonality to enhance marketplace performance. Jam also incorporates neural-network capabilities that automatically generate and optimize product descriptions, promotional content, and AI-generated images featuring virtual models, helping sellers reduce marketing expenses and boost conversion rates.
- May 2025: Taobao officially rolled out a Russian-language version of its app in Kazakhstan, allowing users to navigate product listings, view prices in Kazakhstani tenge, and complete purchases entirely in Russian — marking the platform's first multilingual expansion into a non‑English speaking market. Additionally, Taobao introduced free shipping for orders exceeding 99 yuan and local return services, significantly enhancing accessibility and lowering entry barriers for Kazakhstani consumers.
- April 2025: Wildberries launched its online marketplace operations in Tajikistan via Wildberries.tj and its mobile app, marking its fourth expansion in Central Asia and ninth country overall. With a catalog exceeding 8 Million SKUs, the platform offers a diverse range of products to Tajik consumers. Initial logistics arrangements feature two pick-up points in Dushanbe and one in Khujand, delivering orders in approximately 10–14 days, while enabling customers to pick up, try on, or return goods onsite.
Central Asia E-Commerce Market Report Scope:
| Report Features | Details |
|---|---|
| Base Year of the Analysis | 2025 |
| Historical Period | 2020-2025 |
| Forecast Period | 2026-2034 |
| Units | Billion USD |
| Scope of the Report | Exploration of Historical and Forecast Trends, Industry Catalysts and Challenges, Segment-Wise Historical and Predictive Market Assessment:
|
| Product Types Covered | Home Appliances and Electronics, Clothing and Footwear, Beauty and Personal Care, Groceries, Books, Others |
| Transactions Covered | Business-To-Business, Business-To-Consumer, Consumer-To-Consumer, Others |
| Payment Modes Covered | Cash Payment, Bank Transfer, Card Payment, Digital Wallet, Others |
| Countries Covered | Kazakhstan, Uzbekistan, Kyrgyzstan, Tajikistan, Turkmenistan |
| Companies Covered | Air Astana JSC, AliExpress (Alibaba Group), Amazon.com Inc., Arba.uz, ChocoFamily Holding, eBay Inc., eSavdo, Kaspi Magazin (Kaspi.kz, AO), Kolesa.kz, Lamoda.kz, OLX Group (Naspers(Prosus)), Sulpak, Svetofor, Technodom.kz, Wildberries etc. |
| Customization Scope | 10% Free Customization |
| Post-Sale Analyst Support | 10-12 Weeks |
| Delivery Format | PDF and Excel through Email (We can also provide the editable version of the report in PPT/Word format on special request) |
Key Benefits for Stakeholders:
- IMARC’s report offers a comprehensive quantitative analysis of various market segments, historical and current market trends, market forecasts, and dynamics of the Central Asia e-commerce market from 2020-2034.
- The research study provides the latest information on the market drivers, challenges, and opportunities in the Central Asia e-commerce market.
- Porter's five forces analysis assist stakeholders in assessing the impact of new entrants, competitive rivalry, supplier power, buyer power, and the threat of substitution. It helps stakeholders to analyze the level of competition within the Central Asia e-commerce industry and its attractiveness.
- Competitive landscape allows stakeholders to understand their competitive environment and provides an insight into the current positions of key players in the market.
Frequently Asked Questions About the Central Asia E-Commerce Market Report
The Central Asia E-commerce market was valued at USD 19.2 Billion in 2025.
We expect the Central Asia E-commerce market to exhibit a CAGR of 28.23% during 2026-2034.
The rising high-speed internet connectivity, along with the increasing penetration of various smart devices, is primarily driving the Central Asia e-commerce market.
The sudden outbreak of the COVID-19 pandemic has led to the widespread adoption of e-commerce platforms, owing to the changing consumer inclination from conventional brick-and-mortar distribution channels towards online retail platforms, during the lockdown scenario across several Central Asian nations.
Based on the product type, the Central Asia e-commerce market can be categorized into home appliances and electronics, clothing and footwear, beauty and personal care, groceries, books, and others. Currently, home appliances and electronics account for the majority of the total market share.
Based on the transaction, the Central Asia e-commerce market has been segregated into business-to-business, business-to-consumer, consumer-to-consumer, and others. Among these, business-to-business currently holds the largest market share.
Based on the payment mode, the Central Asia e-commerce market can be bifurcated into cash payment, bank transfer, card payment, digital wallet, and others. Currently, cash payment exhibits a clear dominance in the market.
On a regional level, the market has been classified into Kazakhstan, Uzbekistan, Kyrgyzstan, Tajikistan, and Turkmenistan, where Kazakhstan currently dominates the Central Asia E-commerce market.
Some of the major players in the Central Asia E-commerce market include Air Astana JSC, AliExpress (Alibaba Group), Amazon.com Inc., Arba.uz, ChocoFamily Holding, eBay Inc., eSavdo, Kaspi Magazin (Kaspi.kz, AO), Kolesa.kz, Lamoda.kz, OLX Group (Naspers(Prosus)), Sulpak, Svetofor, Technodom.kz, and Wildberries.
Need more help?
- Speak to our experienced analysts for insights on the current market scenarios.
- Include additional segments and countries to customize the report as per your requirement.
- Gain an unparalleled competitive advantage in your domain by understanding how to utilize the report and positively impacting your operations and revenue.
- For further assistance, please connect with our analysts.
 Request Customization
 Speak to an Analyst
 Request Brochure
 Inquire Before Buying
Benefits of Customization
- Personalize this research
- Triangulate with your data
- Get data as per your format and definition
- Gain a deeper dive into a specific application, geography, customer, or competitor
- Any level of personalization
Get in Touch With Us
UNITED STATES
Phone: +1-201-971-6302
INDIA
Phone: +91-120-433-0800
UNITED KINGDOM
Phone: +44-753-714-6104
Email: [email protected]
Client Testimonials


.webp)


