
Cereal Bars Market Report by Product (Snacks Bar, Energy and Nutrition Bar, and Others), Flavor (Caramel, Banana, Chocolate, Honey, Strawberry, Peanut Butter, and Others), Distribution Channel (Supermarkets and Hypermarkets, Food Specialty Stores, Convenience Stores, Online Stores, and Others), and Region 2026-2034
Market Overview:
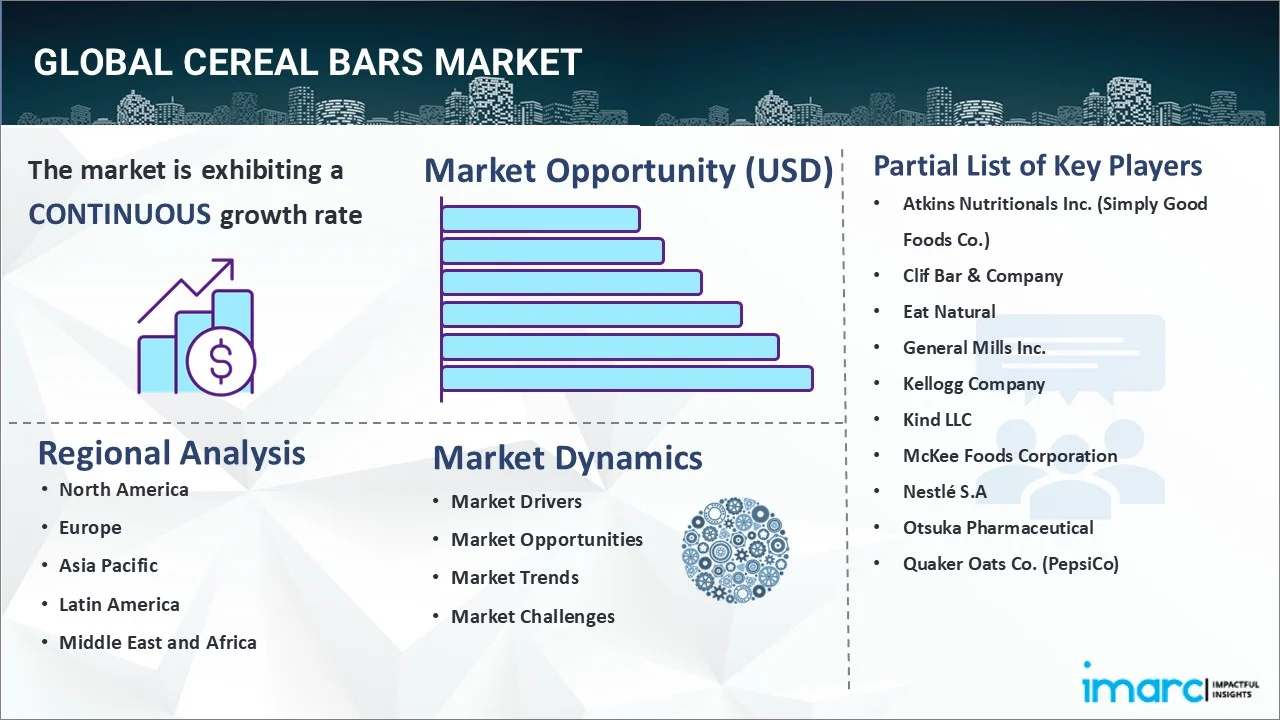
The global cereal bars market size reached USD 18.2 Billion in 2025. Looking forward, IMARC Group expects the market to reach USD 31.6 Billion by 2034, exhibiting a growth rate (CAGR) of 6.12% during 2026-2034.
|
Report Attribute
|
Key Statistics
|
|---|---|
|
Base Year
|
2025 |
|
Forecast Years
|
2026-2034
|
|
Historical Years
|
2020-2025
|
| Market Size in 2025 | USD 18.2 Billion |
| Market Forecast in 2034 | USD 31.6 Billion |
| Market Growth Rate (2026-2034) | 6.12% |
Cereal bars are formulated using corn starch, biscuits, oats, rice, milk and edible adhesives and are fortified with vitamins, minerals and other essential nutrients. These bars are rich in iron, starch, fiber, proteins, antioxidants, phosphorus and potassium. They assist in increasing energy, managing weight, improving muscle mass, enhancing digestive health and strengthening bones. Moreover, they can help in managing diabetes, lowering blood sugar and improving blood pressure (BP), as well as curbing the appetite and providing additional energy during endurance activities.
To get more information on this market Request Sample
Due to hectic lifestyles and changing dietary patterns, there is a rise in the demand for healthy and ready-to-eat (RTE) food products, such as cereal bars, that assist in maintaining a balanced diet. Moreover, the growing participation of individuals in physical activities is contributing to the market growth. Furthermore, the rising health consciousness is escalating the demand for variants that are made using natural ingredients, such as coconuts, peas, almonds and creamy cocoa butter, and sunflower and chia seeds. The key players are also offering gluten and sugar-free, and non-genetically modified (non-GMO) variants with no additives and preservatives. Besides this, the coronavirus disease (COVID-19) outbreak has increased the consumption of nutritious food products among individuals, such as cereal bars. However, the market players are unable to meet the escalating demand on account of lockdowns imposed by governments of several countries and disrupted supply chains. The market is anticipated to revive once lockdown restrictions are relaxed.
Key Market Segmentation:
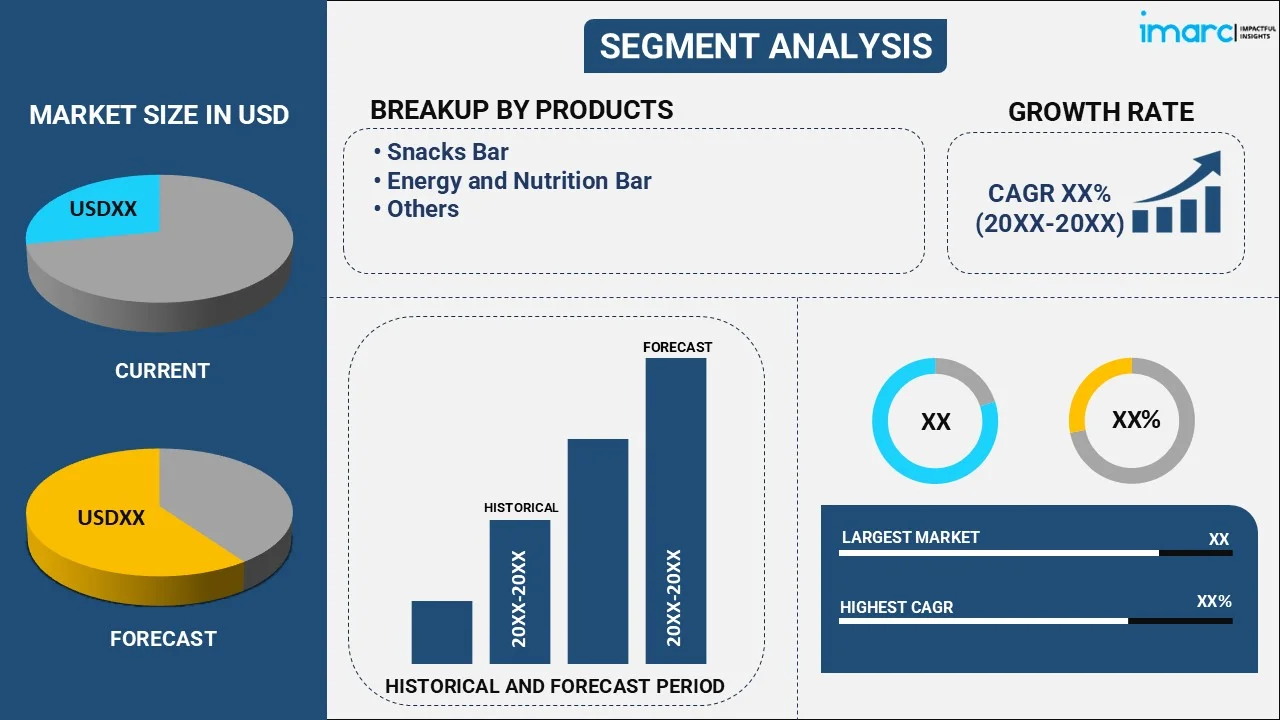
IMARC Group provides an analysis of the key trends in each sub-segment of the global cereal bars market report, along with forecasts at the global, regional and country level from 2026-2034. Our report has categorized the market based on product, flavor and distribution channel.
Breakup by Product:
To get detailed segment analysis of this market Request Sample
- Snacks Bar
- Energy and Nutrition Bar
- Others
Breakup by Flavor:
- Caramel
- Banana
- Chocolate
- Honey
- Strawberry
- Peanut Butter
- Others
Breakup by Distribution Channel:
- Supermarkets and Hypermarkets
- Food Specialty Stores
- Convenience Stores
- Online Stores
- Others
Breakup by Region:
To get more information on the regional analysis of this market Request Sample
- North America
- United States
- Canada
- Asia Pacific
- China
- Japan
- India
- South Korea
- Australia
- Indonesia
- Others
- Europe
- Germany
- France
- United Kingdom
- Italy
- Spain
- Russia
- Others
- Latin America
- Brazil
- Mexico
- Others
- Middle East and Africa
Competitive Landscape:
The report has also analysed the competitive landscape of the market with some of the key players being Atkins Nutritionals Inc. (Simply Good Foods Co.), Clif Bar & Company, Eat Natural, General Mills Inc., Kellogg Company, Kind LLC, McKee Foods Corporation, Nestlé S.A, Otsuka Pharmaceutical and Quaker Oats Co. (PepsiCo).
Report Coverage:
| Report Features | Details |
|---|---|
| Base Year of the Analysis | 2025 |
| Historical Period | 2020-2025 |
| Forecast Period | 2026-2034 |
| Units | Billion USD |
| Segment Coverage | Product, Flavor, Distribution Channel, Region |
| Region Covered | Asia Pacific, Europe, North America, Latin America, Middle East and Africa |
| Countries Covered | United States, Canada, Germany, France, United Kingdom, Italy, Spain, Russia, China, Japan, India, South Korea, Australia, Indonesia, Brazil, Mexico |
| Companies Covered | Atkins Nutritionals Inc. (Simply Good Foods Co.), Clif Bar & Company, Eat Natural, General Mills Inc., Kellogg Company, Kind LLC, McKee Foods Corporation, Nestlé S.A, Otsuka Pharmaceutical and Quaker Oats Co. (PepsiCo) |
| Customization Scope | 10% Free Customization |
| Post-Sale Analyst Support | 10-12 Weeks |
| Delivery Format | PDF and Excel through Email (We can also provide the editable version of the report in PPT/Word format on special request) |
Frequently Asked Questions About the Cereal Bars Market Report
The global cereal bars market was valued at USD 18.2 Billion in 2025.
We expect the global cereal bars market to exhibit a CAGR of 6.12% during 2026-2034.
The sudden outbreak of the COVID-19 pandemic has led to the changing consumer inclination from conventional brick-and-mortar distribution channels towards online retail platforms for the purchase of cereal bars.
The rising consumer health-consciousness, along with the growing inclination towards gluten and sugar-free, and Non-Genetically Modified (non-GMO) variants with no additives and preservatives, is primarily driving the global cereal bars market.
Based on the product, the global cereal bars market has been segmented into snacks bar, energy and nutrition bar, and others. Currently, snacks bar holds the majority of the total market share.
Based on the distribution channel, the global cereal bars market can be categorized into supermarkets and hypermarkets, food specialty stores, convenience stores, online stores, and others. Among these, supermarkets and hypermarkets currently account for the largest market share.
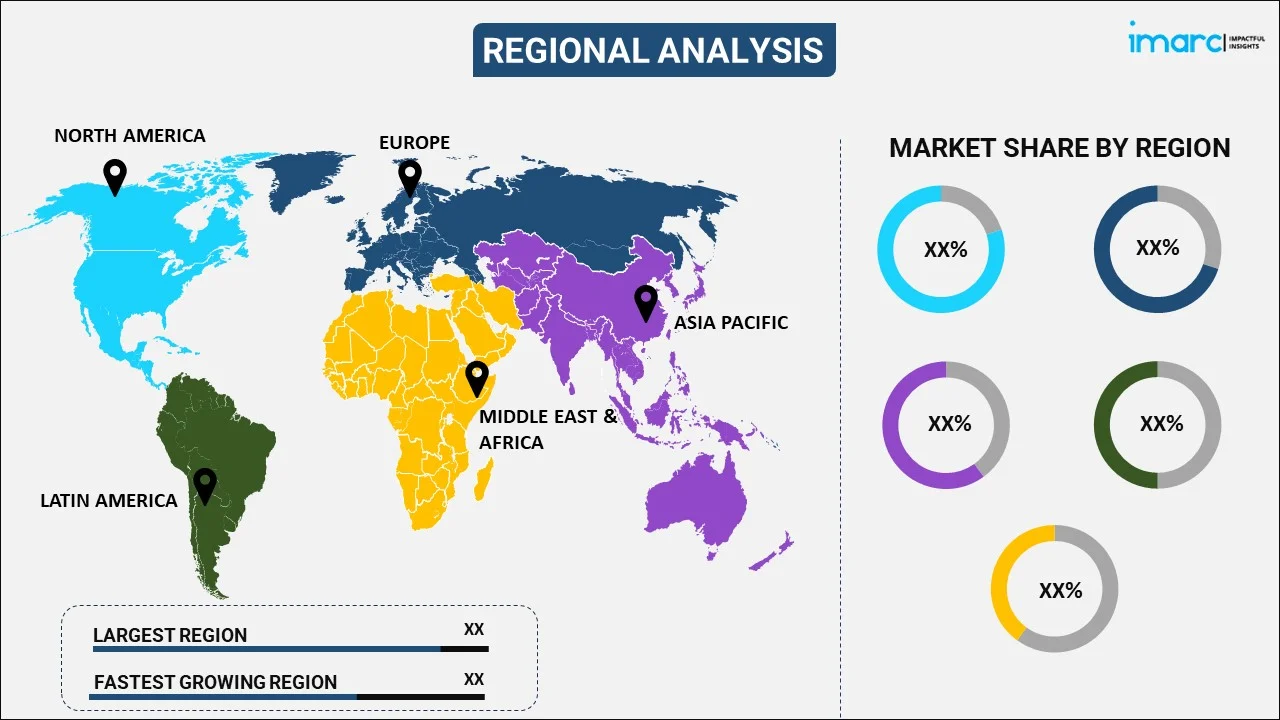
On a regional level, the market has been classified into North America, Asia Pacific, Europe, Latin America, and Middle East and Africa, where North America currently dominates the global market.
Some of the major players in the global cereal bars market include Atkins Nutritionals Inc. (Simply Good Foods Co.), Clif Bar & Company, Eat Natural, General Mills Inc., Kellogg Company, Kind LLC, McKee Foods Corporation, Nestlé S.A, Otsuka Pharmaceutical, and Quaker Oats Co. (PepsiCo).
Need more help?
- Speak to our experienced analysts for insights on the current market scenarios.
- Include additional segments and countries to customize the report as per your requirement.
- Gain an unparalleled competitive advantage in your domain by understanding how to utilize the report and positively impacting your operations and revenue.
- For further assistance, please connect with our analysts.
 Request Customization
 Speak to an Analyst
 Request Brochure
 Inquire Before Buying
Benefits of Customization
- Personalize this research
- Triangulate with your data
- Get data as per your format and definition
- Gain a deeper dive into a specific application, geography, customer, or competitor
- Any level of personalization
Get in Touch With Us
UNITED STATES
Phone: +1-201-971-6302
INDIA
Phone: +91-120-433-0800
UNITED KINGDOM
Phone: +44-753-714-6104
Email: [email protected]
Client Testimonials


.webp)


