
Europe Organic Aquaculture Market Report by Species (Mussel, Trout, Salmon, Oyster, Carp, Seabass and Seabream, and Others), Form (Canned, Frozen, Fresh or Chilled, and Others), Culture Environment (Freshwater, Marine, Brackish Water), End Use (Household, Commercial), Distribution Channel (Supermarkets and Hypermarkets, Convenience Stores, Hotels and Restaurants, Online Sales, and Others), and Country 2026-2034
Market Overview:
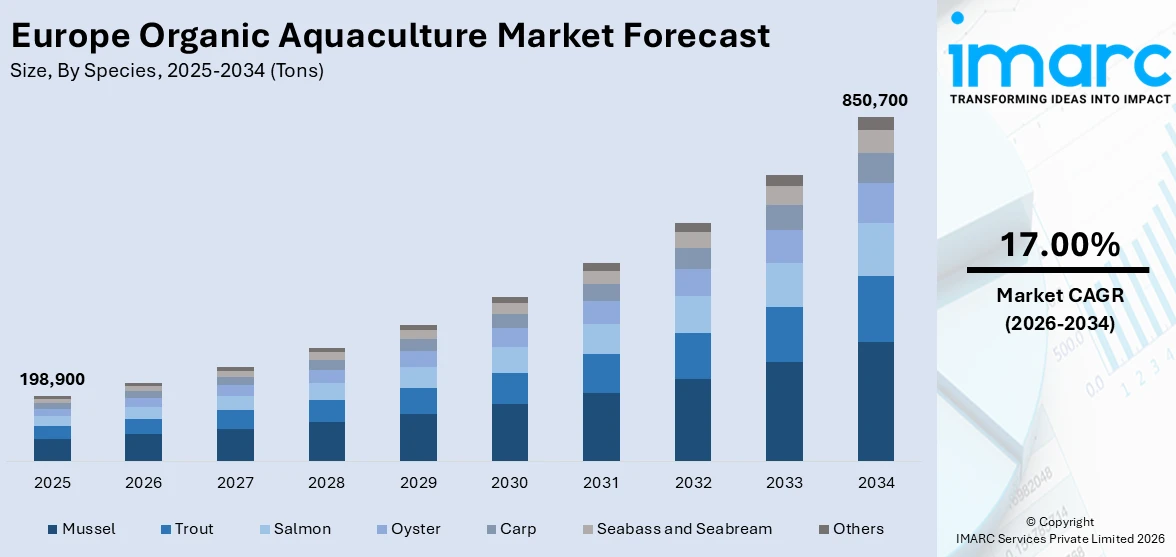
The Europe organic aquaculture market size reached 198,900 Tons in 2025. Looking forward, IMARC Group expects the market to reach 850,700 Tons by 2034, exhibiting a growth rate (CAGR) of 17.00% during 2026-2034.
|
Report Attribute
|
Key Statistics
|
|---|---|
|
Base Year
|
2025
|
|
Forecast Years
|
2026-2034
|
|
Historical Years
|
2020-2025
|
|
Market Size in 2025
|
198,900 Tons |
|
Market Forecast in 2034
|
850,700 Tons |
| Market Growth Rate 2026-2034 | 17.00% |
Organic aquaculture refers to the process of cultivating aquatic species without using synthetic fertilizers, pesticides, herbices, GMOs in stocking and feeding material and focusing on the vegetable-based feed ingredients and additives such as soybean, corn, fish oil, fish meal, etc. Organic aquaculture practices offer a wide variety of nutritional, growth-promoting, and immune-resistant benefits to the farmed aquatic animals. Furthermore, they also help in maintaining a viable and sustainable aquatic ecosystem by limiting the introduction of harmful substances. As a result, organic aquaculture practices are extensively adopted for cultivating various aquatic species, including trout, mussels, salmon, oyster, carp, etc.
To get more information on this market Request Sample
In Europe, the growing consumer concerns towards the high prevalence of numerous pathogens present in conventionally cultured seafood products are primarily augmenting the market for organic aquaculture practices. Additionally, the rising consumer disposable income levels along with their improving living standards are further catalyzing the per capita expenditures on premium seafood products, mainly including organically-sourced variants. Moreover, the growing demand for organic fish oil across several sectors, including pharmaceuticals, food and beverages, nutraceuticals, etc., is also driving the market growth in Europe. Besides this, the rising awareness among breeders towards the long-term and sustainable benefits of adopting organic aquaculture practices is further bolstering the demand for organic aquafeed. Moreover, the European Commission is constantly focusing to reduce the adverse impact of chemical-based aquaculture methods on marine and freshwater ecosystems, thereby fueling the market growth. Apart from this, the increasing demand for canned and frozen organic seafood variants will continue to drive the market for organic aquaculture in Europe over the coming years.
.webp)
Key Market Segmentation:
IMARC Group provides an analysis of the key trends in each segment of the Europe organic aquaculture market report, along with forecasts at the regional and country levels from 2026-2034. Our report has categorized the market based on species, form, culture environment, end use and distribution channel.
Breakup by Species:
- Mussel
- Trout
- Salmon
- Oyster
- Carp
- Seabass and Seabream
- Others
Breakup by Form:
- Canned
- Frozen
- Fresh or Chilled
- Others
Breakup by Culture Environment:
- Freshwater
- Marine
- Brackish Water
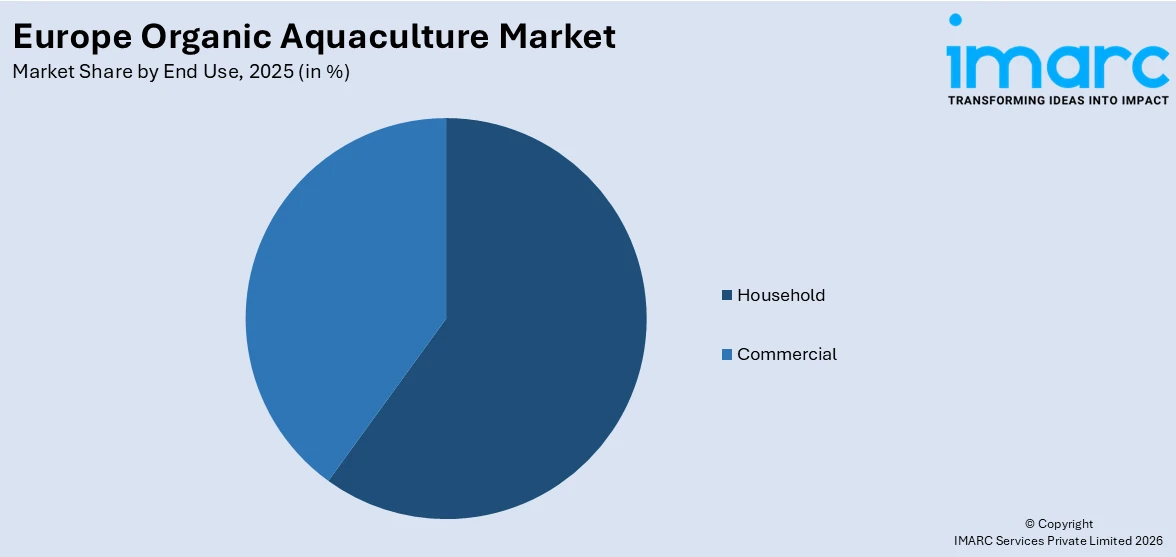
Breakup by End Use:
Access the comprehensive market breakdown Request Sample
- Household
- Commercial
Breakup by Distribution Channel:
- Supermarkets and Hypermarkets
- Convenience Stores
- Hotels and Restaurants
- Online Sales
- Others
Breakup by Country:
- Ireland
- Norway
- Romania
- Italy
- Germany
- Spain
- Others
Competitive Landscape:
The competitive landscape of the industry has also been examined with some of the key players being Aqualande, Blackshell Farm Ltd, Biofisch GmbH, Cromaris D.D, Cultimer France Producteurs Associes, Glenarm Organic Salmon Limited, Kaerhede Dambrug ApS (Frea Aquaculture Solutions Aps), Kush Shellfish, Mowi ASA, Musholm A/S (Okamura Foods Co.,Ltd), SalMar ASA and Vilsund Blue A/S.
Report Coverage:
| Report Features | Details |
|---|---|
| Base Year of the Analysis | 2025 |
| Historical Period | 2020-2025 |
| Forecast Period | 2026-2034 |
| Units | Million USD, '000 Tons |
| Segment Coverage | Species, Form, Culture Environment, End Use, Distribution Channel, Country |
| Countries Covered | Ireland, Norway, Romania, Italy, Germany, Spain, Others |
| Companies Covered | Aqualande, Blackshell Farm Ltd, Biofisch GmbH, Cromaris D.D, Cultimer France Producteurs Associes, Glenarm Organic Salmon Limited, Kaerhede Dambrug ApS (Frea Aquaculture Solutions Aps), Kush Shellfish, Mowi ASA, Musholm A/S (Okamura Foods Co.,Ltd), SalMar ASA and Vilsund Blue A/S |
| Customization Scope | 10% Free Customization |
| Post-Sale Analyst Support | 10-12 Weeks |
| Delivery Format | PDF and Excel through Email (We can also provide the editable version of the report in PPT/Word format on special request) |
Key Questions Answered in This Report:
- How has the Europe organic aquaculture market performed so far and how will it perform in the coming years?
- What has been the impact of COVID-19 on the Europe organic aquaculture market?
- What is the breakup of the market based on the species?
- What is the breakup of the market based on the form?
- What is the breakup of the market based on the culture environment?
- What is the breakup of the market based on the end use?
- What is the breakup of the market based on the distribution channel?
- What is the breakup of the market based on the country?
- What are the various stages in the value chain of the industry?
- What are the key driving factors and challenges in the industry?
- What is the structure of the Europe organic aquaculture market and who are the key players?
- What is the degree of competition in the industry?
Need more help?
- Speak to our experienced analysts for insights on the current market scenarios.
- Include additional segments and countries to customize the report as per your requirement.
- Gain an unparalleled competitive advantage in your domain by understanding how to utilize the report and positively impacting your operations and revenue.
- For further assistance, please connect with our analysts.
 Request Customization
 Speak to an Analyst
 Request Brochure
 Inquire Before Buying
Benefits of Customization
- Personalize this research
- Triangulate with your data
- Get data as per your format and definition
- Gain a deeper dive into a specific application, geography, customer, or competitor
- Any level of personalization
Get in Touch With Us
UNITED STATES
Phone: +1-201-971-6302
INDIA
Phone: +91-120-433-0800
UNITED KINGDOM
Phone: +44-753-714-6104
Email: [email protected]
Client Testimonials


.webp)


