
Graph Database Market Report by Component (Software, Services), Type of Database (Relational (SQL), Non-Relational (NoSQL)), Analysis Type (Path Analysis, Connectivity Analysis, Community Analysis, Centrality Analysis), Deployment Model (On-premises, Cloud-based), Application (Fraud Detection and Risk Management, Master Data Management, Customer Analytics, Identity and Access Management, Recommendation Engine, Privacy and Risk Compliance, and Others), Industry Vertical (BFSI, Retail and E-Commerce, IT and Telecom, Healthcare and Life Science, Government and Public Sector, Media and Entertainment, Manufacturing, Transportation and Logistics, and Others), and Region 2025-2033
Global Graph Database Market:
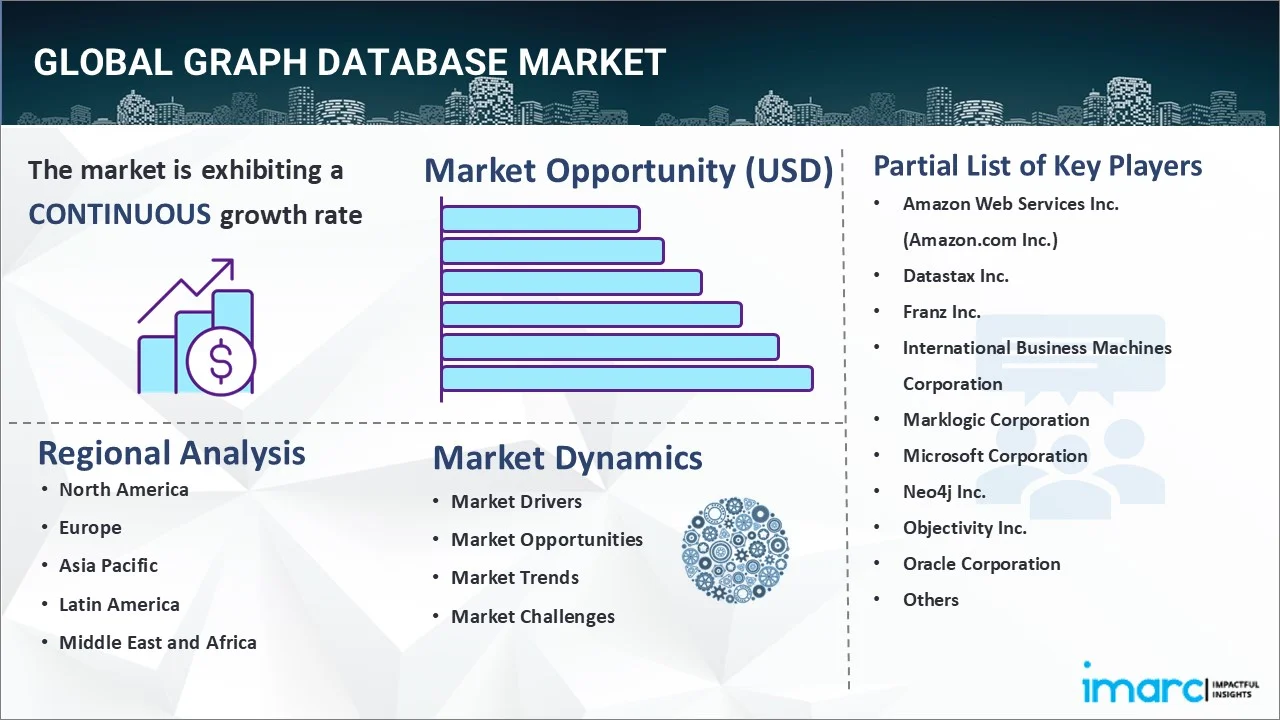
The global graph database market size reached USD 2.0 Billion in 2024. Looking forward, IMARC Group expects the market to reach USD 8.6 Billion by 2033, exhibiting a growth rate (CAGR) of 17.57% during 2025-2033. The increasing adoption of graph databases in cybersecurity for threat detection and network analysis, growing demand for real-time analytics and AI-driven insights, and expanding application in industries, such as healthcare and finance, for data integration and personalized services, are some of the key factors catalyzing the market growth.
|
Report Attribute
|
Key Statistics |
|---|---|
|
Base Year
|
2024 |
|
Forecast Years
|
2025-2033 |
|
Historical Years
|
2019-2024
|
| Market Size in 2024 | USD 2.0 Billion |
| Market Forecast in 2033 | USD 8.6 Billion |
| Market Growth Rate 2025-2033 | 17.57% |
Graph Database Market Analysis:
- Major Market Drivers: The rising usage of graph database solutions in different industry verticals, such as retail, information technology (IT), telecommunications, manufacturing, transportation, and banking, financial services and insurance (BFSI), represents one of the key factors propelling the market growth.
- Key Market Trends: The growing adoption of artificial intelligence (AI)-based graph database tools across the world is one of the significant key trends driving the growth of the market.
- Competitive Landscape: Some of the leading graph database market companies are Amazon Web Services Inc. (Amazon.com Inc.), Datastax Inc., Franz Inc., International Business Machines Corporation, Marklogic Corporation, Microsoft Corporation, Neo4j Inc., Objectivity Inc., Oracle Corporation, Stardog Union, Tibco Software Inc., and Tigergraph Inc., among others.
- Geographical Trends: According to the report, North America currently dominates the global market. The expanding use of technology in the region is one of the main reasons promoting the growth of the graph database market. The expansion of graph database players across North America, such as IBM, Microsoft, Neo4j, and Oracle., is anticipated to drive market expansion further.
- Challenges and Opportunities: Challenges in the graph database market include data privacy concerns, complexity in migrating from relational databases, and the need for skilled personnel. Opportunities lie in addressing evolving use cases such as fraud detection, personalized recommendation systems, and knowledge graph applications, driving innovation and market expansion.
Graph Database Market Trends:
Rising Volume and Complexity of Data
One of the primary factors driving the growth of the market is the increasing volume of data generated by numerous organizations across the world. With the advent of next-generation technologies and the proliferation of connected devices, businesses are producing vast amounts of data from various sources, including social media, customer interaction, IoT devices, transactions, and cloud computing. For instance, according to Cisco, the IoT generated approximately 507.5 zettabytes of data in 2019. A survey by the Ponemon Institute and the Shared Assessments Program also shared that at least 81% of risk oversight and corporate governance professionals believe data breaches happened by an unsecured IoT device within their company. In response to this, companies are increasingly integrating graph database solutions to drive valuable insights from the data and ensure the security and accuracy of their data by providing data cleansing, validation, and enrichment capabilities. This, in turn, is projected to fuel the graph database market demand in the coming years.
Increasing Product Offerings
Various key players are introducing a variety of graph database solutions catering to different use cases and requirements. For instance, in April 2024, Neo4j partnered with Google Cloud to launch new GraphRAG capabilities for GenAI applications. This launch will speed up generative AI application development and deployment across several crucial stages. The results solve a problem for enterprises that struggle with complexity and hallucinations when building and deploying successful GenAI applications requiring real-time, contextually rich data and accurate, explainable results. Similarly, in December 2023, Amazon Web Services (AWS) launched a new analytics database engine that combines the power of vector search and graph data. The general availability of the new service, named Amazon Neptune Analytics, was unveiled at the re-invest conference in Las Vegas. The new service is available as a pay-as-you-go model with no one-time setup fees or recurring subscriptions. It is now available in some AWS regions, including the US East, the US West, Asia Pacific, and Europe. Such innovations in graph databases are anticipated to propel the graph database market share in the coming years.
Growing Product Application across Various Industries
Graph databases are being adopted across various industries, including finance, healthcare, retail, logistics, and manufacturing, to address specific use cases and business challenges. For instance, in January 2024, the R&D arm of global pharmaceutical company Servier started to utilize graph technologies to cut drug research time and improve the success rate of drug candidates in the clinical phase. The company is using Neo4j’s graph called Pegasus, which allows them to better organize and probe both third-party and proprietary data. Similarly, the escalating utilization of graph databases in the financial sector to detect and prevent fraudulent activities is also catalyzing the graph database market’s recent price. For instance, graph databases such as Amazon Neptune are increasingly being used to perform queries because they can traverse the data and perform calculations simultaneously. Graphs represent transactions and parties over a multi-connected network and discover patterns and chains of connections. As a result, graph databases are extensively being used in anti-money laundering (AML) applications since they can help find patterns of suspicious transactions.
Global Graph Database Market Segmentation:
IMARC Group provides an analysis of the key trends in each segment of the global graph database market report, along with forecasts at the global, regional, and country levels from 2025-2033. Our report has categorized the market based on component, type of database, analysis type, deployment model, application, and industry vertical.
Breakup by Component:
- Software
- Services
Software represents the largest market share
Based on the component, the global graph database market can be segmented into software and services. According to the report, software represents the largest market share.
The growth of the segment can be attributed to the increasing adoption of software-as-a-service (SaaS) by numerous companies to manage their complex data. Moreover, graph database market statistics by IMARC indicate that software deployment often involves upfront licensing or subscription fees, which can be more cost-effective in the long run, especially for organizations with ongoing data management needs.
Breakup by Type of Database:
- Relational (SQL)
- Non-Relational (NoSQL)
Relational (SQL) database exhibits a clear dominance in the market
Based on the type of database, the global graph database market can be segmented into relational (SQL) and non-relational (NoSQL). According to the report, relational (SQL) database exhibits a clear dominance in the market.
Integrating relational (SQL) databases with graph databases allows for leveraging the strengths of both models. SQL databases excel in structured data storage and complex queries, while graph databases specialize in managing and querying complex relationships. Combining them enables efficient storage of structured data alongside flexible representation and traversal of relationships, offering a comprehensive solution for diverse data management needs. This integration facilitates seamless data analysis, insights generation, and application development across a wide range of use cases, enhancing overall agility and scalability.
Breakup by Analysis Type:
- Path Analysis
- Connectivity Analysis
- Community Analysis
- Centrality Analysis
Path analysis holds the majority of the total market share
Based on the analysis type, the global graph database market can be segmented into path analysis, connectivity analysis, community analysis, and centrality analysis. According to the graph database market report, path analysis holds the majority of the total market share.
Path analysis in graph databases involves traversing the relationships between nodes to identify patterns or paths of interest. It enables querying and analyzing the sequence of nodes and edges to uncover insights or answer specific questions about the data. Path analysis is crucial for tasks like recommendation systems, fraud detection, and network analysis, offering valuable insights into the structure and behavior of interconnected data. By examining paths within the graph, organizations can derive actionable insights and make informed decisions based on the underlying relationships.
Breakup by Deployment Model:
- On-premises
- Cloud-based
On-premises model accounts for the majority of the total market share
Based on the deployment model, the global graph database market can be segmented into on-premises and cloud-based. According to the report, on-premises model accounts for the majority of the total market share.
On-premises deployment of graph databases involves installing and managing the database software within an organization's own data center or infrastructure. This approach offers greater control over data security, compliance, and performance compared to cloud-based alternatives. On-premises deployment is preferred in industries with strict regulatory requirements or sensitive data concerns, providing a dedicated environment for data management and processing. For instance, various companies operating in the BFSI sector are increasingly deploying graph databases within their own data centers, which is positively impacting the graph database market outlook. Manhattan-based FinTech Current’s is increasingly utilizing graph database technology to build new financial services for customers and creating a set of ‘hybrid finance’ products based on integrated views of individuals and their family connections. Besides this, on-premises deployment of graph databases allows organizations to leverage existing infrastructure investments and tailor the deployment to their specific needs and preferences.
Breakup by Application:
- Fraud Detection and Risk Management
- Master Data Management
- Customer Analytics
- Identity and Access Management
- Recommendation Engine
- Privacy and Risk Compliance
- Others
Based on the application, the global graph database market can be segmented into fraud detection and risk management, master data management, customer analytics, identity and access management, recommendation engine, privacy and risk compliance, and others.
Graph databases are widely used in the banking and financial sector to detect and prevent fraudulent activities. For instance, graph databases such as Amazon Neptune are increasingly being used to perform queries, because they can traverse the data and perform calculations simultaneously. Graphs represent transactions and parties over a multi-connected network and discover patterns and chains of connections. As a result, graph databases are extensively being used in anti-money laundering (AML) applications, since they can help find patterns of suspicious transactions. Besides this, the demand for data compliance and the growing usage of master data management solutions in prominent companies to improve business operations is likely to fuel the graph database market revenue.
Breakup by Industry Vertical:
- BFSI
- Retail and E-Commerce
- IT and Telecom
- Healthcare and Life Science
- Government and Public Sector
- Media and Entertainment
- Manufacturing
- Transportation and Logistics
- Others
IT and telecom industry represents the largest market share
Based on the industry vertical, the global graph database market has been segmented into BFSI, retail and e-commerce, IT and telecom, healthcare and life science, government and public sector, media and entertainment, manufacturing, transportation and logistics, and others. According to the report, the IT and telecom industry represents the largest market share.
In the IT and telecom industry, graph databases are utilized for network topology management, fault analysis, and service provisioning. They enable real-time monitoring of network infrastructure, identifying bottlenecks, and optimizing resource allocation. Graph databases also facilitate customer relationship management by mapping complex interactions between customers, services, and devices, enhancing service personalization and troubleshooting efficiency.
Breakup by Region:
- North America
- United States
- Canada
- Asia-Pacific
- China
- Japan
- India
- South Korea
- Australia
- Indonesia
- Others
- Europe
- Germany
- France
- United Kingdom
- Italy
- Spain
- Russia
- Others
- Latin America
- Brazil
- Mexico
- Others
- Middle East and Africa
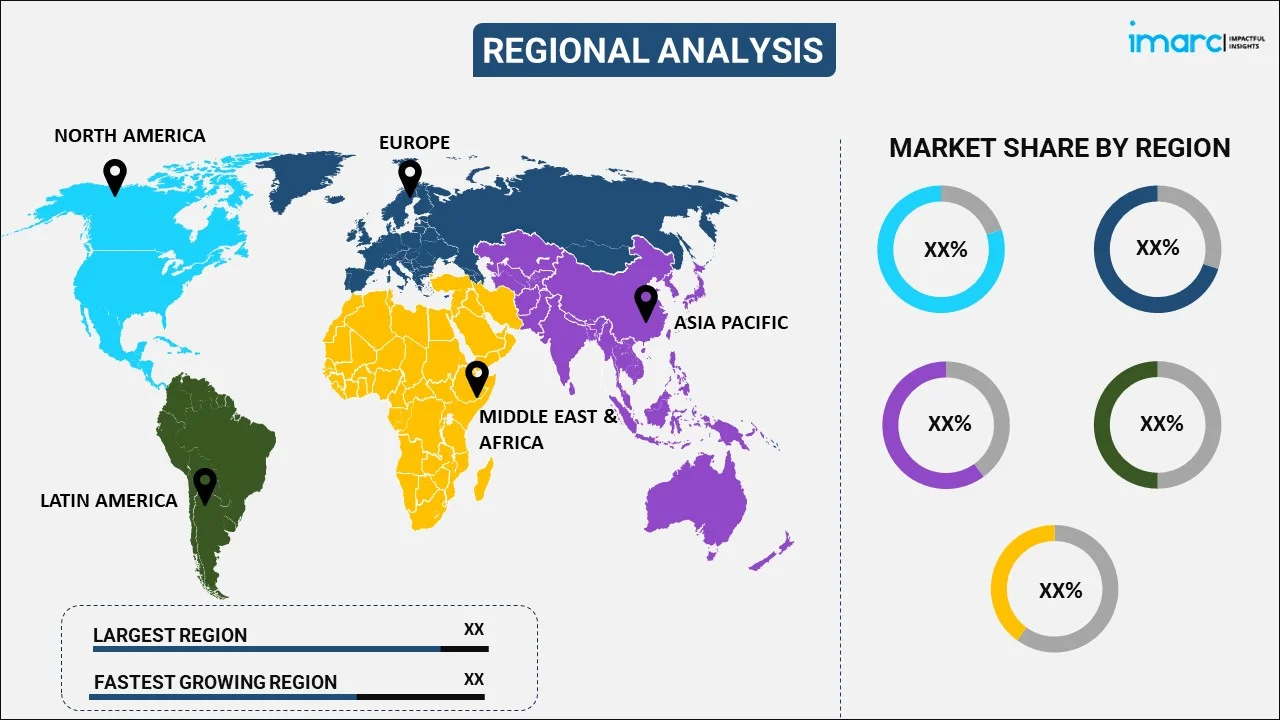
North America currently dominates the global market
The market research report has also provided a comprehensive analysis of all the major regional markets, which include North America (the United States and Canada); Asia Pacific (China, Japan, India, South Korea, Australia, Indonesia, and others); Europe (Germany, France, the United Kingdom, Italy, Spain, Russia, and others); Latin America (Brazil, Mexico, and others); and the Middle East and Africa. According to the report, North America currently dominates the global market.
The expanding use of technology in the region is one of the main reasons promoting the growth of the graph database market in North America. The expansion of graph database players across the region, such as IBM, Microsoft, Neo4j, Oracle, etc., is anticipated to drive market expansion further. Moreover, the graph database market overview by IMARC indicates that the growth of R&D spending by significant regional economies is helping the development of new technologies in the North America graph database market. For instance, in June 2022, Ataccama, a unified data management and governance solutions provider, secured US$150 Million in a growth capital investment round, money that was used to finance the company's efforts to develop new products and expand its market presence.
Competitive Landscape:
The market research report has provided a comprehensive analysis of the competitive landscape and outlook. Detailed profiles of all major companies have also been provided. Some of the key players in the market include:
- Amazon Web Services Inc. (Amazon.com Inc.)
- Datastax Inc.
- Franz Inc.
- International Business Machines Corporation
- Marklogic Corporation
- Microsoft Corporation
- Neo4j Inc.
- Objectivity Inc.
- Oracle Corporation
- Stardog Union
- Tibco Software Inc.
- Tigergraph Inc.
(Please note that this is only a partial list of the key players, and the complete list is provided in the report.)
Graph Database Market Recent Developments:
- March 2024: PuppyGraph, a pioneering force in graph database analysis, launched the first and only graph query engine, transforming traditional data storage into dynamic graph engines. This innovation simplifies data storage, obsoleting graph database complexities and streamlining AI integration for advanced analytics and Large Language Models (LLMs).
- March 2024: Neo4j, a graph database and analytics leader, announced a collaboration with Microsoft to deliver a unified data offering that addresses customer’s data need for generative AI (GenAI).
- December 2023: Amazon Web Services (AWS) launched a new analytics database engine that combines the power of vector search and graph data. The general availability of the new service, named Amazon Neptune Analytics, was unveiled at the re-Invest conference in Las Vegas. The new service is available as a pay-as-you-go model with no one-time setup fees or recurring subscriptions. It is now available in some AWS regions, including the US East, the US West, Asia Pacific, and Europe.
Global Graph Database Market Report Scope:
| Report Features | Details |
|---|---|
| Base Year of the Analysis | 2024 |
| Historical Period | 2019-2024 |
| Forecast Period | 2025-2033 |
| Units | Billion USD |
| Scope of the Report | Exploration of Historical Trends and Market Outlook, Industry Catalysts and Challenges, Segment-Wise Historical and Future Market Assessment:
|
| Components Covered | Software, Services |
| Type of Databases Covered | Relational (SQL), Non-Relational (NoSQL) |
| Analysis Types Covered | Path Analysis, Connectivity Analysis, Community Analysis, Centrality Analysis |
| Deployment Models Covered | On-premises, Cloud-based |
| Applications Covered | Fraud Detection and Risk Management, Master Data Management, Customer Analytics, Identity and Access Management, Recommendation Engine, Privacy and Risk Compliance, Others |
| Industry Verticals Covered | BFSI, Retail and E-Commerce, IT and Telecom, Healthcare and Life Science, Government and Public Sector, Media and Entertainment, Manufacturing, Transportation and Logistics, Others |
| Regions Covered | Asia Pacific, Europe, North America, Latin America, Middle East and Africa |
| Countries Covered | United States, Canada, Germany, France, United Kingdom, Italy, Spain, Russia, China, Japan, India, South Korea, Australia, Indonesia, Brazil, Mexico |
| Companies Covered | Amazon Web Services Inc. (Amazon.com Inc.), Datastax Inc., Franz Inc., International Business Machines Corporation, Marklogic Corporation, Microsoft Corporation, Neo4j Inc., Objectivity Inc., Oracle Corporation, Stardog Union, Tibco Software Inc., Tigergraph Inc, etc. |
| Customization Scope | 10% Free Customization |
| Post-Sale Analyst Support | 10-12 Weeks |
| Delivery Format | PDF and Excel through Email (We can also provide the editable version of the report in PPT/Word format on special request) |
Key Benefits for Stakeholders:
- IMARC’s industry report offers a comprehensive quantitative analysis of various market segments, historical and current market trends, market forecasts, and dynamics of the graph database market from 2019-2033.
- The research report provides the latest information on the market drivers, challenges, and opportunities in the global graph database market.
- The study maps the leading, as well as the fastest-growing, regional markets. It further enables stakeholders to identify the key country-level markets within each region.
- Porter's five forces analysis assists stakeholders in assessing the impact of new entrants, competitive rivalry, supplier power, buyer power, and the threat of substitution. It helps stakeholders to analyze the level of competition within the graph database industry and its attractiveness.
- The competitive landscape allows stakeholders to understand their competitive environment and provides insight into the current positions of key players in the market.
Key Questions Answered in This Report
The global graph database market was valued at USD 2.0 Billion in 2024.
We expect the global graph database market to exhibit a CAGR of 17.57% during 2025-2033.
The growing applications of graph database solutions in supply chain management and data mining of social media data and its escalating application in customer analytics are some of the graph database market recent opportunities, driving the growth of the market.
The sudden outbreak of the COVID-19 pandemic has led to the increasing adoption of graph database solutions among researchers to monitor the spread of the coronavirus infection and introduce numerous measures to combat the risk.
Based on the component, the global graph database market can be segregated into software and services. Currently, software represents the largest market share.
Based on the type of database, the global graph database market has been divided into relational (SQL) and non-relational (NoSQL), where relational (SQL) database exhibits a clear dominance in the market.
Based on the analysis type, the global graph database market can be categorized into path analysis, connectivity analysis, community analysis, and centrality analysis. According to the graph database market forecast by IMARC, path analysis holds the majority of the total market share.
Based on the deployment model, the global graph database market can be bifurcated into on-
premises and cloud-based, where on-premises model accounts for the majority of the total market share.
Based on the industry vertical, the global graph database market has been segmented into BFSI,
retail and e-commerce, IT and telecom, healthcare and life science, government and public sector, media and entertainment, manufacturing, transportation and logistics, and others. Among these, the IT and telecom industry represents the largest market share.
On a regional level, the market has been classified into North America, Europe, Asia-Pacific, Middle East and Africa, and Latin America, where North America currently dominates the global market.
Some of the major players in the global graph database market include Amazon Web Services Inc. (Amazon.com Inc.), Datastax Inc., Franz Inc., International Business Machines Corporation, Marklogic Corporation, Microsoft Corporation, Neo4j Inc., Objectivity Inc., Oracle Corporation, Stardog Union, Tibco Software Inc., and Tigergraph Inc.
Need more help?
- Speak to our experienced analysts for insights on the current market scenarios.
- Include additional segments and countries to customize the report as per your requirement.
- Gain an unparalleled competitive advantage in your domain by understanding how to utilize the report and positively impacting your operations and revenue.
- For further assistance, please connect with our analysts.
 Request Customization
 Speak to an Analyst
 Request Brochure
 Inquire Before Buying
Benefits of Customization
- Personalize this research
- Triangulate with your data
- Get data as per your format and definition
- Gain a deeper dive into a specific application, geography, customer, or competitor
- Any level of personalization
Get in Touch With Us
UNITED STATES
Phone: +1-201-971-6302
INDIA
Phone: +91-120-433-0800
UNITED KINGDOM
Phone: +44-753-714-6104
Email: sales@imarcgroup.com
Client Testimonials


.webp)


