
Micro and Nano PLC Market Report by Type (Micro PLC, Nano PLC), Offering (Hardware, Software, Services), Architecture (Modular PLC, Fixed/Compact PLC), End Use Industry (Automotive, Chemicals, Pharmaceuticals, Oil and Gas, Power, Metal and Mining, and Others), and Region 2026-2034
Micro and Nano PLC Market Size:
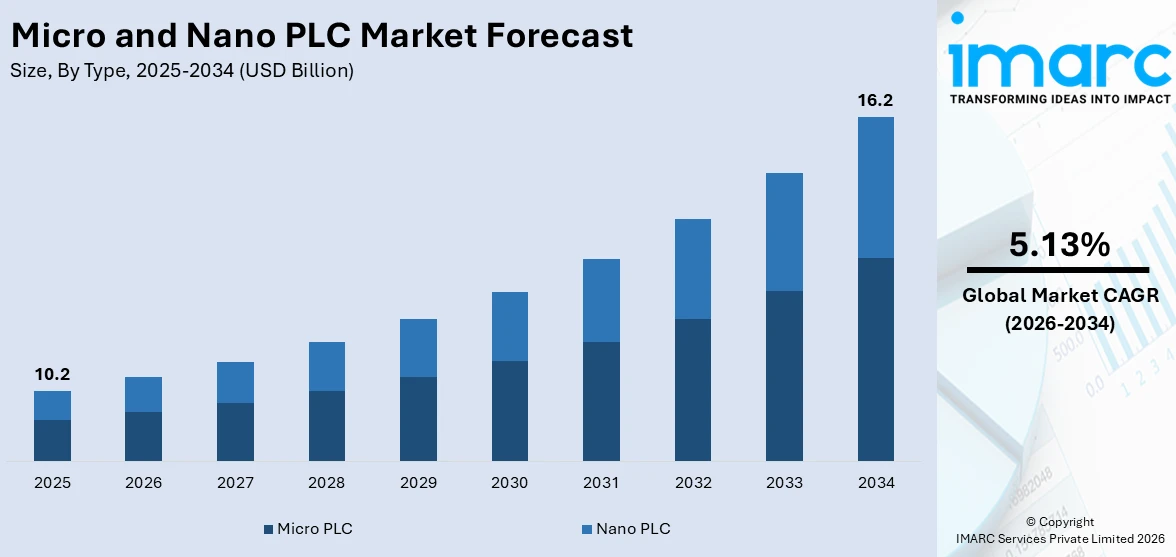
The global micro and nano PLC market size reached USD 10.2 Billion in 2025. Looking forward, IMARC Group expects the market to reach USD 16.2 Billion by 2034, exhibiting a growth rate (CAGR) of 5.13% during 2026-2034. The market is experiencing significant growth mainly due to increasing automation in industries, the rising demand for compact and efficient control systems and significant technological advancements, along with rapid industrialization and the widespread adoption of industrial robots.
|
Report Attribute
|
Key Statistics
|
|---|---|
|
Base Year
|
2025
|
|
Forecast Years
|
2026-2034
|
|
Historical Years
|
2020-2025
|
|
Market Size in 2025
|
USD 10.2 Billion |
|
Market Forecast in 2034
|
USD 16.2 Billion |
| Market Growth Rate 2026-2034 | 5.13% |
Micro and Nano PLC Market Analysis:
- Major Market Drivers: The key drivers of the market include the rising need for automation across various industries which enhances operational efficiency and precision. The demand for compact, cost effective and energy efficient control systems is on the rise mainly driven by the advancements in industrial processes and the miniaturization of electric components. The growth of industry 4.0 and the integration of IoT in manufacturing is also propelling the market growth as these PLCs are an indispensable component for smart manufacturing and real time data processing. Furthermore, the expansion of automotive, pharmaceutical and food beverage sector also stimulates the micro and nano PLC market growth.
- Key Market Trends: Key trends in the market mainly includes the rising adoption of industry 4.0 and the Industrial Internet of Things (IIoT) which emphasizes the need for smart, interconnected devices that is capable of real time data processing and control. There is also a growing shift towards wireless and remote control capabilities further enabling more flexible and scalable automation solutions. Logical advancements in miniaturization and energy efficiency are leading to more compact and power saving PLC designs making them more suitable for a wider range of applications. Furthermore, the integration of advanced features like artificial intelligence and machine learning into PLCs is enhancing their functionality and performance. The rising demand for customized and application specific solutions is on the rise thereby propelling its market growth.
- Geographical Trends: Geographical trends of the market show significant growth in regions like Asia Pacific, North America and Europe. In Asia Pacific, the rapid industrialization along with the expansion of manufacturing sectors and adoption of automation technologies in countries like China, Japan and South Korea are driving the market growth. In North America mainly in United States there is substantial product demand due to advanced manufacturing practices, widespread adoption of industry 4.0 and investments in technological innovation. Europe continues to be a key market with its established industrial base and strict regulatory standards, driven by the need for efficient and compact automation solutions. Furthermore, Latin America and Middle East are gradually adopting micro and nano PLCs due to rising industrial activities and modernization efforts.
- Competitive Landscape: Some of the major market players in the micro and nano PLC industry include ABB Ltd., B&R Industrial Automation GmbH, General Electric Company, IDEC Corporation, Mitsubishi Electric Corporation, Omron Corporation, Robert Bosch Stiftung Gmbh, Rockwell Automation Inc., Schneider Electric and Siemens Aktiengesellschaft, among many others.
- Challenges and Opportunities: The market faces various challenges like high initial costs and the complexity of integrating these systems into existing industrial setups which can affect smaller enterprises. There are also concerns regarding cyber security because with increased connectivity there is a higher risk of cyber-attacks. However, significant opportunities exist mainly driven by the growing adoption of industry 4.0 and Industrial Internet of Things (IIoT). These trends demand for advanced and compact automation solutions. In line with this, the rise of smart manufacturing and growing investment in digital transformation is also propelling the market growth. Technological advancements in miniaturization, energy efficiency and the integration of artificial intelligence and machine learning into PLCs presents further opportunities to enhance functionality and appeal a broader range of application and industries.
To get more information on this market Request Sample
Micro and Nano PLC Market Trends:
Rising Adoption of Industry 4.0 and IIoT
The rise of industry 4.0 and Industrial Internet of Things (IIoT) emphasizes the need for smart and interconnected devices which are capable for real time data processing and automation. According to a report published by IoT Analytics, the funding for industry 4.0 startups is on the rise reaching $ 2.2 billion in the year 2021 with 2513 deals since 2011. COVID-19 and recent economic challenges have impacted the funding rounds. There were 132 acquisitions in year 2021. Notable deals include AspenTech acquired by Emerson for $11 billion and Fetch Robotics acquired by Zebra Technologies for $290 million. Micro and nano PLCs are indispensable component to these systems because it enables efficient and precise control of industrial processes. Their ability to seamlessly integrate with IIoT devices allows for enhanced monitoring, diagnostics and maintenance, ultimately improving productivity and reducing downtime.
Integration of AI and Machine Learning
The incorporation of artificial intelligence (AI) and machine learning (ML) into PLCs is enhancing their functionality and performance. AI-enabled PLCs can perform predictive maintenance, optimize process controls, and adapt to changing conditions in real-time, improving overall efficiency and reducing downtime. For instance, Yokogawa integrated AI capabilities into its recorders and PLCs, including the AI Future Pen for predictive data visualization, AI anomaly detection for identifying abnormal equipment behavior and enabling predictive maintenance, and e-RT3 Plus, an industrial AI platform that facilitates the development of AI applications using Python-based software libraries. Machine learning algorithms allow PLCs to analyze historical data and identify patterns, enabling smarter decision-making and automation. This integration is driving innovation in industrial automation, providing advanced solutions that can meet the complex demands of modern manufacturing and processing environments.
Miniaturization and Energy Efficiency
Advances in technology are leading to smaller, more power-efficient PLCs. Miniaturization allows these devices to be used in applications with space constraints, expanding their usability across various industries. For instance, Phoenix Contact introduced the MINI Analog Pro 6.2 mm signal conditioner family with new Ex i versions that provide explosion protection and functional safety in a compact design, suitable for use in PLCs and industrial automation systems where space is limited, and safety is a priority. Energy-efficient PLCs reduce power consumption and operational costs, making them attractive for industries focused on sustainability and cost-effectiveness. These advancements also enable the development of portable and mobile automation solutions, further broadening the scope of applications for Micro and Nano PLCs. The trend towards compact, energy-saving devices aligns with the growing emphasis on green technologies and environmental responsibility.
Micro and Nano PLC Market Segmentation:
IMARC Group provides an analysis of the key trends in each segment of the market, along with forecasts at the global, regional, and country levels for 2026-2034. Our report has categorized the market based on type, offering, architecture and end use industry.
Breakup by Type:
- Micro PLC
- Nano PLC
Micro PLC accounts for the majority of the market share
The report has provided a detailed breakup and analysis of the market based on the type. This includes micro PLC and nano PLC. According to the report, micro PLC represented the largest segment.
Micro PLCs account for the majority of the Micro and Nano PLC market share due to their versatility, cost-effectiveness, and broad application range. They are widely adopted across various industries, including manufacturing, automotive, and packaging, for their ability to perform complex control tasks within a compact footprint. According to a report published by ACEA, global new car sales witnesses’ growth in 2023, with sales increasing by almost 10%. The EU new car sales surged by almost 14%, totaling 10.5 million units. New battery-electric car sales grew by 37%, reaching a market share of 14.6%. Global car production hit 76 million units, a substantial 10.2% increase, with China producing over 25.3 million cars. Along with the growing automotive industry the demand for PLCs is on the rise. The scalability of PLCs allows them to be used as standalone controllers or integrated into larger automation systems. Additionally, advancements in technology have enhanced their functionality, making them suitable for increasingly sophisticated industrial processes. The combination of these factors drives the dominant market position of Micro PLCs in the overall market.
Breakup by Offering:
- Hardware
- Software
- Services
Hardware holds the largest share of the industry
A detailed breakup and analysis of the market based on the offering have also been provided in the report. This includes hardware, software and services. According to the report, hardware accounted for the largest market share.
Hardware holds the largest share of the Micro and Nano PLC industry due to the essential role it plays in automation systems. The hardware components, including processors, memory units, and input/output modules, are critical for the reliable operation of PLCs. These components are responsible for executing control algorithms, interfacing with sensors and actuators, and ensuring real-time processing capabilities. The demand for robust, durable, and high-performance hardware drives its dominant market position. As industries increasingly adopt automation technologies, the need for advanced and reliable PLC hardware continues to grow, solidifying its leading share in the market.
Breakup by Architecture:
- Modular PLC
- Fixed/Compact PLC
Modular PLC represents the leading market segment
The report has provided a detailed breakup and analysis of the market based on the architecture. This includes modular PLC and fixed/compact PLC. According to the report, modular PLC represented the largest segment.
Modular PLCs represent the leading segment in the Micro and Nano PLC market due to their flexibility, scalability, and ease of customization. These PLCs consist of separate modules for power supply, processor, and input/output, allowing users to tailor systems to specific application needs. This modularity supports expansion and upgrades without replacing the entire system, making it cost-effective and adaptable to evolving industrial requirements. The ability to integrate various communication protocols and advanced features enhances their utility across diverse industries, solidifying modular PLCs' dominant position in the market.
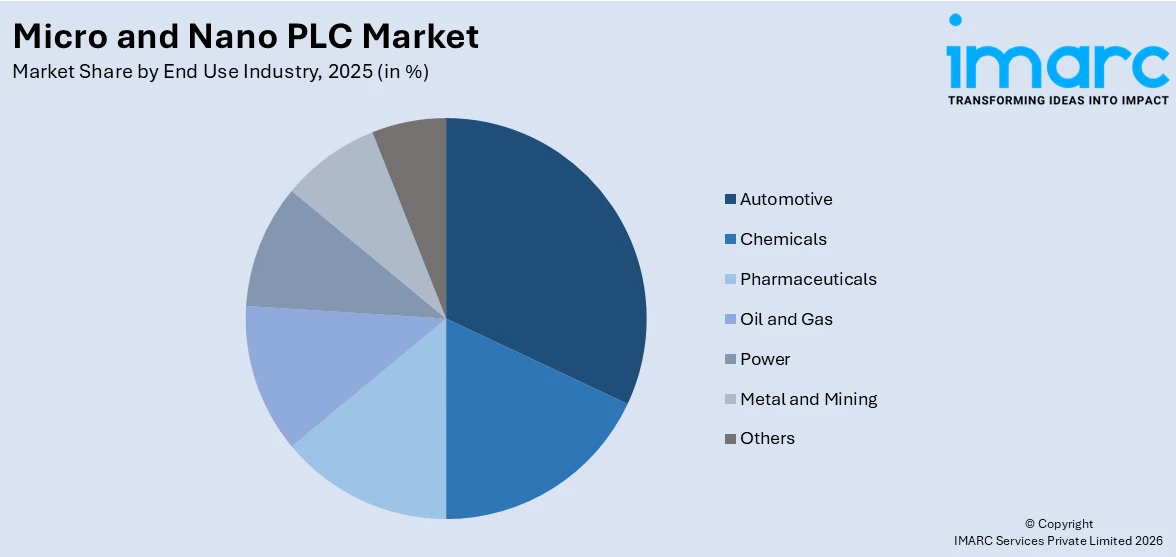
Breakup by End Use Industry:
Access the comprehensive market breakdown Request Sample
- Automotive
- Chemicals
- Pharmaceuticals
- Oil and Gas
- Power
- Metal and Mining
- Others
Automotive exhibits a clear dominance in the market
A detailed breakup and analysis of the market based on the end use industry have also been provided in the report. This includes automotive, chemicals, pharmaceuticals, oil and gas, power, metal and mining and others. According to the report, automotive accounted for the largest market share.
The automotive industry exhibits clear dominance in the market due to its extensive use of automation for manufacturing processes. PLCs are crucial in automotive assembly lines, controlling robotics, conveyors, and other automated systems to enhance production efficiency, precision, and safety. The industry's push towards smart manufacturing and the integration of advanced technologies such as AI and IoT further drives the demand for Micro and Nano PLCs. These PLCs support the development of innovative manufacturing solutions, enabling the automotive sector to maintain high productivity levels and adapt to evolving market demands.
Breakup by Region:
- North America
- United States
- Canada
- Asia-Pacific
- China
- Japan
- India
- South Korea
- Australia
- Indonesia
- Others
- Europe
- Germany
- France
- United Kingdom
- Italy
- Spain
- Russia
- Others
- Latin America
- Brazil
- Mexico
- Others
- Middle East and Africa
North America leads the market, accounting for the largest micro and nano PLC market share
The report has also provided a comprehensive analysis of all the major regional markets, which include North America (the United States and Canada); Europe (Germany, France, the United Kingdom, Italy, Spain, Russia, and others); Asia Pacific (China, Japan, India, South Korea, Australia, Indonesia, and others); Latin America (Brazil, Mexico, and others); and the Middle East and Africa. According to the report, North America represents the largest regional market for micro and nano PLC.
North America leads the Micro and Nano PLC market, accounting for the largest market share due to its advanced industrial infrastructure and high adoption rate of automation technologies. North America has a robot density of 188 units per 10,000 employees, with the United States ranking among the top ten most automated countries. The region's strong manufacturing base, particularly in the automotive, aerospace, and electronics industries, drives the demand for efficient and compact PLC solutions. Additionally, the presence of leading PLC manufacturers and a focus on integrating advanced technologies such as IoT and AI into industrial processes contribute to the market's growth. Supportive government policies and significant investments in R&D further bolster North America's dominant position in the Micro and Nano PLC market.
Competitive Landscape:
- The market research report has also provided a comprehensive analysis of the competitive landscape in the market. Detailed profiles of all major companies have also been provided. Some of the major market players in the micro and nano PLC industry include ABB Ltd., B&R Industrial Automation GmbH, General Electric Company, IDEC Corporation, Mitsubishi Electric Corporation, Omron Corporation, Robert Bosch Stiftung Gmbh, Rockwell Automation Inc., Schneider Electric and Siemens Aktiengesellschaft. etc.
(Please note that this is only a partial list of the key players, and the complete list is provided in the report.)
- The Micro and Nano PLC market is highly competitive, characterized by the presence of several key players focusing on innovation and technological advancements. Companies invest heavily in R&D to develop advanced features such as enhanced connectivity, improved processing power, and integration with IoT and AI technologies. ABB made an investment in Ndustrial, a US-based clean technology startup specializing in AI-powered energy management. This investment complements ABB's recent stake in GridBeyond and aims to strengthen ABB Electrification's innovation ecosystem. Ndustrial's platform helps companies optimize energy consumption in real time, reduce operating costs, and accelerate decarbonization. The investment reflects ABB's commitment to industrial electrification and energy savings. The competitive landscape is further intensified by regional players and new entrants who offer cost-effective and customizable solutions to meet specific industry needs, driving continuous product evolution and market growth.
Micro and Nano PLC Market News:
- In May 2024, ABB acquired Siemens' Wiring Accessories business in China, expanding its market reach and reinforcing its position in the wiring accessories market. The acquisition provides access to a vast distributor network and expertise from regional sales, manufacturing, and management teams. This strategic move reflects ABB's commitment to growth in China and its focus on delivering a full range of building automation and energy distribution solutions.
- In September 2023, IDEC Corporation announced that it has acquired 80% of the shares of French mobility solutions manufacturer, ez-Wheel SAS. This partnership aims to enhance IDEC's mission of creating an optimal environment for humans and machines. ez-Wheel's innovative products, such as the Electric Power Assist Wheel (EPAW) and Safety Wheel Drive (SWD), align with IDEC's focus on safety and well-being in human-machine interactions.
Micro and Nano PLC Market Report Scope:
| Report Features | Details |
|---|---|
| Base Year of the Analysis | 2025 |
| Historical Period | 2020-2025 |
| Forecast Period | 2026-2034 |
| Units | Billion USD |
| Scope of the Report | Exploration of Historical Trends and Market Outlook, Industry Catalysts and Challenges, Segment-Wise Historical and Future Market Assessment:
|
| Types Covered | Micro PLC, Nano PLC |
| Offerings Covered | Hardware, Software, Services |
| Architectures Covered | Modular PLC, Fixed/Compact PLC |
| End Use Industries Covered | Automotive, Chemicals, Pharmaceuticals, Oil and Gas, Power, Metal and Mining, Others |
| Regions Covered | Asia Pacific, Europe, North America, Latin America, Middle East and Africa |
| Countries Covered | United States, Canada, Germany, France, United Kingdom, Italy, Spain, Russia, China, Japan, India, South Korea, Australia, Indonesia, Brazil, Mexico |
| Companies Covered | ABB Ltd., B&R Industrial Automation GmbH, General Electric Company, IDEC Corporation, Mitsubishi Electric Corporation, Omron Corporation, Robert Bosch Stiftung Gmbh, Rockwell Automation Inc., Schneider Electric, Siemens Aktiengesellschaft, etc. |
| Customization Scope | 10% Free Customization |
| Post-Sale Analyst Support | 10-12 Weeks |
| Delivery Format | PDF and Excel through Email (We can also provide the editable version of the report in PPT/Word format on special request) |
Key Questions Answered in This Report:
- How has the global micro and nano PLC market performed so far, and how will it perform in the coming years?
- What are the drivers, restraints, and opportunities in the global micro and nano PLC market?
- What is the impact of each driver, restraint, and opportunity on the global micro and nano PLC market?
- What are the key regional markets?
- Which countries represent the most attractive micro and nano PLC market?
- What is the breakup of the market based on the type?
- Which is the most attractive type in the micro and nano PLC market?
- What is the breakup of the market based on the offering?
- Which is the most attractive offering in the micro and nano PLC market?
- What is the breakup of the market based on the architecture?
- Which is the most attractive architecture in the micro and nano PLC market?
- What is the breakup of the market based on the end use industry?
- Which is the most attractive end use industry in the micro and nano PLC market?
- What is the breakup of the market based on the region?
- Which is the most attractive region in the micro and nano PLC market?
- What is the competitive structure of the market?
- Who are the key players/companies in the global micro and nano PLC market?
Key Benefits for Stakeholders:
- IMARC’s industry report offers a comprehensive quantitative analysis of various market segments, historical and current market trends, market forecasts, and dynamics of the micro and nano PLC market from 2020-2034.
- The research report provides the latest information on the market drivers, challenges, and opportunities in the global micro and nano PLC market.
- The study maps the leading, as well as the fastest-growing, regional markets. It further enables stakeholders to identify the key country-level markets within each region.
- Porter's five forces analysis assists stakeholders in assessing the impact of new entrants, competitive rivalry, supplier power, buyer power, and the threat of substitution. It helps stakeholders to analyze the level of competition within the micro and nano PLC industry and its attractiveness.
- The competitive landscape allows stakeholders to understand their competitive environment and provides insight into the current positions of key players in the market.
Need more help?
- Speak to our experienced analysts for insights on the current market scenarios.
- Include additional segments and countries to customize the report as per your requirement.
- Gain an unparalleled competitive advantage in your domain by understanding how to utilize the report and positively impacting your operations and revenue.
- For further assistance, please connect with our analysts.
 Request Customization
 Speak to an Analyst
 Request Brochure
 Inquire Before Buying
Benefits of Customization
- Personalize this research
- Triangulate with your data
- Get data as per your format and definition
- Gain a deeper dive into a specific application, geography, customer, or competitor
- Any level of personalization
Get in Touch With Us
UNITED STATES
Phone: +1-201-971-6302
INDIA
Phone: +91-120-433-0800
UNITED KINGDOM
Phone: +44-753-714-6104
Email: [email protected]
Client Testimonials


.webp)


