
Nanophotonics Market Report by Product Type (LED, OLED, Near Field Optics, Photovoltaic Cells, Optical Amplifiers, Optical Switches, and Others), Nanophotonic Material (Plasmonics, Photonic Crystals, Nanotubes, Nanoribbons, Quantum Dots, and Others), End Use (Telecommunication, Consumer Electronics and Entertainment, Digital Signage, Lighting, Bio-Imaging, and Others), and Region 2026-2034
Nanophotonics Market Size:
The global nanophotonics market size reached USD 17.1 Billion in 2025. Looking forward, IMARC Group expects the market to reach USD 30.0 Billion by 2034, exhibiting a growth rate (CAGR) of 6.27% during 2026-2034. The market is experiencing steady growth driven by innovations in nanomaterials and fabrication techniques leading to the development of highly efficient photonic devices, rising need for high-speed data transmission and processing capabilities in modern telecommunication infrastructures, and the rapid expansion of data centers.
|
Report Attribute
|
Key Statistics
|
|---|---|
|
Base Year
|
2025
|
|
Forecast Years
|
2026-2034
|
|
Historical Years
|
2020-2025
|
|
Market Size in 2025
|
USD 17.1 Billion |
|
Market Forecast in 2034
|
USD 30.0 Billion |
| Market Growth Rate 2026-2034 | 6.27% |
Nanophotonics Market Analysis:
- Major Market Drivers: The market is driven by continuous advancements and innovations in technology, resulting in the development of highly efficient and compact photonic devices. Moreover, the increasing demand for energy-efficient solutions, along with the expansion of telecommunication facilities and data centers is favoring the market growth.
- Key Market Trends: One of the major trends is the increasing adoption of advanced nanomaterials and fabrication techniques that help enhance performance and functionality while enhancing nanophotonic components. The rising demand for energy-efficient technologies, such as LEDs and nanophotonic solar cells, is driving an increased focus on their sustainability, which is another significant trend.
- Geographical Trends: According to the nanophotonics market research report, the fastest growth among regions is exhibited by the Asia-Pacific region, driven by increasing demand for advanced telecommunications and renewable energy solutions. The market is also dominated by North America and Europe, due to large R&D investments made and major technology companies. The
- Competitive Landscape: The market is highly competitive, and players are more focused on research and development to innovate and make improvements in the segment of nanophotonic technologies. Some of the major market players in the industry include Anders Electronics PLC, Cree Inc., Nanosys Inc., Novaled GmbH (Samsung SDI Co.), OSRAM Opto Semiconductors GmbH, Lumileds Holding B.V., Schott AG, Sharp Corporation, STMicroelectronics N.V., Veeco Instruments Inc. and WITec Wissenschaftliche Instrumente and Technologie GmbH, among many others.
- Challenges and Opportunities: Some of the prominent challenges in the market include the high price of nanophotonic devices and complex manufacturing processes. However, some opportunities in the market include large potential energy saving and performance improvement across industries, thereby making nanophotonics a lucrative field for future investments.
To get more information on this market Request Sample
Nanophotonics Market Trends:
Technological advancements and innovations
The market is largely driven by continuous technological advancements and innovations in the sector. Continuous developments in nanomaterials and fabrication techniques results in compact photonic devices that are highly efficient. Some of the most important innovations influencing the performance and functionalities of nanophotonic components are photonic crystals, plasmonics, and metamaterials. These developments allow for applications across industries as diverse as telecommunications, medical diagnostics, and consumer electronics. Therefore, this is significantly supporting the market. Manipulation of light at a nanoscale is enabling multiple breakthroughs in optical computing, high-resolution imaging, and efficient solar energy harvesting. Moreover, the growing investments in R&D by researchers and companies for the new possibilities and refinement of technologies are creating a positive nanophotonics market outlook.
Growing demand for energy-efficient solutions
One of the major drivers in the market is the rising emphasis on energy efficiency and sustainability. Nanophotonic technologies make large improvements in energy consumption for several applications, ranging from lighting and data transmission to display systems. Along with this, the growing adoption of integral components such as light-emitting diodes and laser diodes at large scales as they offer superior energy efficiency compared to traditional lighting sources is also positively influencing the market. Besides, the efficiency rates for nanophotonic solar cells are higher, making them appealing in renewable energy solutions. Furthermore, the rising demand for nanophotonic devices due to the rise in global energy demand and increasing concern for the environment is also favoring the nanophotonics market growth.
Expansion of telecommunications and data centers
The rapid expansion of telecommunications and data centers is a critical market driver. Additionally, the increasing preference for advanced photonic solutions due to the growing demand for high-speed internet and a corresponding proliferation in data-intensive applications including cloud computing, video streaming, and IoT is fostering a preference for advanced photonic solutions by necessitating more efficient and higher-capacity data transmission methods. Moreover, nanophotonic devices, such as optical switches, modulators, and interconnects are important in enhancing the performance and efficiency of optical communication networks. This allows for the handling of large volumes of data with minimal latency and energy consumption, making them ideal for supporting the heavy data loads and high performance required by modern digital applications. As a result, the rapidly growing global connectivity and increasing consumption of data are providing impetus to the market.
Nanophotonics Market Segmentation:
IMARC Group provides an analysis of the key trends in each segment of the market report, along with forecasts at the global, regional and country levels from 2026-2034. Our report has categorized the market based on product type, nanophotonic material, and end use.
Breakup by Product Type:
To get detailed segment analysis of this market Request Sample
- LED
- OLED
- Near Field Optics
- Photovoltaic Cells
- Optical Amplifiers
- Optical Switches
- Others
LED accounts for the majority of the market share
The report has provided a detailed breakup and analysis of the market based on the product type. This includes LED, OLED, near field optics, photovoltaic cells, optical amplifiers, optical switches, and others. According to the report, LED represented the largest segment.
Among the different product types, LEDs represent the largest segment of the market, majorly as a result of their wide adoption and superior performance characteristics. Due to the characteristics of high energy efficiency, long life, and low operational costs, LEDs are taking over the lighting markets against traditional incandescent and fluorescent lighting. Further integration of nanophotonic technologies in LEDs enhanced their efficiency and brightness, making them fit for all sorts of lighting applications that span from residential, commercial, automotive, and industrial lighting. Additionally, the lighting market is trending towards smart lighting solutions as well. Apart from this, governments across the globe are also adopting increasing numbers of LED-based energy-conservation plans which is providing a boost to the nanophotonics market value. Continuous progress with nanomaterials, together with multi-technological improvements, increase their performance and decreases their costs. That, at a time, expands the areas of LED application. Moreover, demand for LEDs used in light applications is witnessing significant growth with sustainability and energy efficiency becoming central global issues.
Breakup by Nanophotonic Material:
- Plasmonics
- Photonic Crystals
- Nanotubes
- Nanoribbons
- Quantum Dots
- Others
Quantum dots hold the largest share of the industry
A detailed breakup and analysis of the market based on the nanophotonic material have also been provided in the report. This includes plasmonics, photonic crystals, nanotubes, nanoribbons, quantum dots, and others. According to the report, quantum dots accounted for the largest market share.
Quantum dots hold the largest share of the market due to special optical and electronic properties, which are unexcelled in a wide range of modern technological applications. Nanoscale semiconductor particles show size-dependent quantum mechanical properties that allow emitting light at specific wavelengths with exceptional brightness and color purity. The trait is beneficial for display technology in which quantum dots enable displays that are more vivid in color and use fewer resources on televisions, monitors, and even mobile devices. Their application also enhances photovoltaic efficiency in solar cells, due to advanced rates of light absorption and conversion, thus developing renewable energy solutions. Their application in biological imaging and medical diagnostics is also increasing, helping to offer high-resolution imaging capabilities that are important in disease detection and research. According to the nanophotonics market overview, the rising investments in the research and development of quantum dot technology to attain continuous performance improvements and better cost-effectiveness is accelerating its adoption in numerous industries. Quantum dots hold the lead position in the market as the demand for highly improved materials, which can meet all stringent requirements of modern electronic and optoelectronic devices is increasing.
Breakup by End Use:
- Telecommunication
- Consumer Electronics and Entertainment
- Digital Signage
- Lighting
- Bio-Imaging
- Others
Consumer electronics and entertainment represents the leading market segment
The report has provided a detailed breakup and analysis of the market based on the end use. This includes telecommunication, consumer electronics and entertainment, digital signage, lighting, bio-imaging, and others. According to the report, consumer electronics and entertainment represented the largest segment.
Consumer electronics and entertainment represent the largest end-use segment in the market, due to the growing demand for advanced and high-performance devices that raise user experiences. The nanophotonics market forecast indicates that this sector is facing rapid transformation with the introduction of display technologies, OLEDs, and quantum dot LEDs that offer the highest color accuracy, brightness, and energy efficiency. High-performance displays are part of smartphones, tablets, laptops, and televisions due to advanced nanophotonic materials and components. Along with this, the growing application of nanophotonics in VR and AR devices is enhancing visual display quality, providing better user immersion, and engendering growth in the gaming and immersive entertainment sectors. Manufacturers are thus investing in nanophotonic technologies in an attempt to meet the consumer who increasingly seeks better performance, lower power consumption, and enhanced visual appeal. The continuous innovation in the miniaturization of electronic components is also facilitating the development of compact and lightweight devices and is thus further fueling the market growth.
Breakup by Region:
To get more information on the regional analysis of this market Request Sample
- North America
- United States
- Canada
- Asia-Pacific
- China
- Japan
- India
- South Korea
- Australia
- Indonesia
- Others
- Europe
- Germany
- France
- United Kingdom
- Italy
- Spain
- Russia
- Others
- Latin America
- Brazil
- Mexico
- Others
- Middle East and Africa
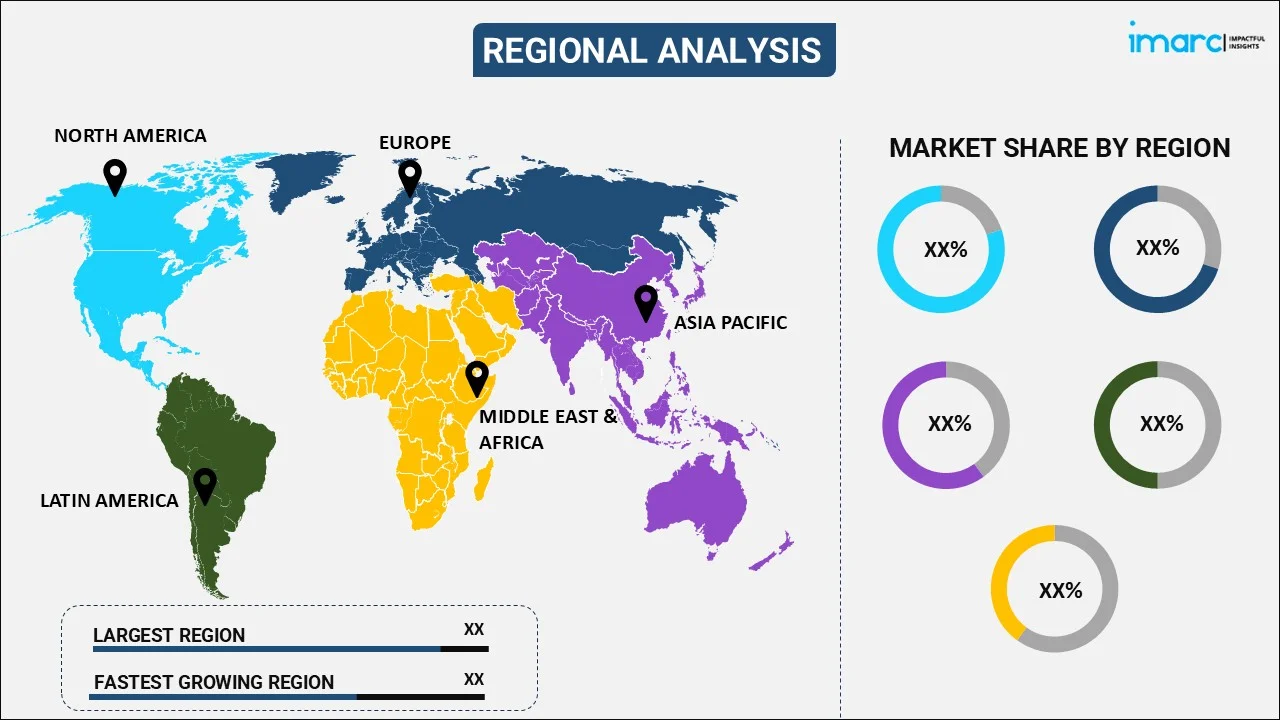
Asia Pacific leads the market, accounting for the largest nanophotonics market share
The report has also provided a comprehensive analysis of all the major regional markets, which include North America (the United States and Canada); Asia Pacific (China, Japan, India, South Korea, Australia, Indonesia, and others); Europe (Germany, France, the United Kingdom, Italy, Spain, Russia, and others); Latin America (Brazil, Mexico, and others); and the Middle East and Africa. According to the report, Asia Pacific represents the largest regional market for nanophotonics.
The Asia Pacific is the largest regional segment of the market, driven by rapid industrialization, rapid technological development, and huge investments in sectors such as electronics and telecommunications. Countries such as China, Japan, South Korea, and Taiwan are among the leading adopters of nanophotonic technologies, including their integration into a host of applications ranging from consumer electronics to highly advanced medical devices. It has a strong manufacturing base. Therefore, a robust supply chain infrastructure is sustaining large-scale production and commercialization of nanophotonic components in the region. Moreover, increasing consumer demand for high-performance, energy-efficient electronic devices and numerous initiatives on the part of governments, encouraging innovation and sustainable development are supporting the nanophotonics demand. A robust research and development ecosystem is currently being established across the Asia Pacific, where leading universities and research institutions are collaborating with industry giants to drive technological breakthroughs in the field. As a result, nanophotonics represents a dynamic and rapidly growing market in the Asia Pacific, reflecting its pivotal role in the global technology landscape.
Competitive Landscape:
- The market research report has also provided a comprehensive analysis of the competitive landscape in the market. Detailed profiles of all major companies have also been provided. Some of the major market players in the nanophotonics industry include Anders Electronics PLC, Cree Inc., Nanosys Inc., Novaled GmbH (Samsung SDI Co.), OSRAM Opto Semiconductors GmbH, Lumileds Holding B.V., Schott AG, Sharp Corporation, STMicroelectronics N.V., Veeco Instruments Inc. and WITec Wissenschaftliche Instrumente und Technologie GmbH.
(Please note that this is only a partial list of the key players, and the complete list is provided in the report.)
- Key nanophotonics companies are focusing on strategic activities such as mergers and acquisitions, partnerships, and investing heavily in research and development (R&D) to sustain their market share. Companies are dedicatedly working on the development of cutting-edge nanophotonic components and systems that enable improved data transmission and reduce energy consumption, thereby maximizing the performance of consumer electronics. They are further investing in new state-of-the-art fabrication techniques that, coupled with new nanomaterials, can significantly improve performance and lower the cost of nanophotonic devices. Therefore, this is positively contributing to the nanophotonics market revenue. Additionally, collaborations with academic institutions and research organizations help translate basic groundbreaking research into commercial applications. These players are further exploring new application areas such as biomedical imaging, quantum computing, and renewable energy solutions to utilize the unique benefits of nanophotonics in mitigating the upcoming technological challenges and market demand.
Nanophotonics Market News:
- September 21, 2023: Quantum Computing Inc., a technology company in quantum optics and nanophotonics, announced that it has chosen the ASU Research Park in Tempe, Arizona, for its new quantum photonic chips manufacturing facility where the company will produce its Thin Film Lithium Niobate (TFLN) chips.
- June 6, 2024: Riga Technical University (RTU), led by Associate Professor Toms Salgals, has established the Nanophotonics Laboratory to advance research in nanophotonics and nanostructured optoelectronics, aiming to enhance high-speed communication and quantum technologies. The lab's pioneering work on light-matter interactions at the nanoscale has significant potential applications in telecommunications, supported by advanced equipment such as self-built optical tweezers.
- November 1, 2023: For the first time, researchers from FAU and Stanford University have demonstrated a nanophotonic electron accelerator, significantly reducing the size and cost of traditional accelerators by using lasers to accelerate electrons within photonic nanostructures. Published in Nature, this breakthrough aims to develop compact accelerators for applications in medicine and other fields, marking a major advancement in accelerator physics.
Nanophotonics Market Report Scope:
| Report Features | Details |
|---|---|
| Base Year of the Analysis | 2025 |
| Historical Period | 2020-2025 |
| Forecast Period | 2026-2034 |
| Units | Billion USD |
| Scope of the Report | Exploration of Historical Trends and Market Outlook, Industry Catalysts and Challenges, Segment-Wise Historical and Future Market Assessment:
|
| Product Types Covered | LED, OLED, Near Field Optics, Photovoltaic Cells, Optical Amplifiers, Optical Switches, Others |
| Nanophotonic Materials Covered | Plasmonics, Photonic Crystals, Nanotubes, Nanoribbons, Quantum Dots, Others |
| End Uses Covered | Telecommunication, Consumer Electronics and Entertainment, Digital Signage, Lighting, Bio-Imaging, Others |
| Regions Covered | Asia Pacific, Europe, North America, Latin America, Middle East and Africa |
| Countries Covered | United States, Canada, Germany, France, United Kingdom, Italy, Spain, Russia, China, Japan, India, South Korea, Australia, Indonesia, Brazil, Mexico |
| Companies Covered | Anders Electronics PLC, Cree Inc., Nanosys Inc., Novaled GmbH (Samsung SDI Co.), OSRAM Opto Semiconductors GmbH, Lumileds Holding B.V., Schott AG, Sharp Corporation, STMicroelectronics N.V., Veeco Instruments Inc., WITec Wissenschaftliche Instrumente und Technologie GmbH, etc. |
| Customization Scope | 10% Free Customization |
| Post-Sale Analyst Support | 10-12 Weeks |
| Delivery Format | PDF and Excel through Email (We can also provide the editable version of the report in PPT/Word format on special request) |
Key Benefits for Stakeholders:
- IMARC’s industry report offers a comprehensive quantitative analysis of various market segments, historical and current market trends, market forecasts, and dynamics of the nanophotonics market from 2020-2034.
- The research report provides the latest information on the market drivers, challenges, and opportunities in the global nanophotonics market.
- The study maps the leading, as well as the fastest-growing, regional markets. It further enables stakeholders to identify the key country-level markets within each region.
- Porter's five forces analysis assists stakeholders in assessing the impact of new entrants, competitive rivalry, supplier power, buyer power, and the threat of substitution. It helps stakeholders to analyze the level of competition within the nanophotonics industry and its attractiveness.
- The competitive landscape allows stakeholders to understand their competitive environment and provides insight into the current positions of key players in the market.
Frequently Asked Questions About the Nanophotonics Market Report
The global nanophotonics market was valued at USD 17.1 Billion in 2025.
We expect the global nanophotonics market to exhibit a CAGR of 6.27% during 2026-2034.
The rising demand for nanophotonics to manufacture LED and OLED components with compressed size, higher functionalities, improved data transmission speed, and longer operational life, is primarily driving the global nanophotonics market.
The sudden outbreak of the COVID-19 pandemic had led to the implementation of stringent lockdown regulations across several nations, resulting in the temporary closure of numerous manufacturing units for nanophotonics.
Based on the product type, the global nanophotonics market can be segmented into LED, OLED, near field optics, photovoltaic cells, optical amplifiers, optical switches, and others. Currently, LED holds the majority of the total market share.
Based on the nanophotonic material, the global nanophotonics market has been divided into plasmonics, photonic crystals, nanotubes, nanoribbons, quantum dots, and others. Among these, quantum dots currently exhibit a clear dominance in the market.
Based on the end use, the global nanophotonics market can be categorized into telecommunication, consumer electronics and entertainment, digital signage, lighting, bio-imaging, and others. Currently, consumer electronics and entertainment accounts for the largest market share.
On a regional level, the market has been classified into North America, Asia-Pacific, Europe, Latin America, and Middle East and Africa, where Asia-Pacific currently dominates the global market.
Some of the major players in the global nanophotonics market include Anders Electronics PLC, Cree Inc., Nanosys Inc., Novaled GmbH (Samsung SDI Co.), OSRAM Opto Semiconductors GmbH, Lumileds Holding B.V., Schott AG, Sharp Corporation, STMicroelectronics N.V., Veeco Instruments Inc., and WITec Wissenschaftliche Instrumente und Technologie GmbH.
Need more help?
- Speak to our experienced analysts for insights on the current market scenarios.
- Include additional segments and countries to customize the report as per your requirement.
- Gain an unparalleled competitive advantage in your domain by understanding how to utilize the report and positively impacting your operations and revenue.
- For further assistance, please connect with our analysts.
 Request Customization
 Speak to an Analyst
 Request Brochure
 Inquire Before Buying
Benefits of Customization
- Personalize this research
- Triangulate with your data
- Get data as per your format and definition
- Gain a deeper dive into a specific application, geography, customer, or competitor
- Any level of personalization
Get in Touch With Us
UNITED STATES
Phone: +1-201-971-6302
INDIA
Phone: +91-120-433-0800
UNITED KINGDOM
Phone: +44-753-714-6104
Email: [email protected]
Client Testimonials


.webp)


